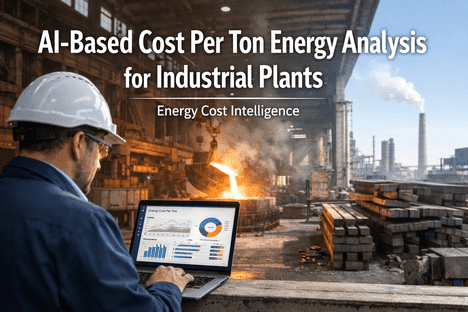
In 2023, a mid-size steel mill in Ohio was paying $38 per ton in energy costs. Their CFO assumed it was fixed — an unavoidable line item baked into the business. Eighteen months later, after deploying AI-driven energy analytics across their EAF furnaces, compressors, and rolling mills, that number dropped to $27 per ton. Same output. Same workforce. Same grid. The only thing that changed was visibility — the plant finally saw where every kilowatt-hour was going, and the AI showed them where it was being wasted. That $11/ton difference translated to $4.2 million in annual savings. Energy cost per ton isn't a fixed number. It's a controllable variable — if you have the intelligence to control it.
Energy Cost Intelligence
Your Energy Bill Doesn't Tell You
What Each Ton Actually Costs.
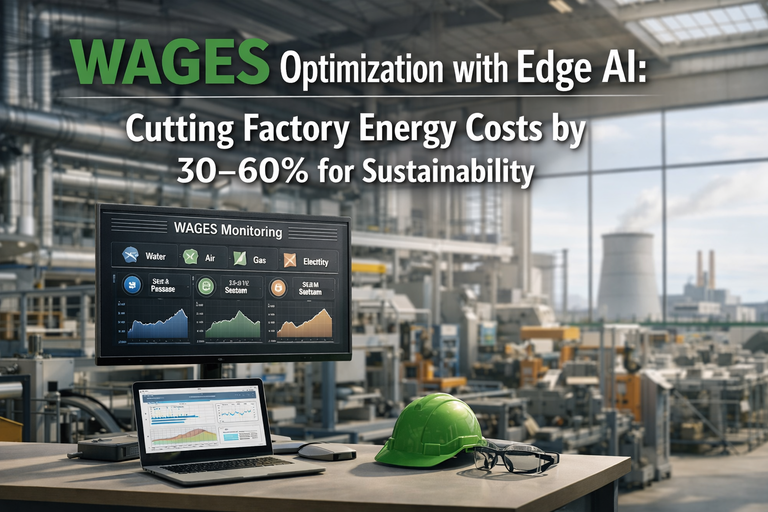
Industrial energy costs account for 30–40% of production expenses in heavy manufacturing. Yet most plants still track energy as a lump-sum overhead — invisible to production decisions. AI changes that equation by connecting every kWh consumed to every ton produced, in real time.
30–40%
Share of production cost from energy in heavy industry
8–15%
Energy savings achievable with AI optimization
95%
Manufacturers planning AI investment by 2027
$150K+
Average annual savings per facility with AI energy analytics
Sources: EIA MECS 2022 · IEA Energy and AI Report 2025 · Rockwell Automation Survey 2025 · iFactory Platform Data 2026
Why "Cost Per Ton" Is the Metric That Matters Most
Most plant managers track total energy spend — a monthly bill that arrives, gets paid, and gets forgotten. But total spend tells you nothing about efficiency. A plant that spent $800,000 on energy last month could be brilliantly efficient or catastrophically wasteful — you can't tell without knowing how many tons it produced, and which processes consumed what.
Cost per ton is the only energy metric that connects consumption to output. It answers the question every operations leader should be asking: How much energy does it take to produce one unit of product — and can we make it less?
Traditional Tracking
What Most Plants See
Monthly electricity bill
$780,000
Natural gas bill
$320,000
Total energy spend
$1,100,000
Cost per ton produced
???
Cost per ton by process
???
Waste vs. productive energy
???
Paying bills. Not managing energy.
AI-Driven Cost Per Ton
What iFactory Reveals
Rolling & finishing
$6.20/ton
Compressed air system
$3.10/ton
HVAC & auxiliaries
$2.80/ton
Idle equipment waste
$4.50/ton
Total energy cost/ton
$35.00/ton
Every dollar traced. Every waste exposed.
Still tracking energy as a lump-sum monthly bill? See your real cost per ton in a live demo.
The Energy Black Hole: Where Plants Lose Money Without Knowing
Research from the IEA and multiple industry benchmarking studies consistently shows that industrial plants waste 15–30% of their energy consumption on processes that add zero value to the final product. The problem isn't that operators are careless — it's that they can't see the waste happening in real time.
22%
Idle Equipment Draw
Motors, compressors, and pumps running at full power during breaks, changeovers, and low-demand periods. Most plants don't track idle vs. productive energy.
18%
Compressed Air Leaks
The U.S. DOE estimates that 20–30% of compressed air is lost to leaks. At $0.25/kWh, a single 1/4-inch leak costs over $8,000/year.
15%
Peak Demand Charges
Starting high-draw equipment simultaneously creates demand spikes. Utilities penalize these peaks — often adding 30–50% to the base rate for that billing cycle.
12%
Thermal Waste
Kilns, furnaces, and boilers losing heat through poor insulation, suboptimal firing, or operating above required temperatures for the product being processed.
20%
Degrading Equipment
A motor with worn bearings draws 20–40% more power than a healthy one. Without continuous monitoring, this energy hemorrhage goes undetected for months.
13%
Batch Scheduling Gaps
Running energy-intensive processes during peak tariff windows when they could be shifted to off-peak hours — a scheduling problem, not a production problem.
How AI Calculates True Cost Per Ton — In Real Time
Traditional energy tracking works backward — wait for the monthly bill, divide by total output, hope the number looks reasonable. AI-driven cost per ton works forward — measuring consumption at every process step, correlating it with production output second-by-second, and surfacing optimization opportunities before money is wasted.
01
Meter-Level Data Ingestion
Smart meters and sub-meters on every major energy consumer — furnaces, motors, compressors, HVAC, lighting — stream consumption data every 10–30 seconds via OPC-UA, Modbus, or MQTT protocols. No more monthly aggregates.
02
Production-Energy Mapping
AI maps energy consumption from each meter to specific production runs, batches, and product types. The system learns which product-mix configurations consume more energy and which are inherently efficient.
03
Baseline & Anomaly Detection
Machine learning establishes energy baselines for each process under normal conditions. When a rolling mill suddenly draws 18% more power than its baseline for the same product, the system flags it within minutes — not months.
04
Cost Attribution Engine
Real-time tariff data (time-of-use rates, demand charges, power factor penalties) is applied to consumption data. Every kWh is priced at the actual rate it was consumed — not an average. Cost per ton is calculated per shift, per line, per product.
05
Optimization Recommendations
The system delivers specific actions: shift Batch B to off-peak, stagger compressor startups by 90 seconds to avoid demand spikes, schedule maintenance on Motor 7A (drawing 35% above baseline). Not dashboards — decisions.
From Monthly Bills to Per-Ton Intelligence
iFactory connects to your existing meters, SCADA systems, and MES platforms — and transforms raw energy data into cost-per-ton analytics with AI-driven optimization recommendations. No rip-and-replace. Live in 30 days.
Industry Benchmarks: What Good Looks Like
Energy cost per ton varies dramatically by industry, process, and geography. But within each sector, there's a clear gap between average performers and AI-optimized leaders. The table below shows typical ranges — and what becomes possible when continuous monitoring replaces periodic guesswork.
Steel (EAF Route)
$35–$45
$27–$34
18–25%
Cement
$28–$38
$22–$30
15–22%
Aluminum Smelting
$55–$75
$42–$58
20–28%
Glass Manufacturing
$20–$30
$16–$24
15–20%
Paper & Pulp
$22–$32
$18–$26
12–18%
Food & Beverage
$8–$15
$6–$11
18–25%
Your Plant
Measuring?
Let's find out
The ROI of Knowing Your Cost Per Ton
Energy cost intelligence isn't an IT project — it's a profitability lever. Plants that deploy AI-driven cost per ton analytics see compounding returns because every insight feeds the next optimization cycle.
Payback Period
4–8 Months
Most plants recover the full cost of deployment through demand charge reduction and idle-load elimination within the first two quarters.
Energy Cost Reduction
12–25%
Continuous optimization of load scheduling, equipment efficiency, and tariff arbitrage delivers sustained savings month after month.
Demand Charge Savings
$15K–$40K/yr
Staggering equipment startups and smoothing peak loads can reduce demand charges by 30–50% — with zero capital investment.
Maintenance Energy Savings
25–40%
Fixing degrading equipment that silently wastes energy — motors, compressors, pumps drawing excess power — saves both maintenance and energy budgets simultaneously.
Carbon Reduction
15–30%
Lower energy per ton directly reduces your carbon footprint per unit — measurable, auditable, and ready for ESG reporting and compliance frameworks.
Enterprise Annual Savings
$1.8M–$3.2M
Multi-site manufacturers deploying iFactory across their portfolio see savings compound as cross-plant benchmarking identifies underperformers.
Why iFactory for Energy Cost Intelligence
01
Unified MES + CMMS + Energy Analytics
Most platforms treat production, maintenance, and energy as separate silos. iFactory unifies them. When a compressor draws 35% above baseline, the AI creates a maintenance work order AND recalculates cost per ton in the same action — one detection, one platform, one fix.
02
Real-Time Tariff-Aware Scheduling
iFactory ingests your utility rate structure — time-of-use tiers, demand charges, power factor penalties, renewable credits — and optimizes production scheduling around the cheapest energy windows without disrupting output targets.
03
Any Meter. Any Protocol. Any Plant.
OPC-UA, Modbus TCP, MQTT, 4-20mA, BACnet — iFactory connects to every industrial metering standard. Your existing smart meters and SCADA systems feed directly into the analytics engine. No rip-and-replace required.
04
Multi-Site Portfolio Benchmarking
Operating 5 plants or 50? iFactory normalizes cost-per-ton data across sites, product lines, and shifts — revealing which facility is the energy leader and which is quietly bleeding margin. One dashboard. All plants. Zero guesswork.
Every Ton You Produce Has a Hidden Energy Cost. It's Time to See It.
iFactory transforms your energy spend from an uncontrollable overhead into a per-ton, per-process, per-shift metric that you can measure, benchmark, and continuously reduce. Connect your meters. See your real cost per ton. Start saving in 30 days.
Frequently Asked Questions
What is energy cost per ton and why does it matter?
Energy cost per ton is the total energy expenditure (electricity, gas, fuel) divided by the total production output in tons. Unlike tracking a monthly energy bill, cost per ton connects consumption directly to productivity — making energy a manageable, optimizable variable rather than a fixed overhead. It's the single most important metric for understanding whether your plant is energy-efficient or energy-wasteful.
How does AI reduce energy cost per ton?
AI reduces cost per ton through three mechanisms: detection (finding equipment consuming excess energy), optimization (scheduling production around cheaper tariff windows and smoothing demand spikes), and prediction (flagging degrading assets that will waste energy before they fail). Together, these typically deliver 12–25% sustained energy cost reduction per ton of output.
How long does it take to deploy energy cost per ton analytics?
iFactory typically achieves first insights within 30 days. The first phase (Days 1–30) connects existing meters and SCADA systems, establishes energy baselines, and identifies quick wins like demand charge reduction. Full optimization with predictive analytics and automated recommendations is live within 60–90 days. Most plants see measurable ROI within the first quarter.
Do we need to install new meters or replace existing equipment?
No. iFactory integrates with any existing metering infrastructure — smart meters, sub-meters, CTs, power analyzers — from any manufacturer. If gaps exist in your metering coverage, we recommend strategic sub-metering at high-consumption points, but the platform starts delivering value with whatever instrumentation you already have installed.
Which industries benefit most from cost per ton energy analytics?
Any industry where energy represents a significant share of production cost benefits — steel, cement, aluminum, glass, paper and pulp, chemicals, food and beverage processing, and automotive manufacturing. The higher your energy-to-revenue ratio, the faster the ROI. Plants where energy exceeds 10% of production cost typically see payback within 4–8 months.
.jpeg)
