A food and beverage manufacturer in the Midwest spent $2.4 million on a digital twin project in 2022. Eighteen months later, the platform was monitoring exactly two assets — and neither was generating actionable predictions. The project had not failed because of bad technology. It failed because the implementation started with the hardest problem first: a full-facility physics model of their most complex production line. The engineering team spent nine months building the model before discovering that the sensor infrastructure to feed it did not exist. By the time additional instrumentation was budgeted, approved, installed, and validated, executive patience had evaporated and the project was quietly shelved. Meanwhile, a competitor with half the budget deployed an AI-powered digital twin platform using a phased roadmap — starting with 12 critical motors monitored by low-cost vibration sensors, expanding to condition-based maintenance within 8 weeks, and achieving full predictive analytics across 200 assets within 10 months. Their total spend was $680,000. Their first-year savings exceeded $2.1 million. Same technology category. Same industry. One organisation tried to boil the ocean. The other followed a roadmap.
iFactory Implementation Intelligence
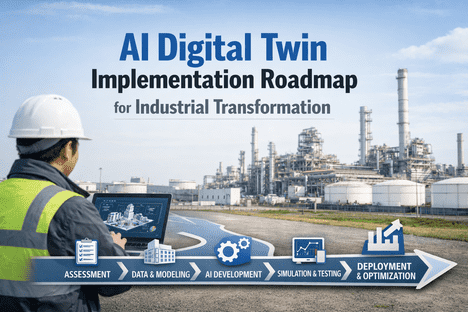
AI Digital Twin Implementation Roadmap for Industrial Transformation
The proven phased approach to deploying digital twin AI in manufacturing — from first sensor to autonomous optimisation — with measurable milestones, realistic timelines, and validated ROI at every stage
4-6 wk
Time to first measurable value
95%
Of predictive maintenance adopters report positive ROI
72%
Of manufacturers planning twin deployment by 2026
12-18mo
Typical full ROI payback period
Why Most Digital Twin Projects Stall — and How to Avoid It
The digital twin market is growing at 48% CAGR and 72% of manufacturers plan deployment by 2026. Yet many early projects have underdelivered — not because the technology lacks merit, but because implementation approaches imported from traditional IT projects do not work for operational technology deployments. Understanding the common failure patterns is the first step to avoiding them.
Boiling the Ocean
Attempting a full-facility digital twin from day one. The scope overwhelms engineering resources, delays value delivery, and exhausts executive patience before results materialise.
Fix Start with 10-20 critical assets. Prove value in weeks, not years. Scale after demonstrated ROI.
Model Before Data
Building elaborate physics models before confirming that sensor infrastructure exists to feed them. Beautiful simulations with no real-time data connection produce academic exercises, not operational tools.
Fix Audit sensor infrastructure first. Deploy data collection before modelling. Let data availability drive model complexity.
No Clear Success Metrics
Launching without defined KPIs makes it impossible to demonstrate ROI. When leadership asks "Is this working?" and the answer requires a 40-slide presentation, the project is already at risk.
Fix Define 3-5 measurable outcomes before deployment. Track weekly. Report monthly in financial terms.
IT-Led Without OT Buy-In
Digital twin projects owned entirely by IT without maintenance and operations involvement. The platform gets built but never adopted because the people who need it were not consulted about what they actually need.
Fix Joint IT-OT ownership from day one. Maintenance champions select pilot assets. Operators validate alert relevance.
The Five-Phase Implementation Roadmap
Successful digital twin deployments follow a predictable pattern: start small, prove fast, scale deliberately. This five-phase roadmap has been validated across manufacturing environments from single-site plants to multi-facility enterprises. Each phase builds on the last, with clear gate criteria before advancing.
Gate
Data flowing from all pilot assets into platform
Assessment and Foundation
Key Activities
Audit existing sensor infrastructure and data sources across SCADA, historians, and maintenance systems
Identify 10-20 critical assets for pilot based on failure cost, downtime impact, and maintenance spend
Deploy additional sensors where gaps exist — vibration, temperature, current monitors at $50-100 per point
Establish platform integrations via OPC-UA, MQTT, and REST APIs to existing ERP and CMMS
Define 3-5 measurable success KPIs with baseline values for comparison
Expected Outcome
Real-time data flowing from pilot assets into the twin platform. Integration with existing systems confirmed. Baseline KPIs documented. Zero disruption to current operations.
Gate
Anomaly detection alerts validated by maintenance team
Condition Monitoring and Baseline Learning
Key Activities
AI models learn normal operating patterns for each pilot asset — load profiles, thermal behaviour, vibration baselines
Real-time health dashboards go live showing condition status, trend charts, and threshold indicators
First anomaly detection alerts begin firing within 4-6 weeks — validated against maintenance team knowledge
False positive tuning to ensure alert relevance and prevent alarm fatigue
First avoided failure or unnecessary maintenance event typically occurs in this phase
Expected Outcome
Maintenance team receiving validated condition alerts. First measurable savings from avoided downtime or eliminated unnecessary maintenance. Confidence building for expansion.
Gate
Predictive alerts achieving 90%+ accuracy on pilot assets
Predictive Analytics and Expansion
Key Activities
LSTM and gradient boosting models begin predicting failures 14-21 days in advance as training data matures
Remaining Useful Life projections go live for pilot assets with continuously updating estimates
Sensor coverage expands to next tier of critical assets — typically 50-100 additional monitoring points
Energy monitoring layer activates, correlating consumption with asset condition and production output
First what-if scenario simulations run on process parameters using the twin models
Expected Outcome
Predictive failure alerts operational with 90%+ accuracy. Energy waste identification producing additional savings. Maintenance team shifting from reactive to proactive mindset. ROI business case validated for full-scale expansion.
Gate
Auto-generated work orders accepted by planning team
Autonomous Workflows and Enterprise Integration
Key Activities
AI auto-generates work orders from condition triggers with correct parts, procedures, and scheduling
Generative AI assistants enable natural language queries on asset health, maintenance history, and performance
Twin data feeds into financial systems — TCO calculations, replacement timing, refurbish-vs-replace analysis
Compliance documentation auto-generated from twin data for ISO 55000, OSHA, and ESG reporting
Coverage scales to 200+ assets across multiple lines or facilities
Expected Outcome
Maintenance planning driven by AI recommendations rather than calendars. Financial and compliance systems receiving automated feeds. The twin platform becoming the operational decision layer for asset management.
Gate
Cross-site benchmarking and continuous self-improvement active
Continuous Optimisation and Strategic Intelligence
Key Activities
Cross-facility benchmarking identifies performance gaps between identical assets at different sites
Digital twins feed strategic CAPEX planning with data-backed replacement and investment recommendations
Sustainability reporting automated — energy per unit of output, carbon intensity, ESG compliance documentation
New asset commissioning uses virtual twin testing before physical installation, cutting ramp-up time 30-40%
AI models continuously retrain, improving prediction accuracy with every operational cycle
Expected Outcome
Digital twin platform operating as the enterprise intelligence layer for all asset-related decisions. Continuous improvement driven by AI rather than periodic reviews. Full ROI typically realised — 10-30x return on investment.
Ready to build your implementation roadmap? Book a free deployment planning session with our engineers.
The Investment Profile: What Each Phase Costs and Returns
One of the most important aspects of a phased roadmap is that investment and returns are distributed across time — not concentrated in a large upfront spend with distant payback. Each phase funds the next through demonstrated savings.
Phase 1
Investment
Sensors, platform setup, integration: $50-150K depending on existing infrastructure and number of pilot assets
Return
Foundation only — no direct financial return yet, but baseline KPIs established for measurement
Phase 2
Investment
Model training, dashboard configuration, team onboarding: $30-80K incremental
Return
First avoided failures and eliminated unnecessary maintenance: typically $100-400K in savings depending on asset criticality
Phase 3
Investment
Additional sensors for expansion, energy monitoring, advanced analytics: $80-200K
Return
Predictive maintenance savings + energy optimisation: $400K-1.2M annually. ROI typically turns positive in this phase.
Phase 4-5
Investment
Enterprise scale-out, advanced integrations, multi-site: $100-300K incremental
Return
Full ROI at 10-30x investment. Annual savings of $1.2-3.5M. Compound improvements from AI model maturity.
Frequently Asked Questions
How do we select the right pilot assets for Phase 1?
Prioritise assets where the cost of unplanned failure is highest, maintenance spend is greatest, or failure frequency is most problematic. The ideal pilot asset is critical enough that avoided downtime produces measurable ROI, but not so complex that modelling delays value delivery. Motors, pumps, compressors, and fans are typical first candidates because they have well-understood failure modes and readily available monitoring sensors.
What if we have very limited existing sensor infrastructure?
That is actually the most common starting point. With industrial vibration sensors now costing $50-100 each and wireless installation requiring no plant shutdown, comprehensive instrumentation of 10-20 pilot assets can be completed in 1-2 weeks for $15-40K. The platform also ingests whatever SCADA and historian data already exists, maximising value from infrastructure you have already paid for.
How long before we can justify the investment to leadership?
Most deployments produce the first avoided failure or eliminated unnecessary maintenance event within 6-10 weeks. For assets with $260K+ per hour downtime cost, a single avoided incident typically exceeds the entire Phase 1 investment. We recommend defining 3-5 financial KPIs upfront and reporting results monthly in dollar terms that executives can directly compare against investment.
Can we run this alongside our existing CMMS and ERP without disruption?
Yes — the phased approach is specifically designed for non-disruptive deployment. The twin platform integrates via standard APIs and runs alongside existing systems. Maintenance teams continue using their current CMMS for work execution while the twin adds predictive intelligence on top. Over time, AI-generated work orders can feed directly into the CMMS, creating a seamless workflow without any rip-and-replace.
What team resources are required for implementation?
Phase 1 typically requires 1-2 maintenance engineers for asset selection and sensor placement (part-time), an IT resource for system integration (2-4 weeks), and a project sponsor for governance. The platform vendor handles model configuration, training, and tuning. Total internal effort in Phase 1 is typically 80-120 person-hours spread over 4 weeks — far less than traditional digital transformation projects.
Start Small. Prove Fast. Scale Deliberately.
Your Digital Twin Journey Starts with 12 Sensors, Not a 12-Month Plan
iFactory's phased implementation roadmap gets your first critical assets monitored in weeks, your first avoided failure documented in months, and your full ROI realised within 12-18 months. Every phase funds the next through demonstrated savings.
4-6wk
Time to first value
$3.5M
Annual savings potential
10-30x
Return on investment