At 03:14 on a Tuesday, compressor #3 on Line B started short-cycling. Nobody noticed. By the time the morning shift walked in, 412 kWh had vanished through a cracked fitting on the main air header — the kind of leak that doesn't stop production but quietly bleeds roughly 18 percent of the compressor's output into the roof space. The monthly utility bill arrived nineteen days later and showed a 6 percent uptick. Finance coded it to "seasonal variation." It was not seasonal variation. It was a fitting the size of a coin.
See every kilowatt-hour, the second it happens — not the month it shows up on the bill.
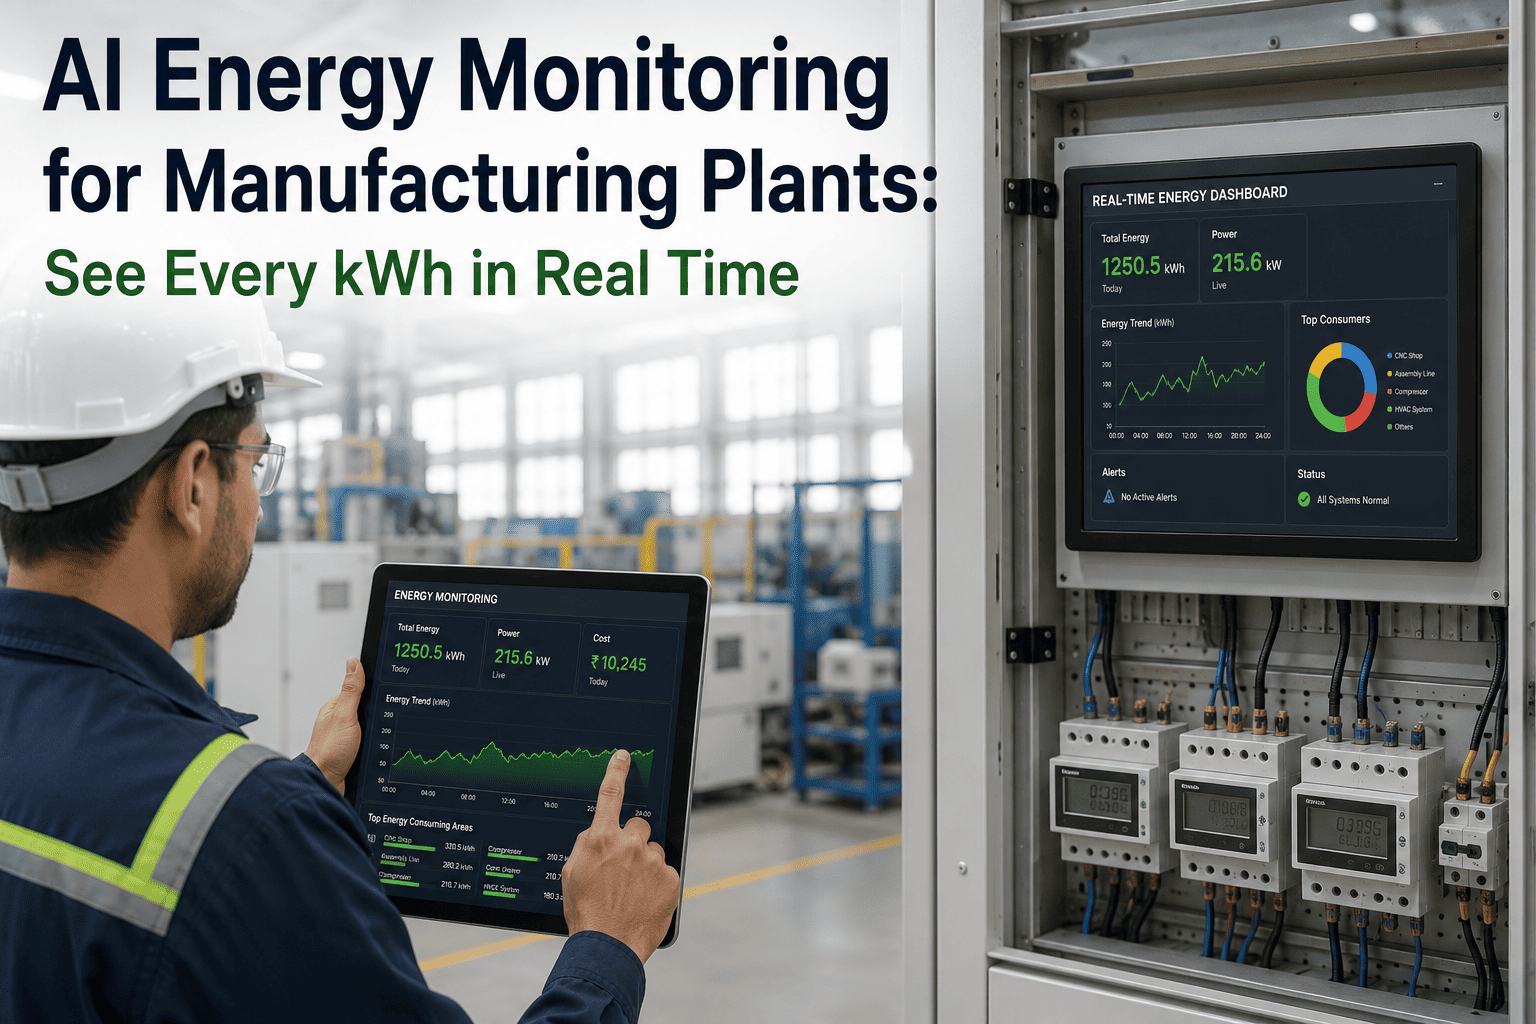
iFactory deploys on-prem AI that ingests meter, PLC and sensor data across your plant floor, disaggregates load down to individual machines, and flags anomalies while they are still cheap to fix. No cloud round-trip. No data leaving your network.
Where plant energy is wasted
Energy loss in a manufacturing plant is rarely one dramatic event. It is the accumulation of five or six small, persistent drains that each look harmless in isolation. Below, each bar is sized to its typical share of avoidable energy spend — the portion an AI monitoring system can recover.
Bars represent typical share of avoidable energy spend, not total consumption. Aggregate figures from industrial energy audits; individual plants vary. The point: the top three categories alone account for roughly two-thirds of recoverable waste, and all three are invisible on a monthly bill.
Why the utility bill is not enough
A monthly bill tells you how much energy you bought. It tells you nothing about where it went, when it was consumed, or which machine caused the spike that pushed you into a higher demand tier. The comparison below shows what each resolution level actually reveals.
- Total kWh for the month
- Peak demand (kW) for the month
- One cost figure to allocate
- kWh per machine, per shift, per part
- Anomaly timestamped to the second
- Demand spikes caught before the 15-min window closes
- Trended against production volume
The utility bill is a settlement document, not a management tool. You cannot manage what you cannot attribute, and you cannot attribute what you cannot see in real time.
Metering and data capture
iFactory does not require you to rip out existing meters. The system ingests from whatever you already have — submeters, main switchboard CTs, PLC tags, BMS outputs, compressor controllers — and fills the gaps with non-invasive current sensors where coverage is thin. The matrix below maps each data source to what it unlocks.
| Data source | Typical interval | What it enables | Integration effort |
|---|---|---|---|
| Main switchboard CTs | 1–15 min | Plant-level load profile, demand-peak detection | Low — Modbus / OPC UA read |
| Submeters (panel-level) | 1–5 min | Line- and area-level attribution | Low if Modbus; medium if proprietary |
| Machine-level CTs / Rogowskis | 1–10 sec | Per-machine kWh, load disaggregation training data | Medium — non-invasive clamp-on |
| PLC tags (current, pressure, speed) | 100 ms–1 sec | State detection, idle vs active classification | Low — OPC UA / MQTT bridge |
| Compressor controller (Modbus) | 5–30 sec | Air-system efficiency, leak estimation | Low |
| BMS / SCADA export | 1–15 min | HVAC, lighting, environment context | Low — REST / SQL poll |
| Production system (MES / ERP) | Per event | Parts produced — enables kWh-per-unit KPI | Medium — API or CSV feed |
Rule of thumb: if you can get a signal out of it over Modbus, OPC UA, MQTT, or a REST endpoint, iFactory can ingest it. Where no signal exists, a clamp-on current sensor on the motor feed is usually enough to start attributing kWh within a day.
AI load disaggregation and per-machine kWh
You do not need a meter on every motor. iFactory's on-prem AI model learns the electrical signature of each machine from a short training window, then disaggregates the aggregate feed into per-machine consumption. The chart below contrasts the raw panel signal with what the model recovers underneath it.
The model trains on roughly two weeks of co-located meter + PLC data, then runs continuously inside the plant network. No electrical waveforms leave the facility. Inference latency is under 200 ms, so anomalies surface while the operator can still act.
Anomaly and demand-spike alerts
Most energy waste is not a single fault — it is a slow drift that crosses a threshold you never set because you never had the data to set one. iFactory learns the normal envelope for each machine and alerts on three classes of deviation. The heatmap below shows a real week of alerts on one line.
The Wednesday cluster (darkest cells) corresponds to the compressor short-cycle event. The heatmap makes the pattern obvious in retrospect; the alert system makes it obvious in real time — which is the only time you can still do something about it.
Energy-per-unit KPI and benchmarking
Total kWh is a blunt instrument. The metric that actually drives decisions is kWh per part — the energy equivalent of OEE. It normalizes for production volume, so you can compare shifts, lines, and even sister plants on a like-for-like basis. The gauge below shows where a typical plant sits before and after the first 90 days of monitoring.
| Line | kWh / part (current) | Baseline (learned) | Variance | Status |
|---|---|---|---|---|
| Line A — Stamping | 1.62 | 1.65 | −2% | On baseline |
| Line B — Assembly | 1.71 | 1.70 | +1% | On baseline |
| Line C — Packaging | 2.18 | 1.80 | +21% | Drift detected |
| Line D — CNC machining | 1.94 | 1.95 | −1% | On baseline |
| Line E — Paint booth | 3.42 | 3.10 | +10% | Investigate |
Line C is the one that would never surface on a utility bill. Total plant kWh is flat because Line A improved and Line C regressed. Without per-line attribution, the net looks fine. It is not fine.
Rollout roadmap
iFactory ships a pre-configured NVIDIA AI server, racked and ready. The system runs entirely inside your plant network — no data leaves the facility. A typical deployment goes live in 6 to 12 weeks across three phases.
The AI runs on-prem, so this conversation and the underlying electrical data never touch a public cloud. 99.9% uptime across 1000+ industrial clients. Book a demo to see the dashboard on your own data.
Frequently asked questions
Every day without per-machine monitoring is a day of leaks, drift, and demand spikes you pay for at month-end.
Book a 30-minute demo. We'll walk through your plant's metering landscape and show you exactly where kWh is hiding — before you spend another dollar on a bill you can't explain.