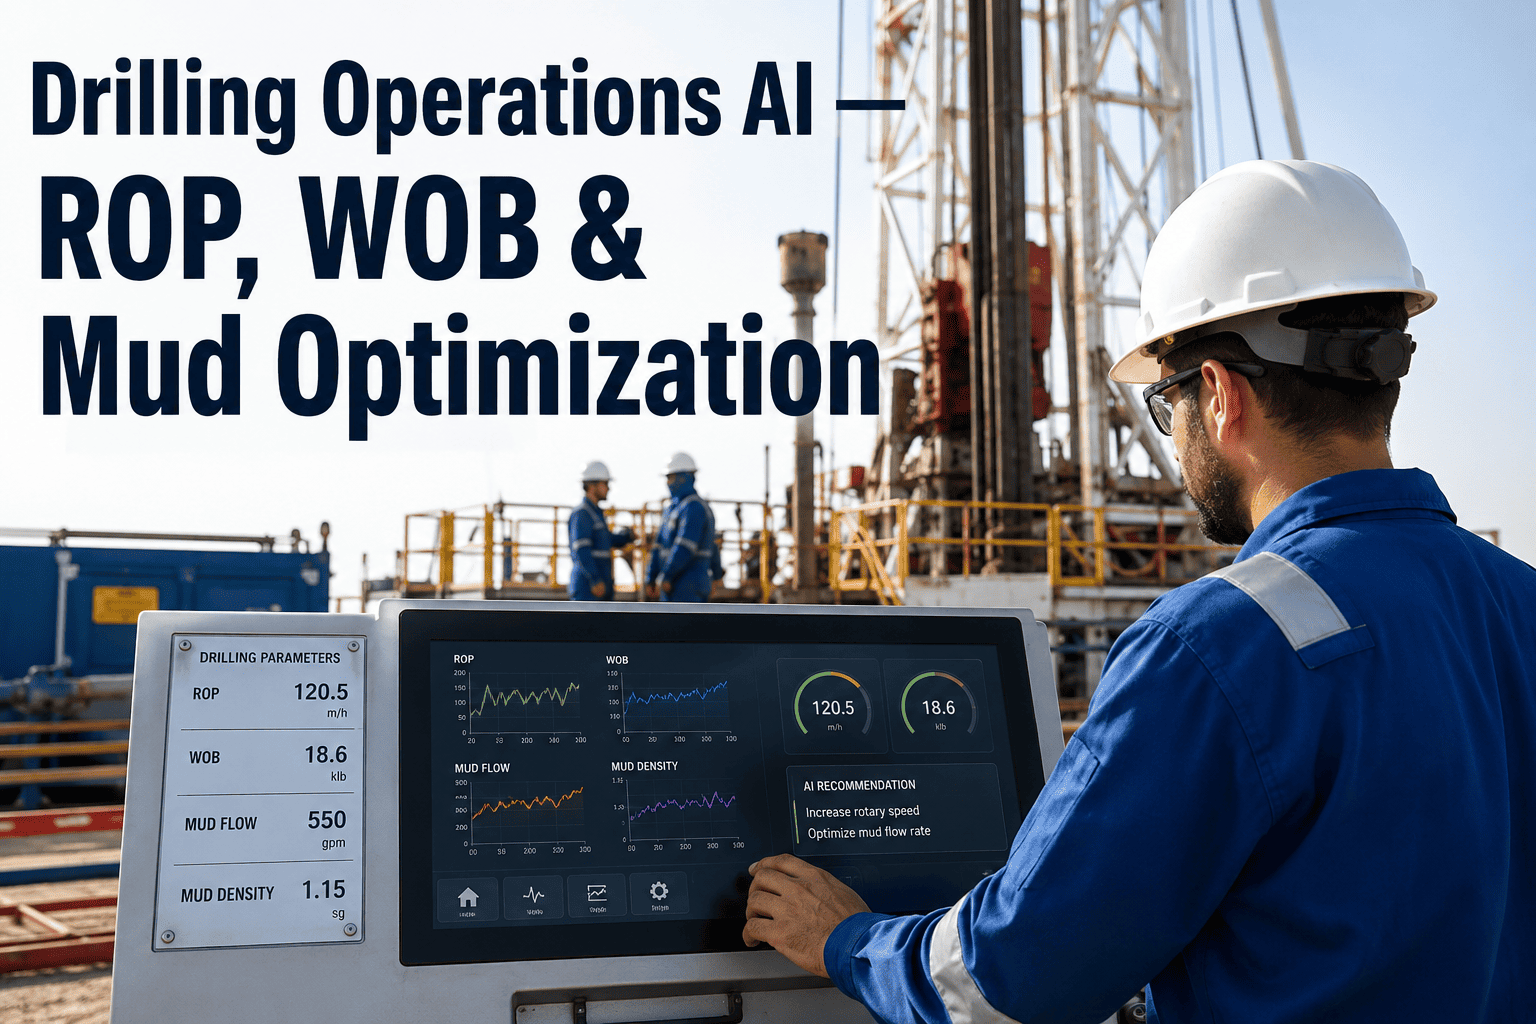
Every foot of hole drilled has a cost attached to it, and on most rigs that cost is set more by habit than by data. A driller running weight on bit and rotary speed at yesterday's settings because they worked in the last formation is leaving rate of penetration on the table — sometimes 15–20% of it — simply because nobody flagged that the formation changed three hundred feet ago. AI-based drilling optimization exists to close exactly that gap: reading mechanical specific energy, torque, and mud properties in real time and recommending parameter changes before the bit tells you the hard way. Drilling teams who want to see this modeled against an actual well plan can book a demo with their own offset well data.
Why Rate of Penetration Optimization Is Harder Than It Looks
Rate of penetration prediction is not a single-variable problem. ROP responds to weight on bit, rotary speed, mud weight, hydraulics, and formation hardness simultaneously, and the relationship between them shifts every time the bit crosses a formation boundary. A driller adjusting WOB alone without accounting for torque response or bit wear is optimizing one dimension of a five-dimensional problem — which is why manual parameter tuning plateaus quickly while AI-based optimization keeps finding incremental gains across the whole lateral.
The Drilling Parameter Stack — Depth by Depth
Think of drilling optimization as a track that runs alongside the wellbore itself: at every depth interval, a different combination of parameters becomes the limiting factor. The track below shows how the priority parameter shifts as a well progresses from surface to lateral.
Surface Hole — Hydraulics Priority
Mud rheology and hole cleaning dominate; ROP is secondary to wellbore stability at shallow depth.
Intermediate — WOB & RPM Tuning
Weight on bit and rotary speed optimization drive most of the ROP gain through consistent formation.
Curve Section — Torque & Drag Modeling
Torque drag modeling becomes critical as directional build rate increases friction along the wellbore.
Lateral — MSE & Bit Wear Monitoring
Mechanical specific energy trends flag bit wear and stuck pipe risk before they cost the well time.
Comparing Drilling Optimization Methods by Impact
Not all optimization levers deliver equal value. The table below ranks the most common drilling optimization techniques by typical ROP impact and the operational complexity of implementing them. Book a demo to see which combination fits your current rig instrumentation.
| Optimization Technique | Primary Variable | Typical ROP Gain | Implementation Complexity |
|---|---|---|---|
| Manual WOB/RPM adjustment | Driller experience | Baseline | Low |
| Real-time MSE monitoring | Mechanical specific energy | 5–8% | Low |
| Automated drill-off tests | WOB response curve | 8–12% | Medium |
| AI-based parameter recommendation | Multi-variable model | 12–20% | Medium |
| Closed-loop autonomous drilling | Full parameter automation | 18–25% | High |
Stuck Pipe Prevention: Reading the Warning Signs Before They Cost a Day
Stuck pipe prevention is where drilling analytics delivers its clearest financial case, because a single incident can cost as much as several days of optimized drilling. The pattern that precedes most stuck pipe events is visible in the data well before it becomes a physical problem — rising torque with flat ROP, increasing standpipe pressure, or cuttings analysis showing poor hole cleaning. AI-based drilling optimization platforms watch these signals continuously across every well on a pad, rather than relying on a single driller's pattern recognition built up over years on the rig floor.
Classic differential sticking precursor — bit is loading up without corresponding penetration gain.
Equivalent circulating density trending toward formation limits signals wellbore instability risk.
Returns lower than expected for the drilled interval indicate poor hole cleaning and pack-off risk.
Gradual pressure increase at constant flow rate often precedes a mechanical sticking event.
Mud Weight Management and the Well Time-Depth Curve
Mud weight management sits at the intersection of safety and speed — too light and you risk a kick, too heavy and you slow ROP while increasing formation damage risk. The well time-depth curve is the clearest visual record of how well these decisions were made across a well's life, and AI-based drilling optimization tools now overlay a predicted curve against the actual curve in real time, so deviations are visible the moment they start rather than at the post-well review. Operators using this comparison consistently identify which specific interval cost them the most time, turning a subjective post-mortem into a data-backed lessons-learned document that improves the next well plan.
Frequently Asked Questions: Drilling Optimization and ROP Improvement
How does AI improve rate of penetration compared to manual driller adjustments?
AI models continuously correlate WOB, RPM, torque and mud properties against real-time ROP response, recommending adjustments faster than a driller can pattern-match manually, especially through frequent formation changes. Book a demo to see the model applied to an offset well from your own field.
What is mechanical specific energy and why does it matter for drilling efficiency?
MSE measures the energy required to remove a unit volume of rock, making it one of the earliest indicators of bit wear or inefficient parameter combinations. A rising MSE trend at constant ROP is one of the most reliable early warning signs in drilling analytics.
Can drilling optimization software prevent stuck pipe incidents entirely?
No system eliminates stuck pipe risk completely, but continuous monitoring of torque, ECD and cuttings trends catches the majority of preventable incidents early enough for the driller to adjust parameters before the pipe becomes mechanically stuck.
How is torque and drag modeling different from real-time torque monitoring?
Torque drag modeling predicts expected friction along the planned wellbore trajectory before drilling begins, while real-time monitoring compares actual torque against that model continuously, flagging deviations that indicate wellbore instability or pack-off risk.
What rig instrumentation is required to deploy drilling optimization AI?
Most platforms integrate with existing surface data acquisition systems already logging WOB, RPM, torque, standpipe pressure and mud properties, so no new downhole hardware is typically required. Talk to support about your current rig data setup to confirm compatibility.