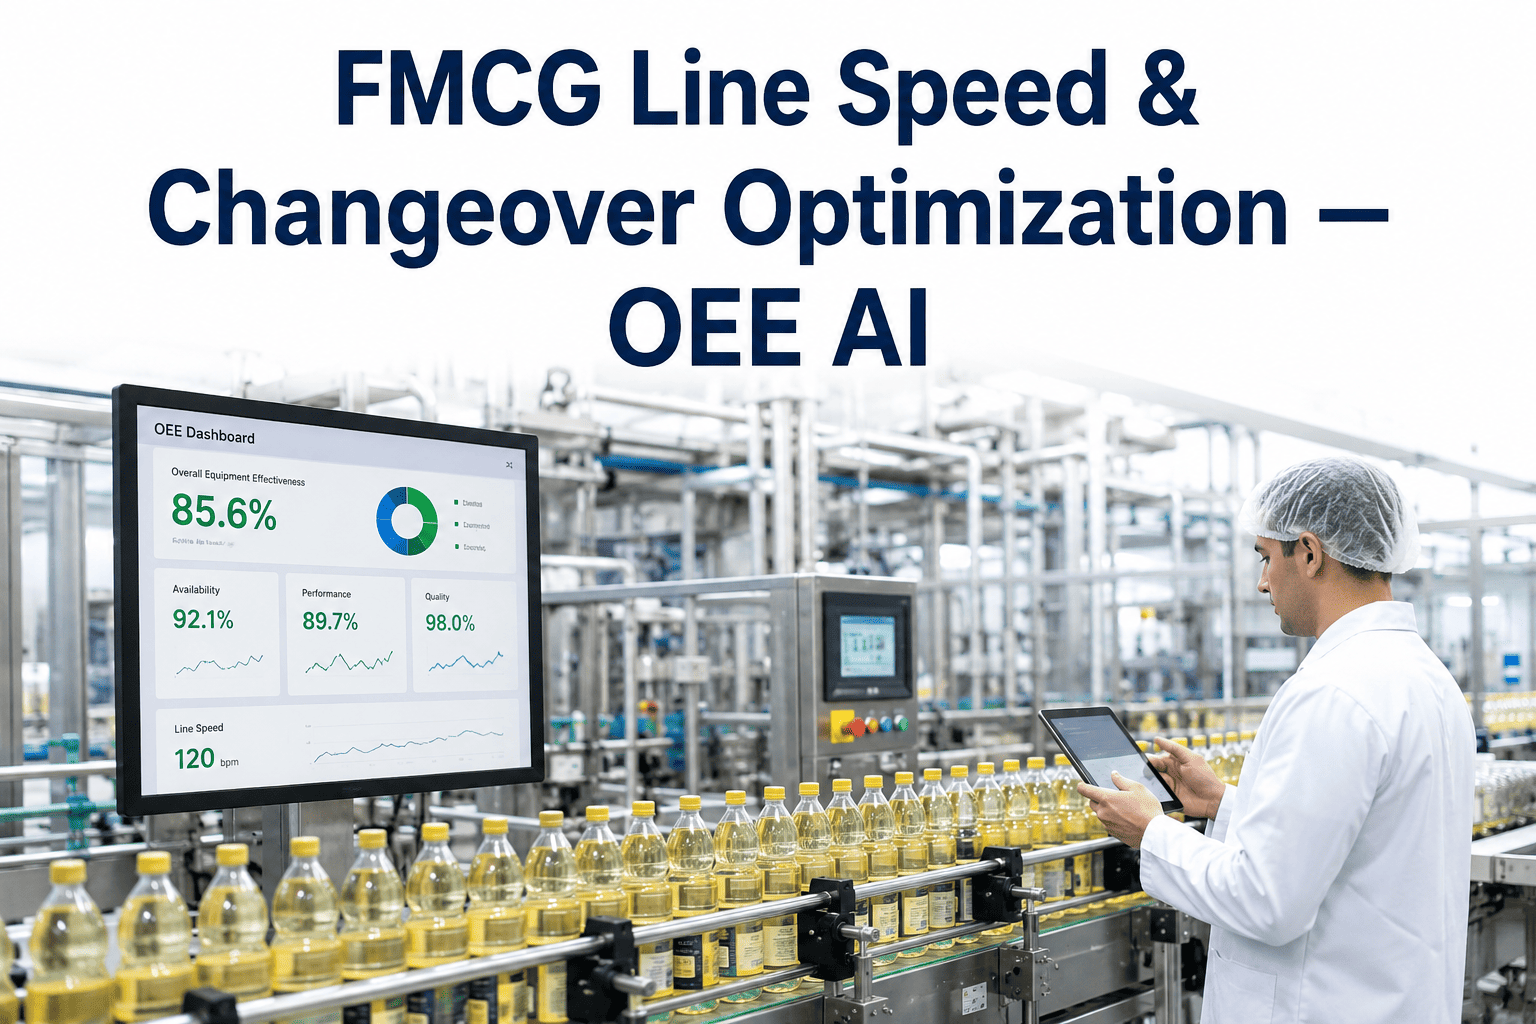
The average FMCG packaging line runs at around 60% OEE, which means roughly 40% of its theoretical output disappears into downtime, speed losses, and quality defects before a single unit ever reaches the warehouse. On a line juggling 50 or more SKUs, changeovers are where most of that hidden capacity quietly vanishes, and the frustrating part is that most plant teams already know how to run a fast changeover, they proved it once during a SMED workshop. What they lack is a system that measures every changeover in real time, shows when performance slips back toward the old baseline, and routes the fix before the gains erode, which is exactly the visibility a production floor needs to hold onto what it already learned.
Turn Your Best Changeover Into Every Changeover
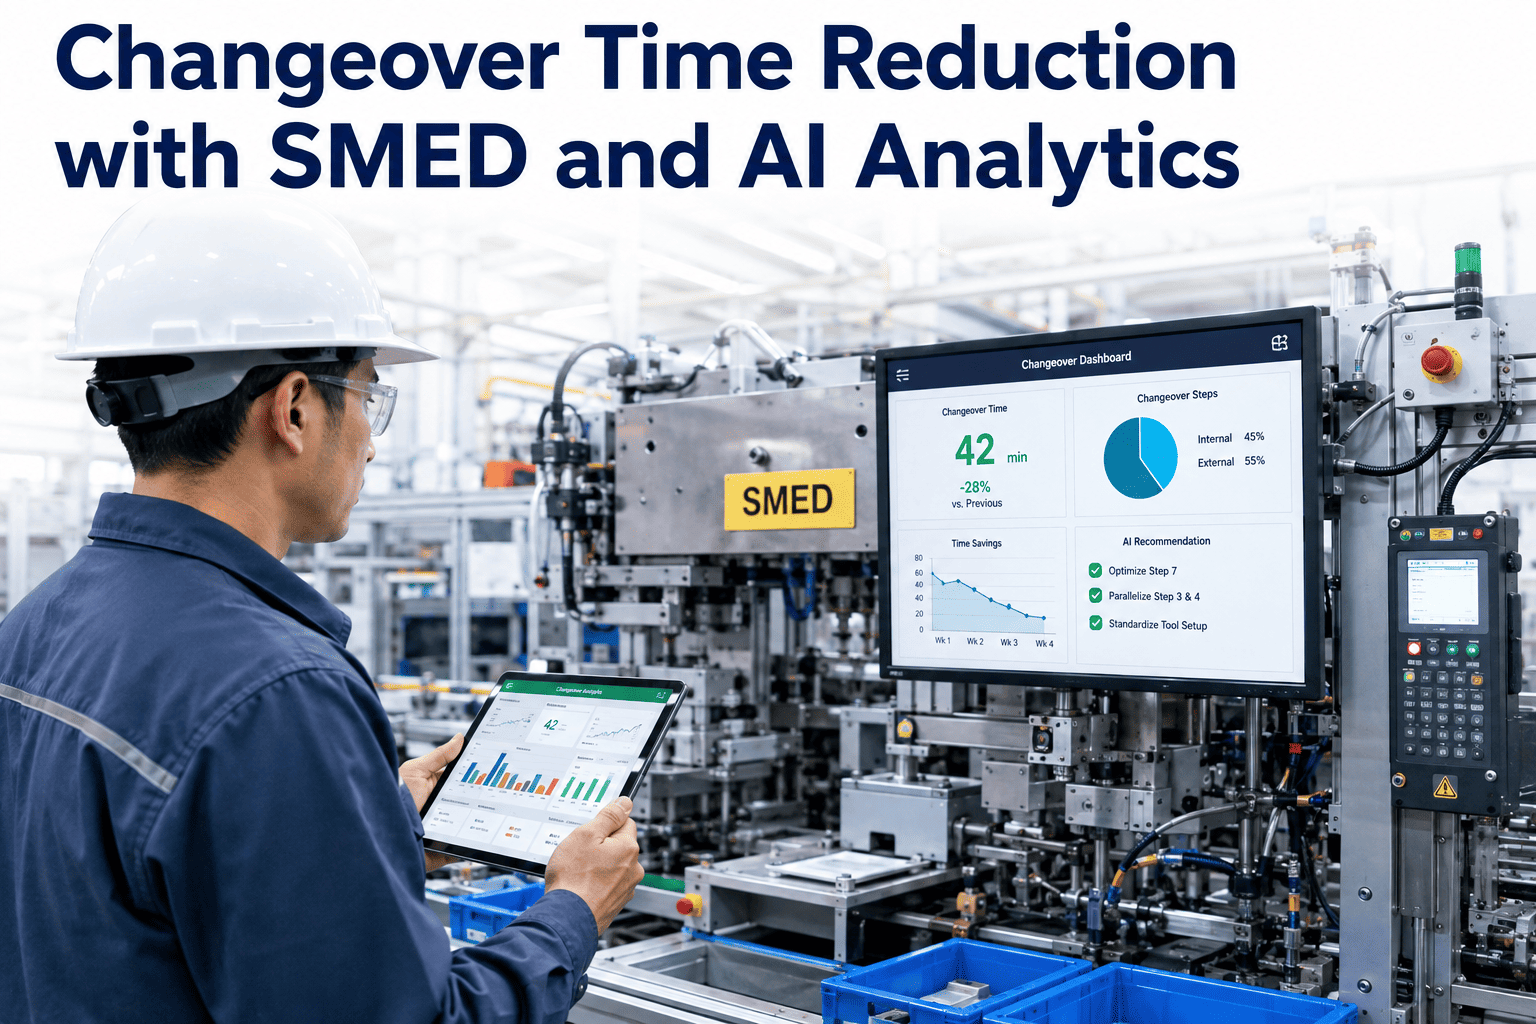
iFactory measures every changeover from last good pack to first good pack, sequences SKUs to minimize total setup time, and routes coaching the moment a shift starts drifting from the optimized standard, cutting changeover time up to 40%.
Where a 40% OEE Line Loses Its Capacity
Changeover and setup losses are consistently the largest single driver of the gap between theoretical and actual line output on high-mix FMCG lines.
From Guesswork to Measured Standard
Every Changeover Timed Automatically
Sensors capture the exact moment from last good pack to first good pack of the new SKU, replacing stopwatch estimates with continuous, accurate data.
SKU Sequencing Optimized
AI applies the full asymmetric changeover time matrix to sequence runs so compatible SKUs group together, cutting total daily setup time significantly.
Drift Flagged in Real Time
When a shift's changeover time slips back toward the pre-SMED baseline, the system flags it immediately instead of letting it surface in a monthly report.
Coaching Routed to the Gap
The specific activity driving the slowdown, whether tooling swaps or first-article inspection, is identified so coaching targets the actual bottleneck.
What Sustained Changeover Discipline Delivers
Average changeover time drop reported after deploying real-time changeover analytics
Reduction in changeover-related OEE losses following sustained monitoring
Typical reduction in average changeover time from AI-optimized SKU sequencing alone
Duration plants maintained improved changeover times with zero regression toward baseline
Bring Your Line's Changeover Data to a Live Review
Share your current SKU count and average changeover time, and our team will map where real-time tracking would recover the most capacity first.
SMED Workshops Alone vs. Sustained Real-Time Tracking
| Capability | One-Time SMED Workshop | iFactory Real-Time Tracking |
|---|---|---|
| Changeover measurement | Manual stopwatch, sample basis | Automatic, every changeover |
| Improvement durability | Reverts within 6-8 weeks typically | Sustained with real-time visibility |
| SKU sequencing | Manual planner judgment | AI-optimized changeover matrix |
| Shift consistency | Varies by training attendance | Enforced through live monitoring |
| Root cause visibility | General workshop observations | Activity-level bottleneck data |
Frequently Asked Questions
We already ran SMED workshops. Why did the improvement not stick?
This is one of the most common patterns across FMCG plants, an optimized procedure works well immediately after training but slowly reverts because no system tracks whether it's actually being followed on every shift. Without real-time visibility, a second or third shift that never attended the training reverts to sequential, unoptimized methods, and the average creeps back toward the original baseline within weeks. Continuous measurement closes that gap by making every changeover visible against the standard, so drift gets caught and corrected before it becomes the new normal rather than showing up in a quarterly review.
How does AI sequencing actually reduce changeover time without new equipment?
AI sequencing works from a full asymmetric changeover time matrix, meaning it knows the actual setup time between every possible pair of SKUs on your line, and orders the day's production run to group compatible SKUs together. On a line running 18 daily changeovers averaging around 55 minutes, this kind of sequence optimization commonly recovers several hours of production capacity per day purely from smarter ordering, with no tooling investment or mechanical changes required. It's a scheduling improvement, not an equipment one, which is why it typically pays back faster than SMED tooling projects.
What exactly counts as a changeover for measurement purposes?
Changeover duration is measured from the last good pack of the outgoing SKU to the first good pack of the incoming SKU, which captures the complete transition rather than just the mechanical setup portion. This includes tooling swaps, parameter adjustments, and first-article inspection time, all of which show up separately in the data so you can see which specific activity is driving variability on a given line. Measuring the full cycle this way is what makes it possible to compare performance fairly across shifts and SKU combinations.
Does this integrate with our existing OEE or scheduling software?
Yes, changeover tracking and sequencing recommendations are designed to sit alongside your existing OEE reporting and production scheduling rather than replace the systems your team already relies on. Schedules built from your line's actual recent OEE performance, rather than theoretical capacity, eliminate the structural overcommitment that causes chronic schedule non-adherence in the first place. For specifics on integrating with your current planning tools, reach out through our support page.
How quickly can we expect to see changeover times improve?
Baseline measurement typically begins showing accurate changeover data within the first two weeks of sensor deployment, giving the team a clear picture of where time is actually going before any changes are made. Sequence optimization can start delivering recovered capacity almost immediately once the changeover matrix is built from that baseline data, while sustained discipline improvements from real-time drift alerts build over the following months as shifts adapt to visible accountability. Facilities that combine both typically see the full result, including the kind of six-month-plus sustained improvement other plants have reported, within one to two quarters. You can map a realistic timeline for your line through this booking link.
Recover the Shift You're Already Losing to Changeovers
Book a demo and see how real-time changeover tracking and AI sequencing would perform against your own SKU mix.