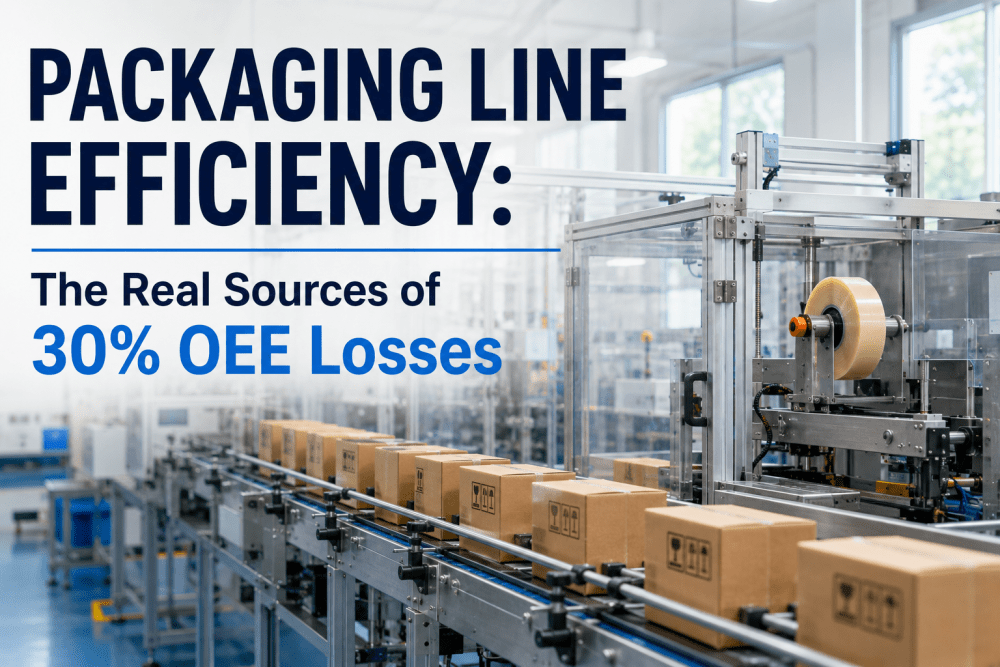
At 2:47 AM on a packaging line in a Midwest CPG plant, the operator watches the 47th consecutive bottle-backup jam on a labeler that should be running at 450 bottles per minute. The line's overall equipment effectiveness (OEE) reads 54% on the whiteboard — but nobody has updated it in six weeks. The shift supervisor knows the real number is closer to 42%, and the plant manager will see a quarterly report in two months that shows "93% theoretical uptime." The gap between what operators see on the floor and what executives see in the boardroom is costing this plant $1.2 million per year in lost throughput. That gap is not a data problem. It's a time problem.
Stop Guessing Your Line's Real OEE — See Every Second of Loss, Every Shift, Every Day
iFactory's Real-Time OEE Dashboards turn your packaging line's PLC, sensor, and vision-system data into live OEE calculations — with root-cause breakdowns that let operators fix today's problem, not last month's average.
What Your OEE Looks Like Today — and What It Becomes Tomorrow
The difference between a packaging line that runs at 55% OEE and one that runs at 78% OEE is not a new machine. It's knowing, in real time, where every minute of loss is going — and having the data to act on it before the shift ends.
Without iFactory
- OEE calculated weekly from clipboard data — 6 days stale by the time you see it
- Lost 23 minutes on a labeler jam — discovered during the next shift's handoff
- Changeover times averaged 47 minutes — nobody knew which SKU transitions caused the worst delays
- Quality losses hidden — 14,000 rejected units per shift attributed to "random" sensor drift
- Plant manager sees 87% OEE on a dashboard updated quarterly; real number is 54%
With iFactory
- OEE calculated every 30 seconds from live PLC data — no manual entry, no delay
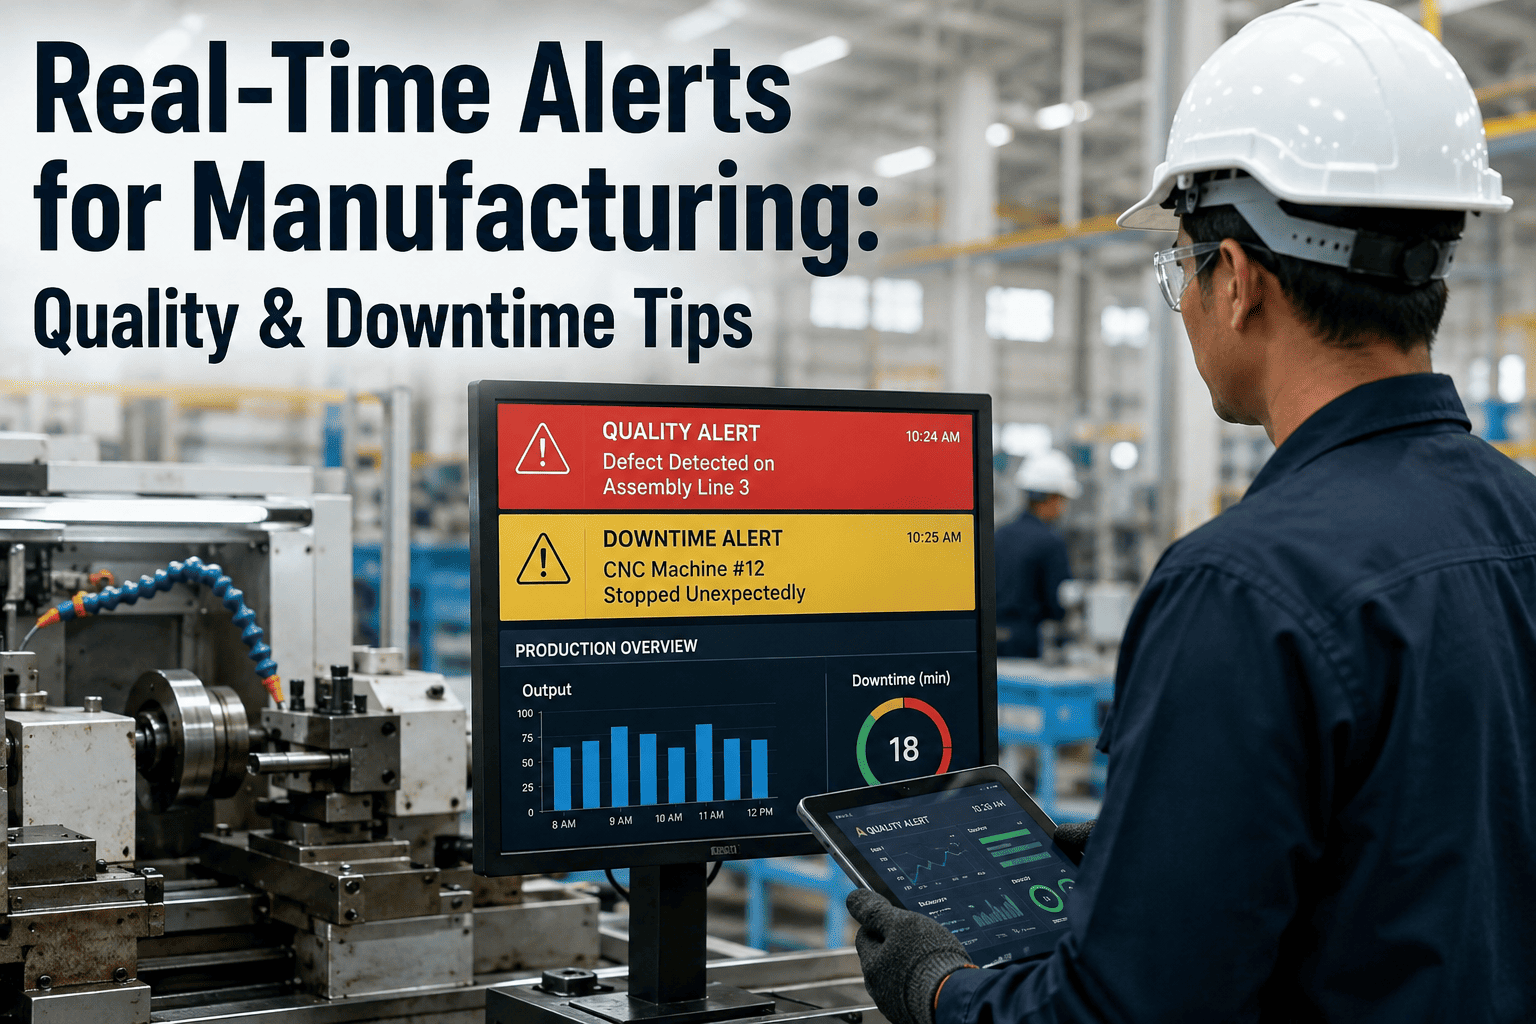
- Labeler jam detected at 2:47:03 AM; alert sent to operator at 2:47:08 AM
- Changeover optimization dashboard shows SKU A→B takes 22 min vs. A→C takes 14 min — sequence adjusted, 19 min saved per shift
- Vision-system drift identified by OEE quality-loss breakdown — recalibration in 12 minutes, not 12 hours
- Plant manager sees 78% OEE in a live dashboard — operations team already acting on the 22% loss gap
Every Minute of OEE Blindness Costs Your Line $47 — and You're Losing 400+ Minutes Per Shift
When OEE data arrives too late to act on, every loss event compounds. A 3-minute sensor drift at 2:00 PM turns into 47 minutes of rejected product by 5:00 PM — because nobody saw the drift pattern. Here's what delayed OEE data is costing your packaging operation right now.
Unplanned Downtime (Availability Loss)
Average 23 minutes per event across 4 events per shift = 92 minutes lost. At $47/min of line value, that's $4,324 per shift — $1.3M per year on a single line.
Slow Cycles & Micro-Stops (Performance Loss)
Labeler runs at 380 bottles/min instead of 450 — 15% performance loss. Over 16 hours/day, that's 67,200 unproduced bottles. At $0.18 margin per unit, $12,096/day.
Defective Output (Quality Loss)
2.3% of output rejected at checkweigher = 1,840 units/shift. Each rejected unit costs $0.42 in material + $0.18 in labor = $1,104/shift. Undetected for 6 hours until QC review.
Changeover Waste (Combined Loss)
47-minute average changeover, 3 per shift = 141 minutes. During changeovers, lines produce 40% reject rate. That's 56 minutes of scrap at $47/min = $2,632 per shift.
Missed Continuous Improvement
Without live OEE breakdowns, improvement teams spend 70% of their time gathering data and 30% fixing problems. Flipped: 30% data gathering, 70% fixing. That 40% productivity gain = $3,800/month per engineer.
From Raw PLC Data to Live OEE Dashboards in Four Steps
No middleware. No cloud dependency. No custom integrations. iFactory connects directly to your packaging line's existing control infrastructure and delivers live OEE breakdowns within weeks — not quarters.
Connect — Zero Disruption
iFactory's on-premise appliance taps into your existing PLCs, vision systems, checkweighers, and MES via OPC-UA, Modbus, or direct API — no production downtime, no network changes.
Ingest — Every Signal, Every Millisecond
The appliance ingests 10,000+ data points per second from every line asset — cycle counts, reject rates, sensor states, conveyor speeds, changeover timestamps — and computes OEE components in real time.
Compute — OEE With Root-Cause Breakdown
iFactory automatically attributes every minute of loss to availability, performance, or quality — then drills down to the specific equipment, SKU, shift, and operator context that caused it.
Visualize — Live Dashboards, Any Device
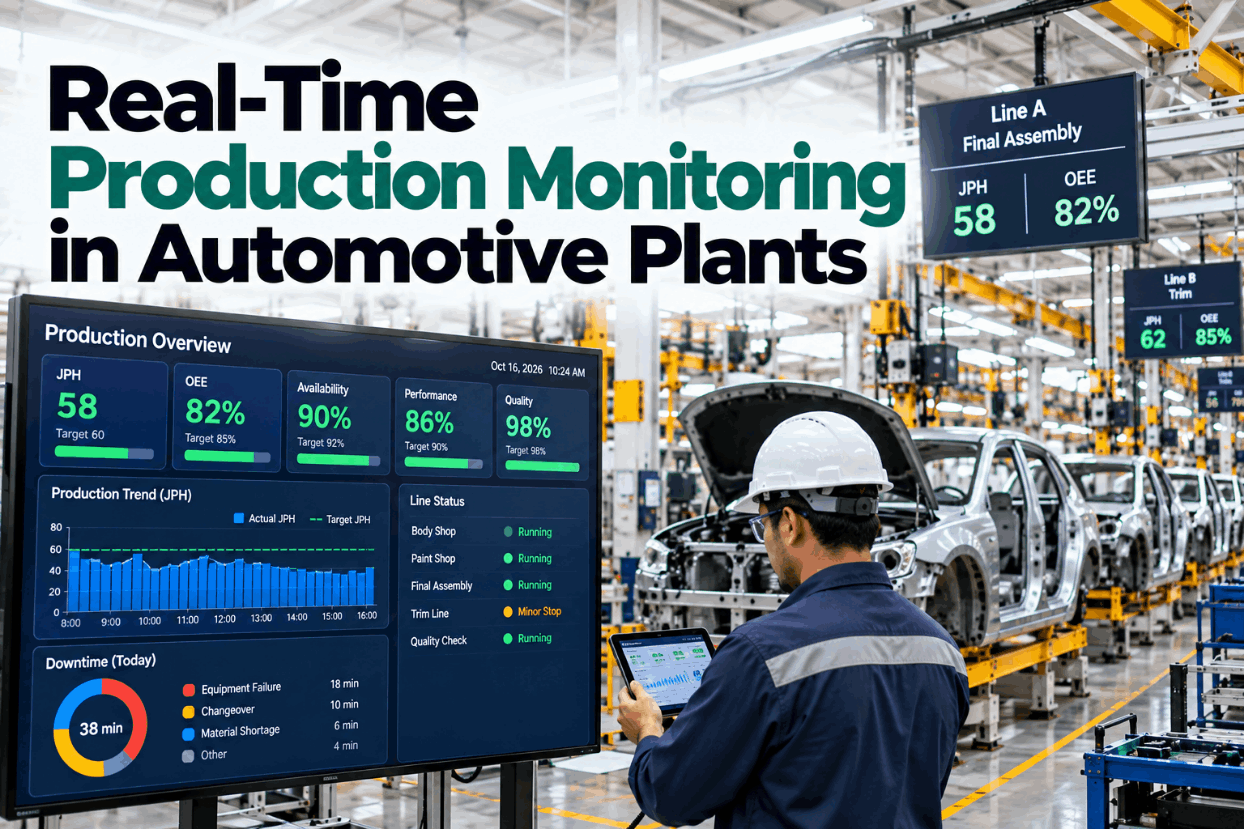
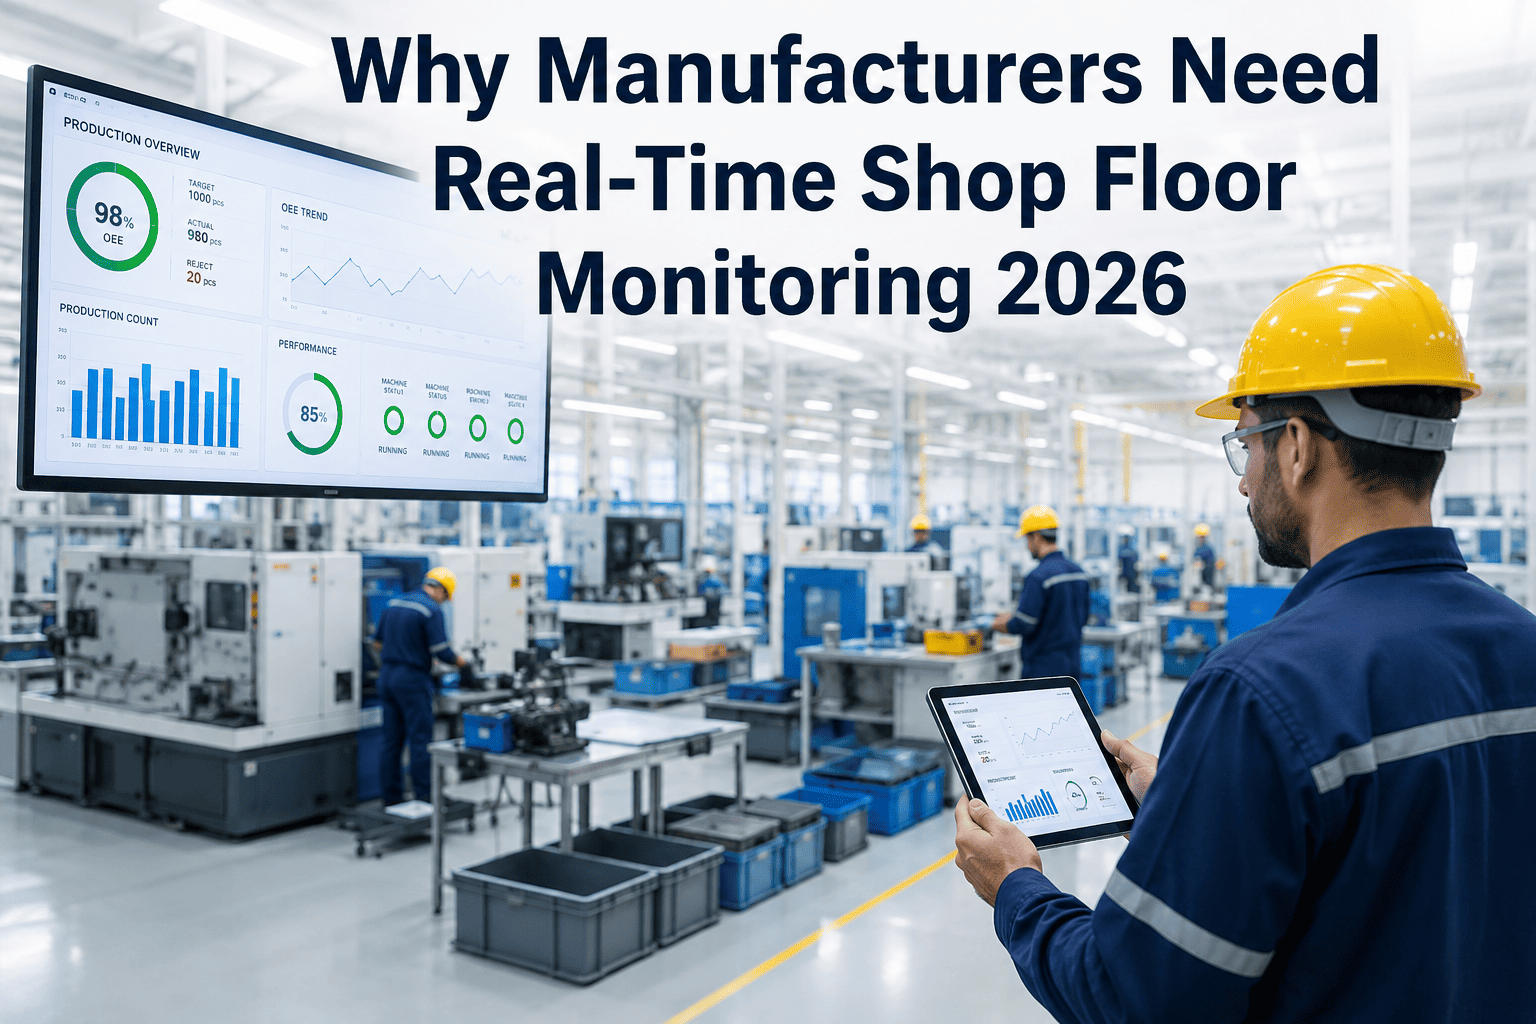
Operators see OEE on a wall-mounted screen in real time. Supervisors get shift-level breakdowns on a tablet. Plant managers see rolling 7-day trends — all from the same data pipeline, all updated every 30 seconds.
Four Dashboards That Turn OEE Data Into Daily Action
Real-time OEE is not a single number. It's a system of views — each designed for a specific role and a specific decision window. iFactory delivers all four out of the box.
Operator HUD — Live OEE at a Glance
Wall-mounted dashboard showing current OEE, target vs. actual, and the top three loss categories right now. Operators see a red bar when availability drops below 90% — and the specific machine causing it. Updated every 30 seconds. No interpretation needed.
Shift Summary — Post-Shift Debrief in 60 Seconds
At shift end, iFactory generates a one-page summary: OEE by hour, loss breakdown by category, top 3 loss events with duration and root cause. The outgoing shift hands over a PDF — not a verbal "it was fine."
Changeover Analyzer — SKU Transition Intelligence
Every changeover is automatically logged with duration, SKU pair, operator team, and quality fallout during ramp-up. The analyzer identifies the worst-performing transitions and recommends sequence optimization — proven to cut changeover time by 34%.
Trend & Benchmark — Week-Over-Week Improvement Tracking
Rolling 7-, 30-, and 90-day OEE trends with automatic baseline calculation. Compare lines, shifts, SKUs, and operator teams. When a line drops below its 30-day baseline, iFactory sends an alert — before the loss compounds.
Your packaging line is already generating the data you need to know your real OEE — iFactory just makes it visible, actionable, and trustworthy. Book a 30-min walkthrough and we'll show you your line's live OEE in under two weeks.
Real-Time OEE Dashboards — Delivered Turnkey, Running On-Premise, Live in 6–12 Weeks
iFactory is not a SaaS tool that requires you to ship your plant data to a cloud. It's an on-premise appliance that connects to your existing network, ingests data from every source, and delivers live OEE dashboards without any data leaving your facility. Here's exactly what's included.
End-to-End Deployment — From Data Source to Live Dashboard
We handle everything: appliance installation, network configuration, PLC integration, dashboard design, and operator training. Your team provides data-source access; we deliver a working pilot in 6–12 weeks.
On-Premise, Zero Cloud Dependency — Your Data Never Leaves Your Plant
iFactory runs on an NVIDIA appliance inside your plant network. All data ingestion, computation, and visualization happens locally. No cloud subscription, no data egress fees, no security audit for external data transfer.
Pilot to ROI in One Quarter — 6–12 Weeks to Live Dashboards
Most OEE projects take 6–12 months to deliver a usable dashboard. iFactory's turnkey approach delivers live, actionable OEE data within a single quarter — and customers see 12–18% OEE improvement in the first 90 days.
24×7 Managed Service — We Monitor the Monitor
iFactory's operations team monitors your appliance, data connections, and dashboard health 24/7. If a data feed drops, we know before you do — and we fix it remotely. Your team never touches the infrastructure.
Zero-Code Configuration — No Custom Development Required
All OEE calculations, loss attribution rules, and dashboard layouts are configured through iFactory's point-and-click interface. No SQL queries. No Python scripts. No custom dashboard development.
Multi-Line, Multi-Plant Scalability — One Appliance per Plant
Each on-premise appliance supports up to 50 packaging lines. Add lines by connecting new PLCs — no additional hardware. Deploy across plants with a standardized dashboard template and centralized configuration management.
What Packaging & CPG Operations Leaders Ask About Real-Time OEE
Four questions we hear every week from plant managers and VP-level operations leaders evaluating real-time OEE for their packaging lines.
Your Packaging Line's Real OEE Is Waiting — Stop Guessing, Start Seeing
iFactory's Real-Time OEE Dashboards turn your existing PLC data into live, actionable OEE breakdowns — without cloud dependency, without custom development, and without waiting 6 months. Connect your first line in 6–12 weeks and see 12–18% OEE improvement in the first quarter.