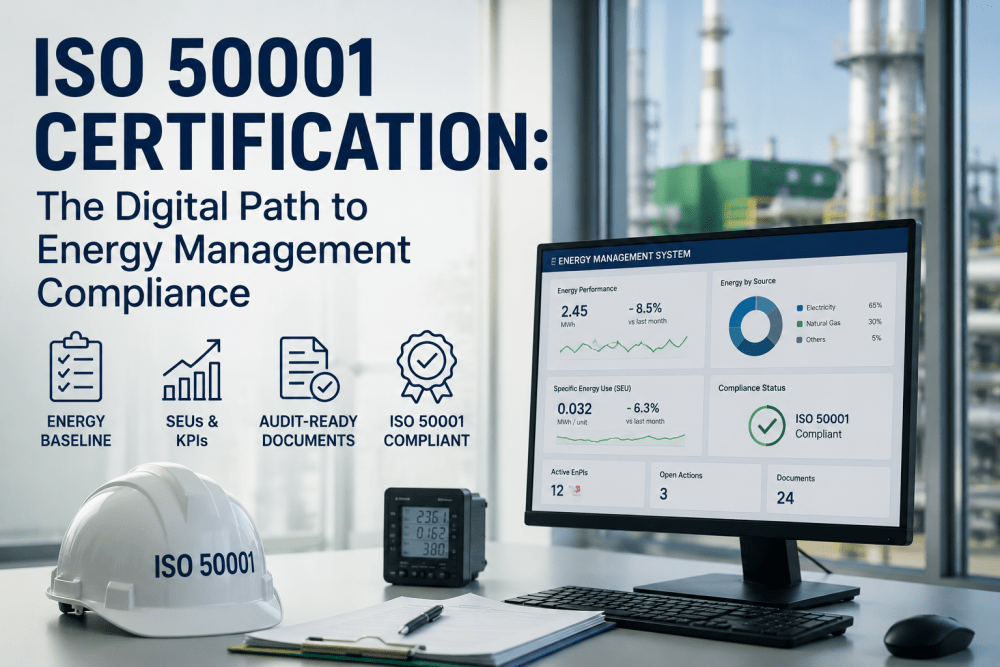
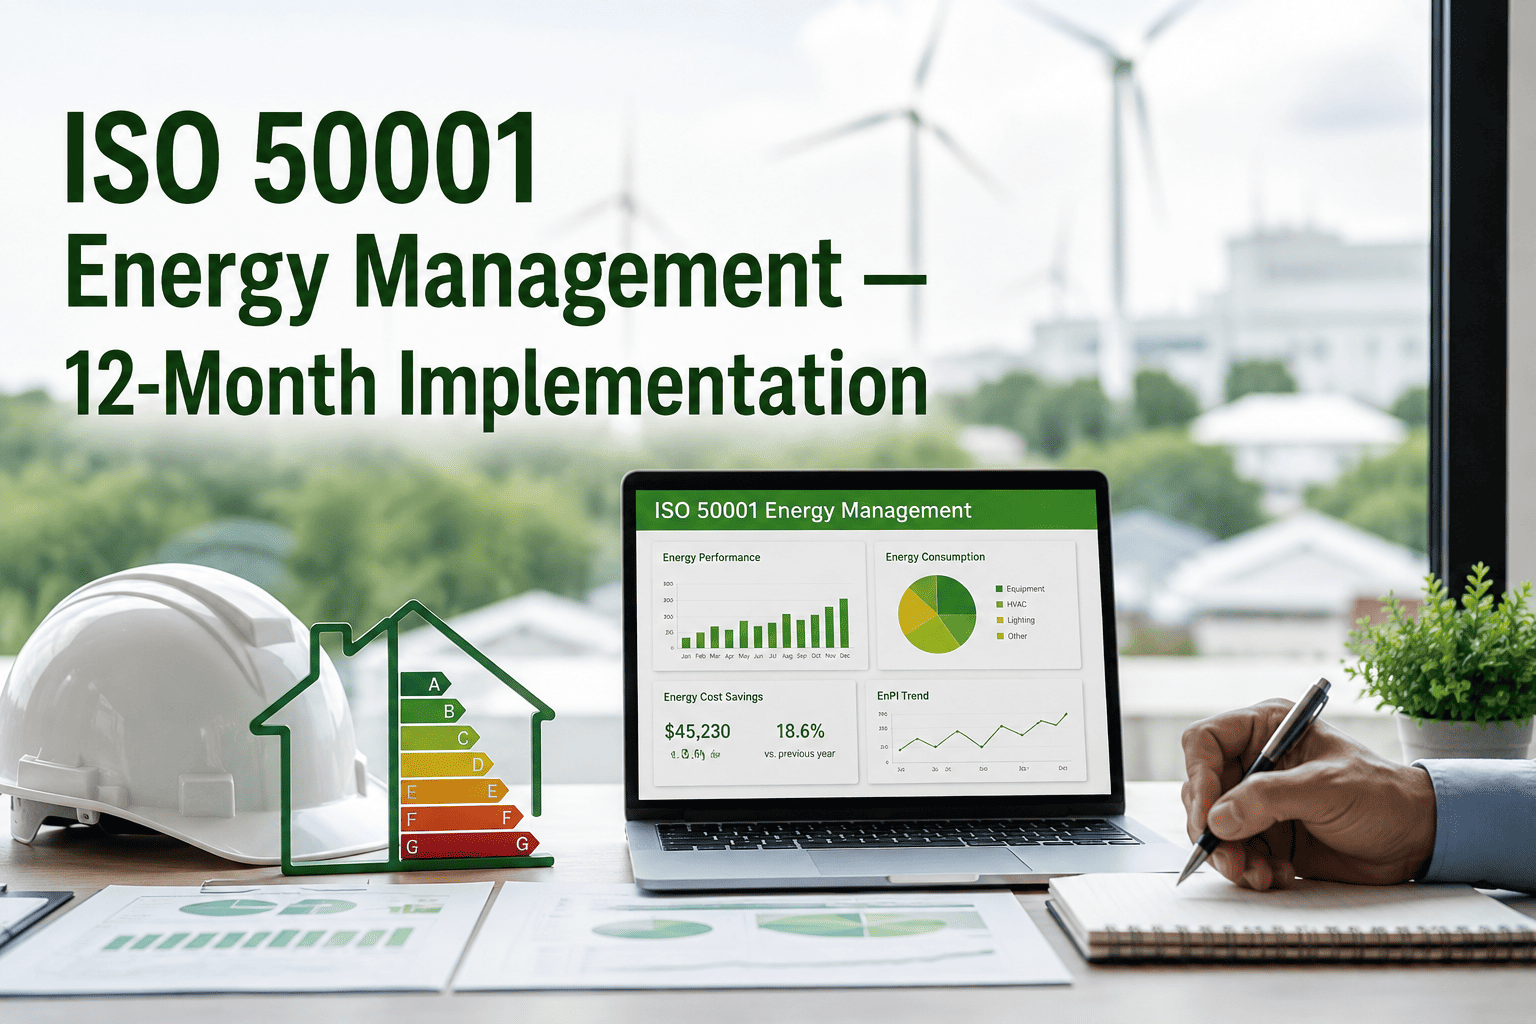
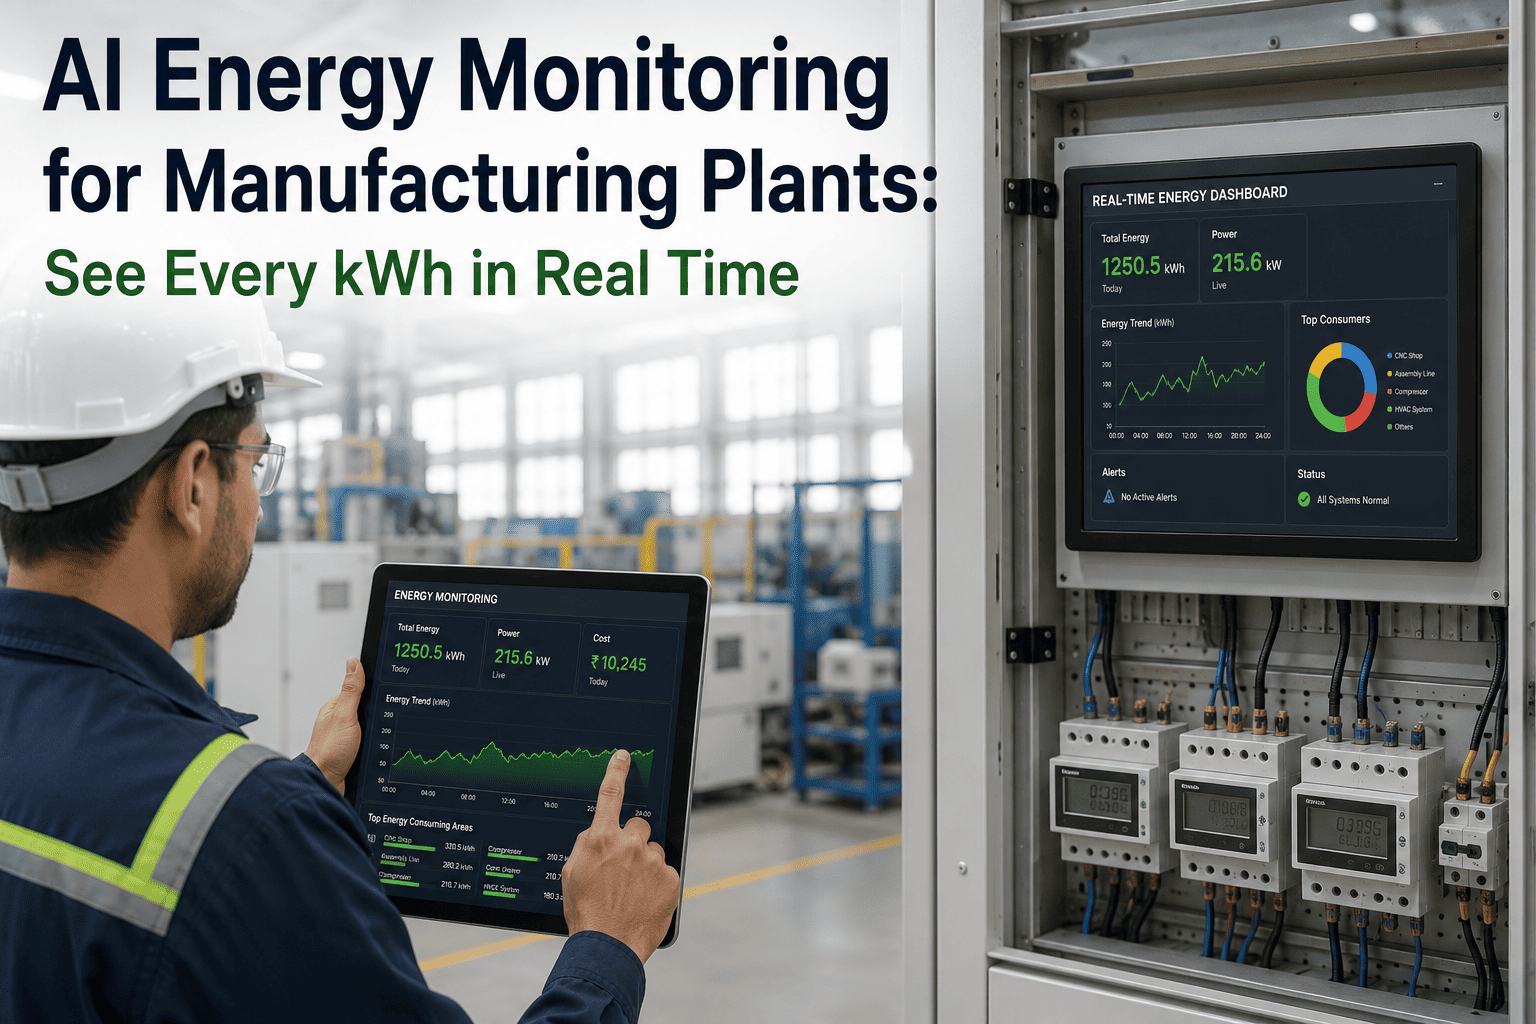
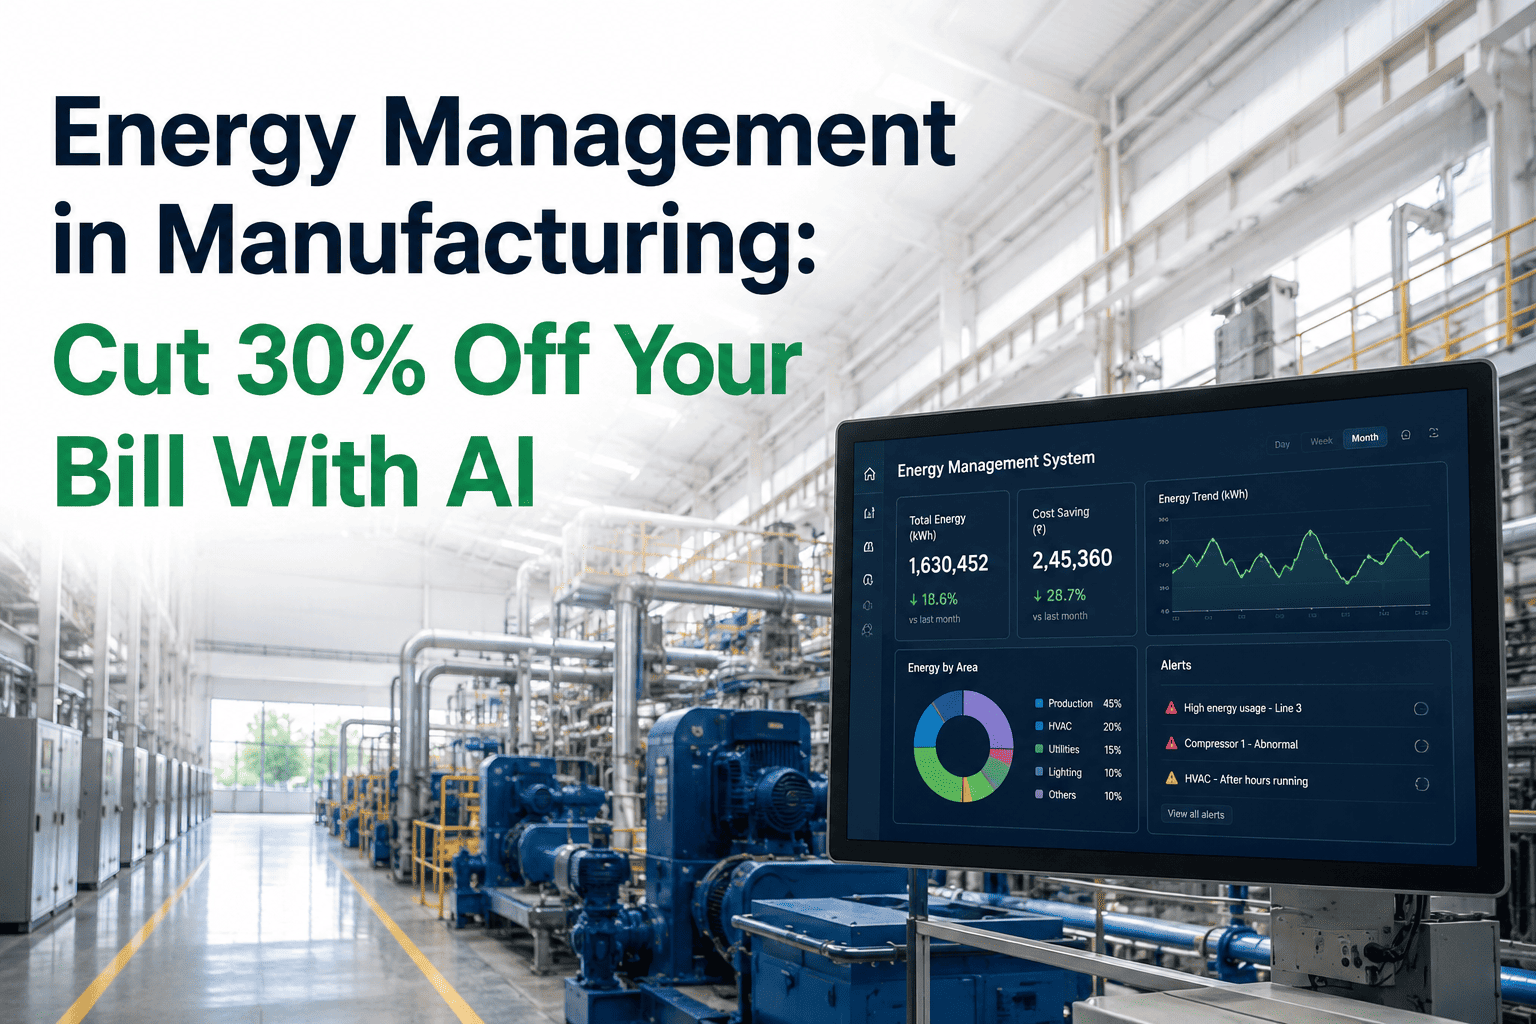
Achieving ISO 50001 certification has traditionally been a paper-heavy, spreadsheet-driven exercise — energy managers compiling 18 months of utility bills into baselines, plant engineers manually tagging significant energy uses (SEUs) across hundreds of motors and process equipment, and quality teams scrambling to assemble audit evidence packages the week before the certification body arrives. The certification itself is valuable: ISO 50001 is the globally recognized standard for energy management systems (EnMS), and certified organizations typically see 10% to 30% reductions in energy intensity within three years of implementation. But the cost of getting there — and staying there through annual surveillance audits — has historically been the implementation overhead, not the energy improvements themselves. iFactory AI's digital energy management platform changes that economics by automating the four most labor-intensive components of ISO 50001 compliance: the energy baseline calculation, the significant energy use (SEU) identification and tracking, the energy performance indicator (EnPI) monitoring dashboards, and the audit-ready evidence archive. U.S. manufacturers deploying iFactory's energy monitoring solution report 68% reduction in ISO 50001 implementation time, 84% reduction in surveillance audit preparation hours, and full digital traceability across every clause requirement — converting what was historically a 14-month certification project with three full-time equivalents into a 5-month deployment with continuous compliance maintenance built into the platform. Book a Demo to see how iFactory automates ISO 50001 evidence collection against your facility's current energy management gaps.
ISO 50001 · Digital EnMS · SEU Tracking · Audit-Ready Reporting
Achieve ISO 50001 Certification Through Automated Energy Monitoring — Digital Baselines, SEU Tracking, EnPI Dashboards, and Continuous Audit Evidence.
iFactory AI's energy management platform automates the four most labor-intensive components of ISO 50001 compliance — energy baseline calculation, significant energy use identification, EnPI dashboards, and audit-ready evidence archives — converting a 14-month certification project into a 5-month deployment with continuous compliance built in.
68%
Reduction in ISO 50001 implementation time versus manual spreadsheet baseline
84%
Reduction in annual surveillance audit preparation hours with digital evidence archive
10–30%
Energy intensity reduction within three years of certified EnMS deployment
100%
Digital traceability across every ISO 50001 clause requirement and audit checkpoint
Why ISO 50001 Certification Has Been So Hard to Achieve — and What Digital Energy Management Changes
ISO 50001 is not a complicated standard in concept. It asks an organization to establish an energy policy, identify where energy is consumed, set objectives for improvement, measure performance against those objectives, and continuously improve. The conceptual framework is the same Plan-Do-Check-Act cycle that underpins ISO 9001 and ISO 14001. What makes ISO 50001 difficult in practice is not the framework — it is the data infrastructure required to demonstrate compliance. Every clause requires evidence: the energy review (Clause 6.3) needs documented identification of significant energy uses; the energy performance indicators (Clause 6.4) need traceable calculation methodologies; the monitoring and measurement requirement (Clause 9.1) needs auditable records of energy consumption against baselines; the internal audit (Clause 9.2) needs a documented evidence trail.
In a manufacturing environment with hundreds of motors, compressors, furnaces, HVAC systems, and process equipment, manually compiling this evidence is the project. Excel-based baselines drift out of date the moment production volume changes. SEU lists become stale as equipment is added or modified. EnPI dashboards built in BI tools require manual data refreshes that fall behind during busy quarters. Surveillance audits then become a three-week scramble to reconstruct the evidence that should have been continuously maintained. iFactory's digital energy management platform inverts this dynamic by capturing energy data continuously from utility meters, sub-meters, and equipment-level sensors — feeding a live EnMS database that automatically maintains baselines, recalculates EnPIs, flags SEU performance deviations, and assembles audit evidence packages on demand. Book a Demo to see iFactory's ISO 50001 evidence engine running against your current utility data.
Manual Spreadsheet-Based EnMS
Excel baselines, BI dashboards, paper audit binders
Energy baseline calculated once and rarely refreshed when production volume shifts
Significant energy use list maintained manually — falls out of sync with the asset register
EnPI dashboards require monthly manual data refreshes from utility bills and meter readings
Audit evidence scrambled together in the three weeks before the certification body arrives
No traceable link between energy actions, results, and ISO clause requirements
14-month implementation timeline with 3 FTE dedicated to data wrangling
Result: Certification achieved but compliance maintenance dominates the energy team
iFactory Digital Energy Management
Live data, auto baselines, continuous EnPI, audit on demand
Energy baseline auto-recalculated using regression analysis against production drivers
SEU register linked to the asset hierarchy — updates automatically with equipment changes
EnPI dashboards refresh in real time from PLC, meter, and utility integrations
Audit evidence packages generated on demand with traceability to every ISO clause
Energy actions, baselines, and EnPIs linked in a single digital thread for full traceability
5-month deployment with continuous compliance maintenance built into the platform
Result: Certification maintained continuously with energy team focused on improvement
The Four Digital Capabilities That Automate ISO 50001 Compliance
ISO 50001 has 31 distinct clause requirements across the seven main sections of the standard. Most of those requirements share the same underlying data infrastructure problem: the need to capture energy consumption continuously, link it to operational drivers, calculate performance against a baseline, and preserve the evidence trail. iFactory's energy monitoring platform addresses these requirements through four interlocking capabilities that together cover every data-heavy clause in the standard. The capabilities below are not features added incrementally — they are designed as a single EnMS data model that produces ISO 50001 evidence as a byproduct of operating the platform.
Cap 1
Automated Energy Baseline With Regression-Based Normalization
ISO 50001 Clause 6.5 requires an energy baseline that reflects current operating conditions and is updated when significant changes occur. iFactory automatically calculates the baseline using regression analysis against the operational drivers that influence energy consumption — production tonnage, heating degree days, operating hours, product mix. When production volume increases 18% in a quarter, the baseline recalculates to reflect normalized energy intensity rather than absolute consumption. The certification body sees a defensible, traceable, mathematically rigorous baseline rather than a spreadsheet that has not been updated since the last audit.
Covers: Clause 6.5 baseline · Clause 6.4 EnPI methodology · Clause 4.4 EnMS scope normalization
Cap 2
Significant Energy Use (SEU) Identification and Continuous Tracking
ISO 50001 Clause 6.3 requires identification of SEUs — typically the assets or processes responsible for the largest share of facility energy consumption. iFactory ingests sub-meter and equipment-level data to automatically rank energy consumers by share of total facility consumption, flagging assets that meet the SEU threshold defined by the energy team. The SEU register is linked to the asset hierarchy in the CMMS — when a new compressor is commissioned or a furnace is decommissioned, the SEU list updates automatically. Each SEU carries its own performance indicators, baseline, and improvement actions, all visible in a single asset view.
Covers: Clause 6.3 SEU identification · Clause 6.6 action plans · Clause 9.1 monitoring
Cap 3
Energy Performance Indicator (EnPI) Dashboards With Live Refresh
ISO 50001 Clause 6.4 requires EnPIs that measure energy performance against objectives and baselines. iFactory's EnPI dashboards refresh continuously from connected meters, PLCs, and utility data feeds — showing energy intensity per ton produced, kWh per operating hour, energy cost per unit, and SEU-level efficiency in real time. Dashboards are configurable per stakeholder: plant managers see facility-level intensity, process owners see line-level efficiency, and corporate sustainability leads see normalized portfolio metrics. The auditor sees the same EnPIs with full drill-down to the underlying meter data and calculation methodology.
Covers: Clause 6.4 EnPIs · Clause 9.1 monitoring · Clause 9.3 management review
Cap 4
Audit-Ready Evidence Archive With Clause-Level Traceability
ISO 50001 Clause 7.5 requires documented information that demonstrates the operation of the EnMS. iFactory maintains a continuous evidence archive — every meter reading, baseline calculation, EnPI value, energy action, training record, internal audit finding, and management review output is timestamped, attributable, and tagged to the specific ISO clause it supports. When the certification body requests evidence of Clause 9.2 internal audit execution or Clause 10.2 nonconformity correction, the energy team generates the evidence package in minutes rather than reconstructing it across email, file shares, and paper binders. Surveillance audit preparation drops from three weeks of scramble to two days of review.
Covers: Clause 7.5 documented information · Clause 9.2 internal audit · Clause 10.2 nonconformity
Cap 5
Management Review Inputs and ESG Reporting Integration
ISO 50001 Clause 9.3 requires periodic management review with specific inputs — EnPI trends, action plan progress, audit findings, and improvement opportunities. iFactory generates the management review package automatically from the live EnMS data, formatted to the clause-required inputs. The same data structure feeds corporate ESG reporting frameworks (GRI 302, CDP Climate, SASB) and Scope 1 and Scope 2 emissions calculations — eliminating the parallel data preparation that historically separated ISO 50001 compliance from sustainability reporting. Energy compliance and ESG disclosure run from a single source of truth.
Covers: Clause 9.3 management review · ESG reporting · Scope 1 and 2 emissions calculation
ISO 50001 Clause-by-Clause Mapping to iFactory Energy Monitoring Capabilities
The table below maps each major ISO 50001 clause to the iFactory capability that automates the evidence collection and the typical manual effort that capability eliminates. This mapping is the working document most certification consultants request first when scoping a digital EnMS deployment — it shows exactly which clauses are covered by platform automation versus which still require manual policy and procedure work. Book a Demo to walk through this mapping against your facility's current compliance posture.
| ISO 50001 Clause |
Requirement Summary |
iFactory Capability |
Manual Effort Eliminated |
Audit Evidence |
| 4.4 EnMS |
Establish documented EnMS |
Configured EnMS data model |
System architecture documentation |
Platform configuration record |
| 6.3 Energy Review |
Identify SEUs and energy uses |
Auto-ranked SEU register |
Manual sub-meter survey |
SEU report with consumption share |
| 6.4 EnPIs |
Define and monitor EnPIs |
Live EnPI dashboards |
Monthly BI dashboard refresh |
Continuous EnPI trend records |
| 6.5 Baseline |
Establish and update baseline |
Regression-based auto-baseline |
Annual Excel baseline rebuild |
Baseline calculation audit trail |
| 6.6 Action Plans |
Document energy action plans |
Linked action register |
Action tracker maintenance |
Action-to-result traceability |
| 7.5 Documented Info |
Maintain documented information |
Continuous evidence archive |
Paper binder assembly |
Clause-tagged evidence packages |
| 9.1 Monitoring |
Monitor key characteristics |
Live meter and PLC integration |
Manual meter reading rounds |
Continuous monitoring logs |
| 9.2 Internal Audit |
Conduct internal audits |
Audit module with findings tracking |
Audit report assembly |
Auditor-ready findings register |
| 9.3 Mgmt Review |
Conduct management review |
Auto-generated review pack |
Quarterly slide preparation |
Management review record |
| 10.2 Nonconformity |
Address nonconformities |
NC and CAPA workflow |
Nonconformity tracking |
Full CAPA closure evidence |
Turn ISO 50001 From a 14-Month Project Into a 5-Month Deployment With Continuous Compliance.
iFactory's digital energy management platform automates the four most labor-intensive components of ISO 50001 — baselines, SEUs, EnPIs, and audit evidence — so your energy team focuses on actual energy improvement rather than spreadsheet maintenance and binder assembly.
The Six-Phase Digital Path to ISO 50001 Certification
Most U.S. manufacturers pursuing ISO 50001 certification follow a recognizable path — from initial gap assessment through certification audit and into ongoing surveillance. The phases below describe how that path compresses when a digital energy management platform replaces the manual data wrangling that historically defines each phase. The timeline assumptions reflect typical deployments at multi-line manufacturing facilities in the 50,000 to 500,000 square foot range.
Phase 1
Gap Assessment and EnMS Scope Definition — Weeks 1 to 3
Map the facility energy footprint against ISO 50001 clause requirements. iFactory's gap assessment module ingests utility data, existing sub-meter records, and the asset register to produce a clause-by-clause readiness scorecard. The scope of the EnMS is defined — typically the manufacturing facility excluding office HVAC unless office consumption is material. Outputs: signed scope statement, gap remediation plan, executive sponsor approval.
Phase 2
Meter Integration and Data Foundation — Weeks 3 to 8
Connect main utility meters, sub-meters, and equipment-level energy sensors to the iFactory platform. PLC tag mapping for process equipment, utility data feed configuration for electricity, gas, water, and compressed air. The data foundation that powers every subsequent ISO 50001 evidence requirement is established in this phase — and once it is in place, the manual effort for the remaining phases collapses dramatically.
Phase 3
Baseline Establishment and SEU Identification — Weeks 8 to 12
Regression-based baseline computed against production tonnage, operating hours, weather, and product mix. SEU identification runs automatically against the meter data, ranking energy consumers and applying the SEU threshold defined by the energy team. The auditor sees a defensible mathematical baseline rather than a spreadsheet snapshot. EnPI methodology documented and approved.
Phase 4
Action Plan Execution and EnPI Monitoring — Weeks 12 to 18
Energy improvement actions identified during gap assessment are executed and tracked in the iFactory action register. EnPI dashboards monitor performance against baselines in real time, with deviation alerts when SEU efficiency drops or facility intensity drifts upward. Energy team focus shifts from data wrangling to actual improvement — the work that justified the certification project in the first place.
Phase 5
Internal Audit and Management Review — Weeks 18 to 20
Internal audit conducted using the iFactory audit module — findings logged, corrective actions assigned, and closure tracked digitally. Management review pack auto-generated from live EnMS data, formatted to Clause 9.3 input requirements. Internal audit report and management review minutes filed in the evidence archive with full clause traceability.
Phase 6
Certification Audit and Continuous Surveillance — Week 20 Onward
Certification body conducts Stage 1 documentation review and Stage 2 implementation audit. Evidence packages generated on demand from the iFactory archive — the auditor sees clause-tagged records rather than reconstructed binders. Post-certification, annual surveillance audit preparation drops to two days of review rather than three weeks of evidence reconstruction. Continuous compliance becomes the operating mode.
Expert Review: What ISO 50001 Lead Auditors Say About Digital EnMS Platforms
"I have led ISO 50001 certification audits at U.S. manufacturers for the past 11 years, and the difference between facilities using digital energy management platforms and facilities running their EnMS out of Excel and SharePoint is the most visible operational gap I encounter in this work. The audit experience itself is fundamentally different. At a paper-based facility, Stage 2 audit week is consumed by evidence reconstruction — the energy manager runs back to their desk between every clause review to assemble records from email threads, shared drives, and binders that were last touched the day before the audit started. Nonconformities frequently get raised not because the underlying EnMS is weak but because the evidence trail cannot be reconstructed within the audit timeframe. At a digitally-managed facility, every clause review concludes in minutes — the auditor asks for evidence of Clause 6.5 baseline updates, and the energy manager pulls up the live regression baseline with timestamped recalculations and approved updates. The auditor asks for Clause 9.1 monitoring records, and the platform shows continuous meter data with no gaps. The auditor asks for Clause 7.5 documented information governance, and the system produces version history with attribution for every controlled document. The certification decision becomes about the substantive quality of the EnMS rather than the administrative capacity to assemble paperwork. This matters because ISO 50001 is supposed to drive energy improvement, not paperwork production — and when 70% of the energy team's time is spent on evidence assembly rather than energy work, the standard is not serving its purpose. Digital EnMS platforms restore the balance the standard intended."
ISO 50001 Lead Auditor and Energy Management Consultant
Accredited Certification Body Auditor — 11 Years — Certified Energy Manager (CEM) — Conducted 140+ ISO 50001 Audits Across U.S. Manufacturing
Conclusion: Digital Energy Management Makes ISO 50001 Operationally Sustainable
The hardest part of ISO 50001 has never been the conceptual framework — it has been the operational discipline required to maintain the evidence trail year after year through surveillance audits, management changes, production shifts, and equipment turnover. Facilities that achieve initial certification through a heroic 14-month project frequently lose the discipline within two surveillance cycles when the energy team's bandwidth is consumed by other priorities and the spreadsheet-based EnMS drifts out of date. The result is a certification that exists on paper but no longer reflects how the organization actually manages energy.
Digital energy management platforms break this cycle by making compliance a byproduct of operating the platform rather than a separate project the energy team has to maintain. iFactory AI's energy monitoring solution automates the baseline calculation, the SEU tracking, the EnPI dashboards, and the evidence archive — converting the four most labor-intensive ISO 50001 components into background operations that run continuously. The 68% implementation time reduction and 84% audit preparation reduction documented at comparable deployments are not the result of cutting corners on the standard. They are the result of eliminating the manual data wrangling that historically defined ISO 50001 work and freeing the energy team to focus on the energy improvements that justified the certification in the first place. Book a Demo to see iFactory's ISO 50001 evidence engine running against your facility's current energy data.
Make ISO 50001 Compliance Continuous Instead of a Pre-Audit Scramble.
iFactory's energy management platform produces audit-ready evidence as a byproduct of operating the EnMS — clause-tagged, timestamped, mathematically defensible, and available on demand for every surveillance audit, recertification, and corporate sustainability disclosure.
Frequently Asked Questions
How long does a typical ISO 50001 certification take with iFactory's digital energy management platform?
Most U.S. manufacturing facilities reach certification audit in 18 to 22 weeks from project kickoff using iFactory's energy monitoring platform — versus 50 to 60 weeks typical for spreadsheet-based implementations. The compression comes from automating baseline calculation, SEU identification, EnPI monitoring, and evidence archive assembly rather than building each from scratch in Excel.
Does iFactory's energy monitoring platform integrate with existing utility meters, sub-meters, and PLC systems?
Yes. iFactory integrates with the main utility meter data feeds (electric, gas, water, steam, compressed air), revenue-grade and check sub-meters via Modbus, BACnet, and OPC UA, and equipment-level PLC tags for production-driven energy consumption. SAP, Maximo, and other CMMS integrations connect the SEU register to the asset hierarchy.
Can the platform support ISO 50001 alongside other standards like ISO 14001, ISO 9001, and corporate ESG reporting?
Yes. The underlying EnMS data model supports integrated management systems — the same evidence archive serves ISO 50001 energy clauses, ISO 14001 environmental aspects, and ISO 9001 documented information requirements. ESG reporting frameworks (GRI 302, CDP Climate, SASB) and Scope 1 and Scope 2 emissions calculations run from the same data source.
What happens to ISO 50001 compliance maintenance after the initial certification audit?
Continuous compliance is the operating mode. Baselines auto-recalculate as production volume shifts, SEU rankings update as equipment changes, EnPI dashboards refresh in real time, and the evidence archive accumulates clause-tagged records continuously. Annual surveillance audit preparation drops from three weeks of evidence reconstruction to two days of review.
What investment and timeline should a U.S. manufacturer plan for an iFactory ISO 50001 deployment?
Typical deployments range from $85,000 to $240,000 depending on facility size, meter and sub-meter integration scope, and ISO 50001 readiness at project start. Timeline runs 18 to 22 weeks from kickoff to certification audit readiness. ROI from energy intensity reductions (10% to 30% over three years) typically exceeds platform investment within the first 12 to 18 months.