In January 2025, a 1.2 GW combined-cycle power plant in Texas under-forecasted demand by 4.7% during an unexpected cold snap. The plant scrambled to bring peaking units online — paying spot market prices 8x higher than its day-ahead contract rate. That single 36-hour forecasting miss cost the operator $2.3 million. Six months later, after deploying AI-driven load forecasting that fused real-time weather data, historical load patterns, and grid-level signals, the same plant reduced its mean absolute percentage error (MAPE) from 4.1% to 1.8%. Industry research estimates that every 1% improvement in MAPE for a utility with 1 GW peak load saves approximately $1.4 million annually across long-term, short-term, and price forecasting combined. The math is simple: better forecasts mean fewer surprises, lower balancing costs, and higher margins on every megawatt-hour dispatched.
Load Forecasting
Every Megawatt You Over-Generate Is Money Burned.
Every Megawatt You Under-Generate Is a Crisis.
U.S. power demand is projected to hit 4,239 billion kWh in 2026 — a record driven by data centers, electrification, and industrial reshoring. Meanwhile, renewable intermittency and grid complexity are making traditional forecasting methods dangerously obsolete. AI-driven load forecasting doesn't just predict demand — it gives power plants the intelligence to act on it.
4,239 TWh
Projected U.S. power demand in 2026
24%
Projected U.S. load growth by 2035
$1.4M/yr
Savings per 1% MAPE improvement (1 GW utility)
$720B
Grid upgrades needed through 2030
Sources: EIA 2025 · RMI State of Utility Planning Q3 2025 · Wikipedia Energy Forecasting · Goldman Sachs 2025
The Forecasting Gap: Why Traditional Methods Are Failing
Power generation and distribution must be kept in perfect balance with demand — continuously. If supply exceeds demand, generators waste fuel and revenue. If demand exceeds supply, operators face spot market penalties, rolling blackouts, or equipment damage. Traditional forecasting — built on historical averages, simple regression models, and weather lookups — was designed for a grid that no longer exists.
What's Changed in the Grid
Renewable Intermittency
Solar and wind output swings by 50–80% within hours. Renewables now represent 27% of U.S. generation (2026) — making "baseload thinking" obsolete.
Data Center Shock Loads
AI-driven data centers add hundreds of MW in concentrated, non-seasonal demand. ERCOT reports uncertainty ranges of 101 to 1,536 MW from large loads alone.
Electrification Waves
EVs, heat pumps, and industrial electrification are adding new demand patterns that don't follow historical curves. Load shapes are fundamentally changing.
DER Complexity
Rooftop solar, battery storage, micro-grids, and demand response programs create "behind-the-meter" generation that makes net load increasingly unpredictable.
Extreme Weather
Climate volatility is producing demand spikes outside historical ranges. Utilities now report that climate variability is a top forecasting challenge.
What AI Forecasting Delivers
1–2% MAPE
Deep learning models achieve 1–2% error on short-term forecasts vs. 3–5% for statistical methods — a difference worth millions annually.
5-min updates
AI refreshes predictions every 5 minutes using live weather, grid signals, and real-time meter data — not once-daily batch runs.
Probabilistic
Instead of single-point forecasts, AI generates probability distributions — showing the likely range of demand with confidence intervals for risk management.
Multi-horizon
One platform covers 5-minute-ahead (dispatch), day-ahead (scheduling), week-ahead (maintenance), and year-ahead (capacity planning) — all from unified models.
Self-learning
Models retrain continuously on new data — adapting to new load patterns, seasonal shifts, and grid topology changes without manual recalibration.
Still forecasting load with yesterday's regression models? See what AI-driven forecasting looks like on your plant's actual data.
Four Time Horizons: How AI Forecasting Covers Every Decision
Load forecasting isn't one task — it's four different problems at four different time scales, each driving different operational decisions. AI excels because a single platform can serve all four horizons simultaneously, with models optimized for each time scale's unique data requirements and accuracy targets.
Minutes to Hours
Very Short-Term Forecasting
Decisions Enabled
Real-time dispatch, automatic generation control (AGC), frequency regulation, spinning reserve activation, and intra-hour balancing.
AI Advantage
LSTM and GRU networks process sub-minute sensor streams, weather nowcasts, and grid frequency data to predict load 5–60 minutes ahead with sub-2% error — enabling automatic dispatch adjustments that manual forecasting cannot match.
Hours to Days
Short-Term Forecasting
Decisions Enabled
Day-ahead unit commitment, fuel procurement scheduling, maintenance window planning, and energy market bidding strategy.
AI Advantage
Hybrid CNN-LSTM models with attention mechanisms correlate weather forecasts, calendar effects, and economic signals to produce hourly load curves for the next 1–7 days — the time horizon where forecasting accuracy has the highest financial impact.
Weeks to Months
Medium-Term Forecasting
Decisions Enabled
Fuel contract negotiations, seasonal maintenance scheduling, reserve margin planning, and renewable integration strategy.
AI Advantage
Ensemble models combine weather seasonality, industrial production indices, and grid expansion data to forecast weekly/monthly load profiles — enabling optimal fuel hedging and take-or-pay contract management.
Years to Decades
Long-Term Forecasting
Decisions Enabled
Capacity expansion planning, transmission line investment, generation mix strategy, and regulatory compliance planning.
AI Advantage
Scenario-based AI models incorporate GDP growth, demographic shifts, EV adoption curves, data center pipeline data, and policy changes to produce probabilistic 10–20 year demand forecasts with quantified uncertainty ranges.
One Platform. Four Time Horizons. Every Decision Covered.
iFactory's AI load forecasting platform delivers very-short-term dispatch optimization through long-term capacity planning from a single unified system — connecting to your existing SCADA, EMS, and market systems without rip-and-replace.
The Cost of Getting It Wrong: What Forecasting Errors Actually Cost
Forecasting errors aren't abstract statistics — they're direct financial losses that compound on every shift, every market bid, and every dispatch decision. Here's what each type of error costs a typical 500 MW–1 GW power plant or utility.
Over-Forecasting
You generated more than needed
$15–40/MWh
Balancing market penalties for dumping excess generation
$50K–200K/yr
Wasted fuel from ramping units that weren't needed
Accelerated wear
Unnecessary thermal cycling reduces equipment lifespan
Under-Forecasting
Demand exceeded your generation
$90–500/MWh
Spot market prices during peak — up to 8–10x day-ahead rates
$500K–2M
Cost of a single major under-forecast event during extreme weather
Blackout risk
Reliability violations, regulatory penalties, and reputational damage
AI-Optimized Forecasting
Accurate predictions across all horizons
$1.4M/yr saved
Per 1% MAPE improvement for a 1 GW utility
30–50% fewer
Balancing market transactions from tighter forecasts
Optimal dispatch
Right unit, right time, right fuel — every shift
The AI Forecasting Engine: What's Under the Hood
AI load forecasting isn't a single algorithm — it's a layered system that ingests diverse data streams, processes them through specialized models, and delivers actionable forecasts at every time horizon.
Weather Data
AI weather prediction models (AIWP) now rival traditional NWP for accuracy. Temperature, humidity, wind speed, solar irradiance, and cloud cover feed directly into load models — updated every 15 minutes.
Historical Load
Years of hourly/sub-hourly load data capture seasonal patterns, day-of-week effects, holiday impacts, and long-term trends. The foundation for every ML model's training dataset.
Grid Signals
Real-time frequency, voltage, and interconnection flow data from SCADA/EMS systems. Captures grid-level dynamics that affect local load behavior and renewable curtailment patterns.
Exogenous Variables
Economic indicators, industrial production indices, EV charging patterns, DER generation, and event calendars. The contextual signals that explain why load deviates from pure weather-driven patterns.
LSTM / GRU Networks
Capture long-range temporal dependencies in load time series — learning patterns across hours, days, and seasons that statistical models miss entirely.
CNN + Attention
Convolutional layers extract local patterns; attention mechanisms focus on the most relevant time steps. Hybrid CNN-BiLSTM models achieve state-of-the-art accuracy on short-term forecasting.
Ensemble Methods
Multiple model architectures are combined — blending LSTM, gradient boosting, and physics-informed models. Ensemble forecasts consistently outperform any single model across diverse conditions.
Probabilistic Output
Instead of single-point predictions, models output probability distributions — P10/P50/P90 forecasts that quantify uncertainty and enable risk-weighted dispatch decisions.
Why iFactory for Power Plant Load Forecasting
01
Built for Power Generation, Not Generic IoT
iFactory's models understand power plant operations — heat rate curves, ramp rate constraints, minimum run times, fuel switching economics, and emissions limits. Forecasts feed directly into dispatch optimization, not just dashboards.
02
Unified Forecasting + Maintenance + Energy Analytics
When load forecasting predicts a peak demand window, the maintenance scheduler ensures critical assets are available. When predictive maintenance flags a turbine issue, the forecasting model adjusts available capacity. One platform, zero silos.
03
Edge + Cloud Hybrid Architecture
Very-short-term forecasting runs on edge servers at the plant for sub-second dispatch decisions. Long-term models run in the cloud for portfolio-level planning. Both share a unified data layer — no duplicate infrastructure, no data gaps.
04
Multi-Plant Fleet Optimization
Operating thermal, hydro, and renewable assets across multiple sites? iFactory generates coordinated forecasts across your entire fleet — optimizing which plant dispatches which megawatt at which price, across all time horizons simultaneously.
Every Hour You Forecast Wrong Is an Hour You Pay For
iFactory transforms your power plant from reactive dispatch to predictive intelligence — connecting weather data, grid signals, and plant operations into one AI-driven forecasting platform that reduces MAPE, cuts balancing costs, and optimizes every megawatt-hour you generate.
Frequently Asked Questions
How accurate is AI load forecasting compared to traditional methods?
AI-driven forecasting typically achieves 1–2% MAPE on short-term (day-ahead) forecasts, compared to 3–5% for traditional statistical methods like ARIMA or simple regression. Research shows LSTM models outperform SVMs with 13.5% lower prediction error. For a 1 GW utility, every 1% MAPE improvement translates to approximately $1.4 million in annual savings across combined long-term, short-term, and price forecasting benefits.
What data does the AI need to generate accurate forecasts?
At minimum: 2–3 years of historical hourly load data and weather station data (temperature, humidity, wind speed). For best performance, add real-time SCADA/EMS data, sub-hourly meter readings, solar irradiance data, economic indicators, calendar variables (holidays, events), and DER generation data. iFactory connects via standard protocols — OPC-UA, ICCP, DNP3, and direct API integration with weather providers and market operators.
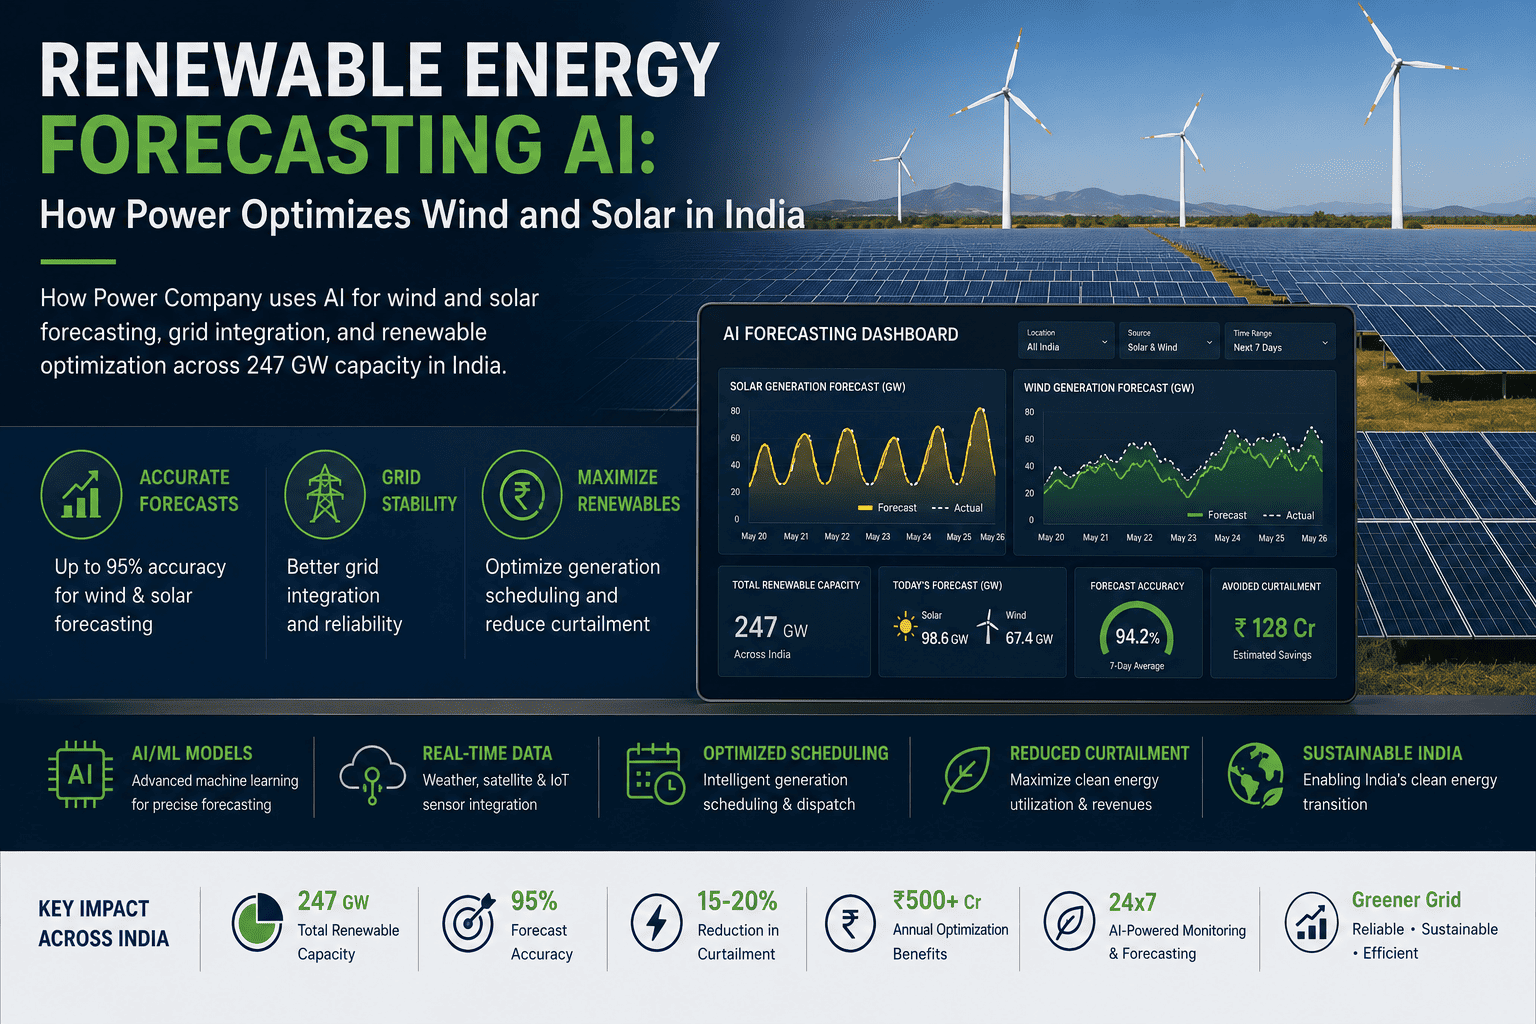
How does AI handle renewable energy intermittency in forecasting?
AI models forecast net load — total demand minus renewable generation — by combining demand forecasting with renewable output prediction. Solar irradiance models and wind speed forecasts feed into generation prediction models, while demand models handle the consumption side. The combined net load forecast tells dispatchers exactly how much conventional generation is needed at each hour, accounting for renewable variability automatically.
Can AI forecasting integrate with our existing EMS and market systems?
Yes. iFactory delivers forecasts via standard industry protocols and APIs — feeding directly into your existing energy management system (EMS), SCADA, market bidding platforms, and dispatch optimization tools. Forecasts are available as hourly load curves, 5-minute interval data, or probabilistic distributions depending on the downstream application. No rip-and-replace of existing control systems required.
How quickly can we deploy AI load forecasting?
Historical data integration and initial model training typically takes 30–45 days. First operational forecasts — day-ahead and week-ahead — are live within 60 days. Full multi-horizon forecasting with probabilistic output and market integration reaches production maturity within 90 days. Models improve continuously as they accumulate more plant-specific data, with measurable accuracy gains visible month-over-month.