Industrial pressure sensors are the silent backbone of modern process control — translating physical force into electrical signals that drive decisions in refineries, chemical plants, pharmaceutical facilities, and food processing lines. When a pressure transmitter drifts by 0.5%, it doesn't just produce a bad reading: it triggers incorrect valve positions, misreported batch data, and in high-stakes environments, unsafe operating conditions. For U.S. manufacturing professionals managing IIoT-connected facilities, understanding how pressure sensors work, how they fail, and how to keep them accurate is not optional maintenance knowledge — it is core operational intelligence. Book a Demo to see how iFactory's IoT Sensor Integration platform centralizes pressure monitoring, calibration tracking, and drift alerts across your entire facility.
Pressure Sensors in Industrial Processes: Accuracy, Calibration & Drift
iFactory's IoT Sensor Integration platform gives industrial manufacturers real-time pressure monitoring, automated calibration scheduling, and drift compensation alerts — purpose-built for process-critical environments.
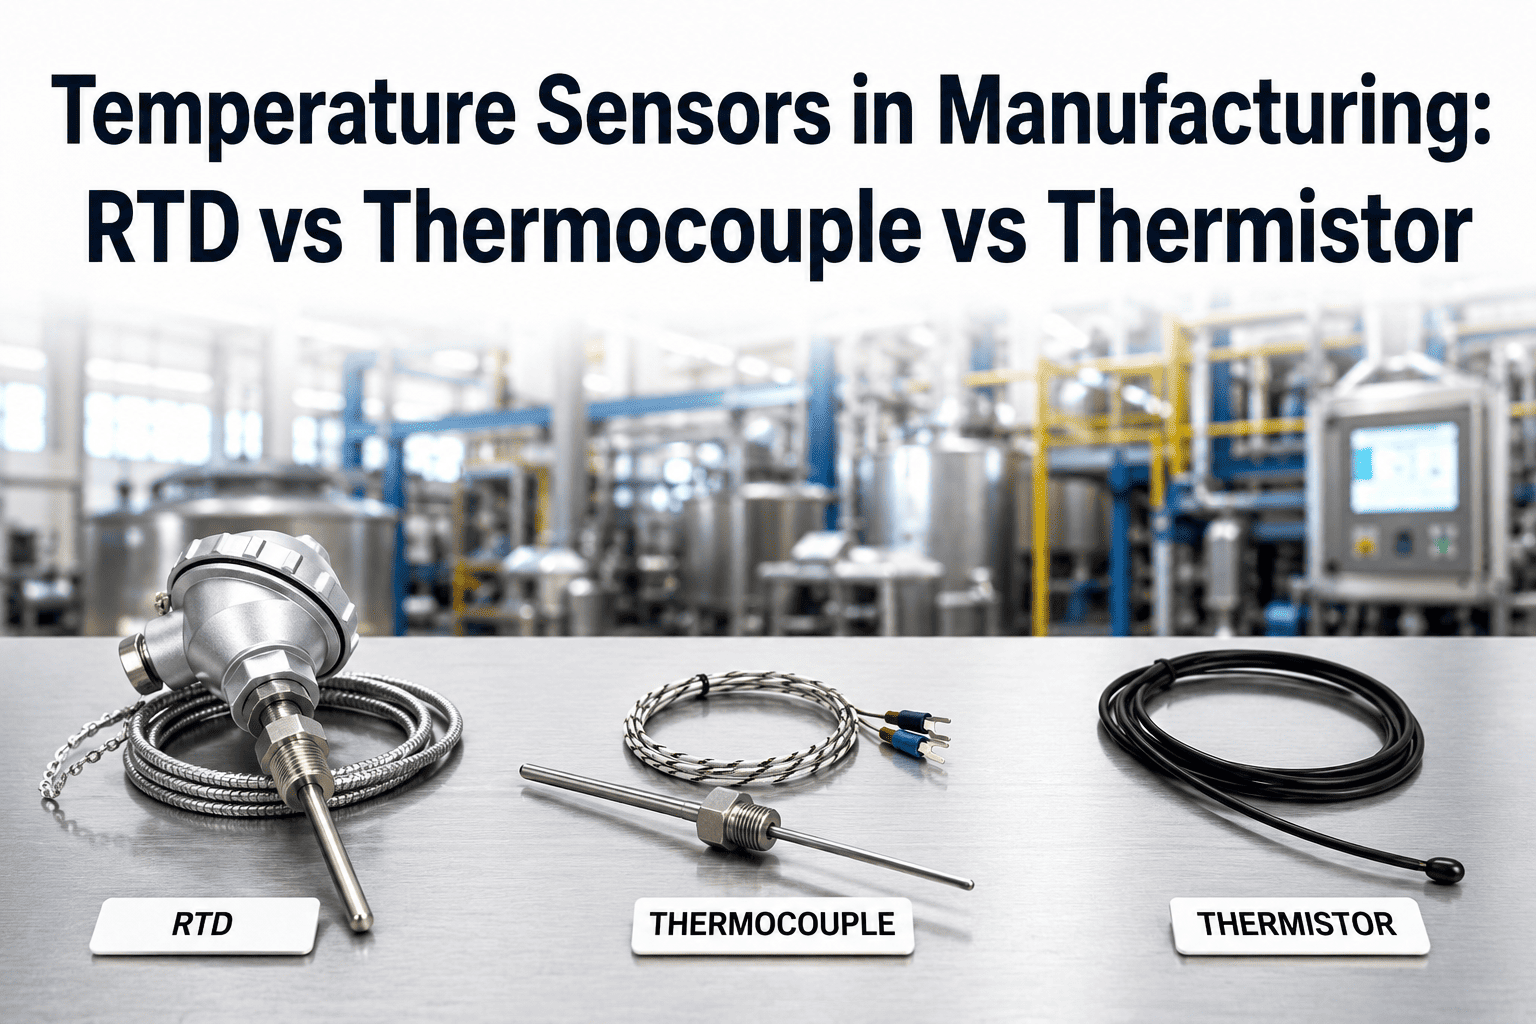
Industrial Pressure Sensor Technologies: How Each Type Works and Where It Fails
Not all pressure sensors are built on the same physics. The three dominant technologies deployed in U.S. industrial process environments each have distinct accuracy profiles, failure modes, and application ranges that directly determine whether your pressure monitoring infrastructure will hold calibration under real operating conditions.
Piezoresistive Sensors
The most widely deployed technology in industrial process control. A silicon diaphragm with diffused resistors changes resistance under mechanical stress. Accuracy ranges from 0.1% to 0.25% full scale. Primary failure mode is temperature-induced zero drift — uncompensated units can drift 0.02–0.05% per °C above baseline.
Capacitive Pressure Sensors
Measures the change in capacitance between a deflecting diaphragm and a fixed plate. Achieves accuracy of 0.04–0.1% full scale — the highest precision class in industrial pressure measurement. Extremely low drift over time makes capacitive sensors the preferred choice for custody transfer and regulatory measurement points.
Strain Gauge Sensors
A metallic foil grid bonded to a sensing element deforms under pressure, changing electrical resistance in a Wheatstone bridge configuration. Accuracy typically 0.3–1.0% full scale. Highly durable in high-pressure and high-temperature environments where silicon-based sensors fail. Common in hydraulic press, boiler, and compressor monitoring applications.
Pressure Sensor Calibration: Methods, Standards, and Interval Optimization
Calibration is not a single event — it is a continuous process discipline that determines whether your pressure measurement infrastructure produces data you can act on or data that quietly misleads your control systems. The method you choose determines both the accuracy achievable and the labor cost of maintaining it across a large sensor population.
Dead Weight Tester Calibration
The primary reference standard for pressure calibration. Precisely machined weights apply known force per unit area to generate traceable reference pressures. Achieves uncertainty of 0.005% or better. Used for calibrating secondary standards and high-accuracy custody transfer transmitters. Labor-intensive and bench-only — not suitable for in-line or field calibration in process plants.
Pneumatic & Hydraulic Pressure Comparator
Field-portable calibrators that compare the unit under test against a reference sensor traceable to NIST standards. Accuracy typically 0.025–0.1% full scale depending on calibrator grade. The standard method for in-plant calibration programs in U.S. manufacturing facilities — balances accuracy against field portability. Most facilities target 4:1 or better test uncertainty ratio between calibrator and sensor being tested.
Automated Multipoint Calibration
Software-driven calibration routines that apply pressure at multiple points across the sensor range — typically 0%, 25%, 50%, 75%, and 100% full scale, in ascending and descending sweeps — to characterize linearity, hysteresis, and repeatability simultaneously. Required for smart transmitters with HART or FOUNDATION Fieldbus interfaces. Generates calibration records automatically for CMMS integration and audit trail compliance under ISO 9001 or FDA 21 CFR Part 11 frameworks. See how iFactory automates calibration record management — book a demo with our instrumentation engineers.
Risk-Based Calibration Interval Optimization
Rather than applying fixed 12-month intervals to all sensors equally, leading facilities now use statistical analysis of historical calibration records to adjust intervals based on each sensor's observed drift rate and application criticality. Sensors demonstrating low drift in stable environments may be safely extended to 24-month intervals, while sensors in high-vibration or corrosive service may require 3-month cycles. Risk-based programs consistently reduce total calibration labor by 25–35% while improving overall measurement system accuracy by concentrating resources on sensors that actually drift.
Pressure Sensor Drift: Root Causes, Detection, and Compensation Strategies
Sensor drift is the single largest source of measurement error in mature industrial facilities — and the most insidious, because it accumulates invisibly between calibration events. Understanding what drives drift at the physics level is the prerequisite for choosing compensation strategies that actually work.
Primary Drift Mechanisms in Industrial Pressure Sensors
| Drift Type | Typical Magnitude | Detection Method | Compensation Strategy |
|---|---|---|---|
| Thermal zero drift | 0.02–0.05% FS/°C | Temperature-correlated output trend | Onboard temperature compensation circuit |
| Span drift (electronic aging) | 0.1–0.3% FS/year | Two-point calibration check | Digital trim via HART interface |
| Mechanical zero shift | 0.05–0.2% FS (post overload) | Zero-pressure output check | Sensor replacement; overload protection |
| Reference port contamination | Variable; up to 1% FS | Comparison to barometric reference | IP66/IP67 housing; reference port filter |
| Process fluid ingress | Progressive span error | Span calibration trend over time | Compatible wetted materials; diaphragm seal |
Managing Hundreds of Pressure Sensors Across Multiple Process Lines?
iFactory's IoT Sensor Integration platform tracks calibration status, drift trends, and alert thresholds for every pressure transmitter in your facility — automated, auditable, and connected to your CMMS workflow.
Industrial Pressure Sensor Selection: Matching Technology to Application Requirements
Selecting the wrong pressure sensor for a given process application is one of the most common and expensive instrumentation mistakes in U.S. manufacturing. The performance specification sheet tells you what a sensor can do in ideal conditions — the selection framework below is what tells you which sensor will actually hold calibration in your specific operating environment.
Define the Measurement Range with Adequate Margin
Select a sensor with a full-scale range of 1.5 to 2 times the normal operating pressure. Operating a sensor above 80% of full scale compromises linearity and accelerates diaphragm fatigue. Operating below 20% of full scale sacrifices resolution. For variable-pressure applications, consider sensors with dual-range capability or rangeability settings adjustable via HART communication.
Qualify Process Temperature and Pressure Transients
Process temperature affects both the wetted materials specification and the thermal error budget. Identify the maximum continuous process temperature, the maximum excursion temperature during startup/shutdown, and whether the application involves steam or thermal cycling. Pressure transient (spike) characterization determines whether a snubber, pulsation dampener, or higher overpressure rating is required to prevent diaphragm damage between calibration events.
Specify Wetted Material Compatibility
The sensor diaphragm and process connection materials must be chemically compatible with the process fluid at operating temperature and pressure. Standard 316L stainless steel handles most water, oil, and mild chemical services. Hastelloy C-276 or Tantalum diaphragms are required for strong acids, chlorinated compounds, and oxidizing media. Incorrect wetted material selection is the leading cause of premature sensor failure and accelerating drift in chemical process applications. See how iFactory tracks wetted material specifications for your entire sensor fleet — book a demo with our process engineering team.
Determine Output Protocol and IIoT Integration Path
For new installations, digital output protocols — HART 7, FOUNDATION Fieldbus, Profibus PA, or WirelessHART — provide significant advantages over traditional 4–20 mA analog: remote configuration, continuous self-diagnostics, and multi-variable transmission from a single sensor. HART-enabled transmitters allow zero and span adjustments from the control room without physical access to the sensor — eliminating the labor cost of field calibration for routine trim adjustments while maintaining calibration traceability.
Establish Installation and Mounting Best Practices
Even correctly specified sensors fail early when improperly installed. Key installation requirements: mount gauge pressure sensors with the process port facing down or sideways to prevent condensate accumulation in the reference cavity; use impulse line slope of at least 1:10 to prevent gas pockets in liquid service; install isolation valves to enable field calibration without process shutdown; use vibration-isolating mounting brackets in pump or compressor service where pipeline vibration exceeds 1g.
IIoT-Connected Pressure Monitoring: From Field Sensor to Actionable Process Intelligence
The evolution from standalone pressure transmitters to IIoT-integrated pressure monitoring systems changes what pressure measurement can do for a manufacturing operation. Real-time data from pressure sensors — when properly structured, contextualized, and connected to analytics platforms — enables process optimization, predictive maintenance, and quality assurance capabilities that periodic manual readings cannot deliver.
Continuous Drift Detection via Statistical Process Control
IIoT platforms apply SPC rules to continuous pressure sensor output — detecting the slow upward or downward trend that indicates drift before the sensor breaches its accuracy specification. Western Electric rules applied to sensor output data can identify drift patterns 30–60 days before a traditional calibration check would detect the same shift. When a pressure reading is drifting toward out-of-spec territory, a proactive work order for calibration is generated — not an emergency response to a process upset caused by a miscalibrated transmitter. See how iFactory's SPC monitoring works for your sensor network — book a demo with our IIoT integration specialists.
Cross-Sensor Validation and Redundancy Checking
In process plants with redundant pressure measurement points — common in safety-critical applications and SIL-rated loops — IIoT platforms continuously compare outputs from redundant sensors. When one sensor begins to deviate from its pair, an alert flags the divergence before either sensor exceeds its specified accuracy limit. This cross-validation approach dramatically reduces the risk of a single drifted sensor driving incorrect control actions while also reducing calibration frequency for validated redundant pairs.
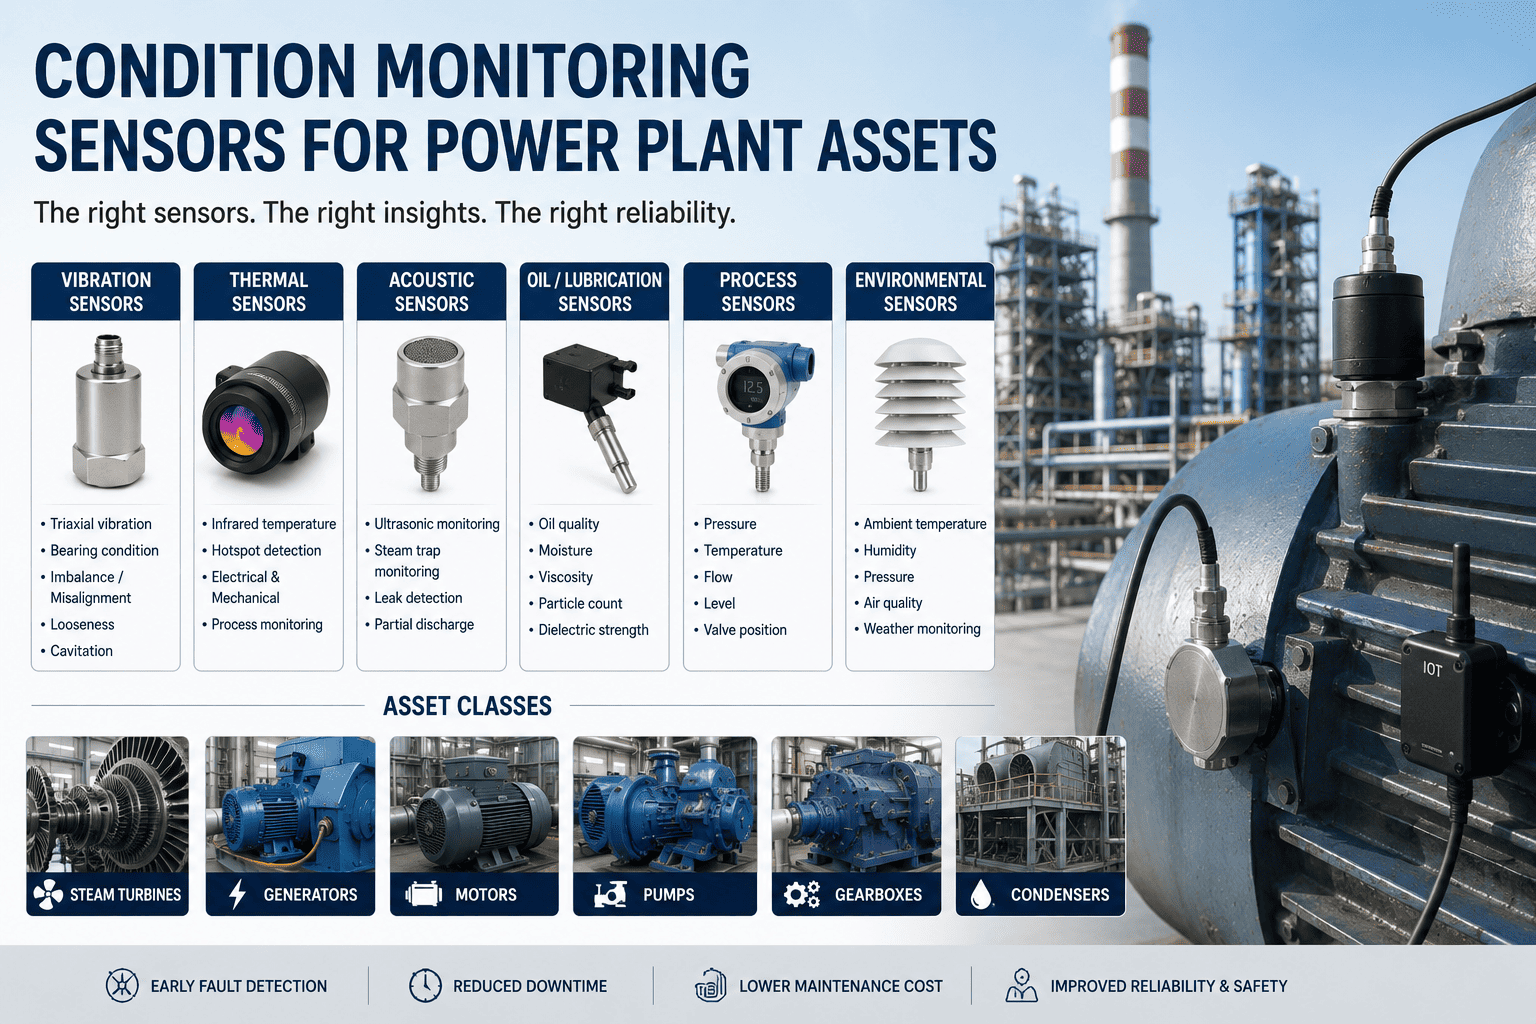
Pressure-Based Equipment Health Monitoring
Pressure sensor data streams are powerful inputs for equipment condition monitoring — pump cavitation appears as high-frequency pressure fluctuations upstream of the pump; filter blockage shows as increasing differential pressure; valve seat leakage creates characteristic pressure decay patterns during closed-valve dwell periods. IIoT platforms that correlate pressure patterns with equipment health states convert your existing pressure sensor network into a distributed condition monitoring system without additional hardware investment.
Automated Calibration Scheduling and Compliance Tracking
For FDA-regulated manufacturers operating under 21 CFR Part 11 or ISO 9001-certified facilities, calibration records must be traceable, complete, and retrievable on demand. IIoT-integrated calibration management automatically tracks calibration due dates for every sensor in the asset register, generates work orders at configurable lead times, records calibration as-found and as-left data, and maintains the complete audit trail required for regulatory inspection — eliminating the manual spreadsheet management that creates compliance gaps in large sensor populations.
Industry Expert Review: What Process Engineers and Instrumentation Specialists Say About Modern Pressure Measurement
iFactory's instrumentation and IIoT engineering team has worked with process manufacturers across the U.S. Gulf Coast, Midwest chemical corridor, and pharmaceutical manufacturing hubs. The following reflects distilled expert perspective from pressure monitoring deployments across high-criticality process environments.
"The single most common mistake we see in mature manufacturing facilities is treating pressure sensor calibration as a compliance exercise rather than a measurement quality program. When you have 400 pressure transmitters on a fixed 12-month schedule, you're calibrating the stable ones too often and the problem ones not often enough. The moment you connect sensor output data to a real-time analytics platform, the drift patterns become obvious — and you can shift your calibration resources to where they actually change outcomes. That shift alone typically funds the entire IIoT integration investment within the first year of operation."
Three Non-Obvious Insights from Industrial Pressure Sensor Deployments
Conclusion: Building a Pressure Measurement Program That Holds Accuracy Across Your Entire Asset Life Cycle
Industrial pressure sensors do not fail catastrophically in most cases — they drift slowly, calibration record by calibration record, until the cumulative measurement error is large enough to affect process quality, control system performance, or regulatory compliance. The facilities that operate the most reliable pressure measurement programs share three characteristics: they select sensors matched to their specific operating environment rather than defaulting to lowest-cost units; they apply risk-based calibration intervals based on observed drift data rather than fixed schedules; and they use IIoT platforms to monitor sensor output continuously between calibration events rather than trusting point-in-time snapshots.
As process manufacturing facilities expand IIoT connectivity, the pressure transmitter network becomes a continuous source of process intelligence — not just a compliance instrument. The operators that recognize this transition early and invest in sensor integration infrastructure are building measurement programs with measurably lower process upset frequency, higher first-pass quality rates, and dramatically reduced emergency calibration events compared to facilities still running static annual calibration programs.
iFactory's IoT Sensor Integration platform has been purpose-built for the data complexity, calibration management requirements, and process monitoring workflows of industrial manufacturing — from single-plant pressure monitoring to multi-site sensor fleet management. Book a demo with our instrumentation specialists to see a live walkthrough of the platform configured for your process environment.
Frequently Asked Questions: Industrial Pressure Sensors, Calibration, and Drift Compensation
What is the difference between gauge, absolute, and differential pressure sensors, and how do I select the right type for my application?
Gauge pressure sensors measure pressure relative to local atmospheric pressure — correct for most process pressure monitoring where the relevant variable is pressure above ambient. Absolute pressure sensors reference a sealed vacuum — required for applications where atmospheric pressure variation would corrupt the measurement, such as altitude-sensitive processes or vacuum system monitoring. Differential pressure sensors measure the difference between two process points — the standard for flow measurement across orifice plates, filter differential monitoring, and level measurement via pressure head. Selecting the wrong measurement reference introduces systematic error equal to the full magnitude of the difference between references — which at sea level is approximately 14.7 PSI for gauge vs. absolute confusion, an error typically larger than the sensor's accuracy specification by an order of magnitude.
How often should industrial pressure sensors be calibrated, and what factors should drive the calibration interval decision?
Initial calibration intervals for new sensor installations are typically set at 12 months based on manufacturer stability specifications. After two to three calibration cycles, actual as-found drift data for each individual sensor should be analyzed to determine whether the interval is appropriate, too conservative, or insufficient. Sensors consistently found within 10% of their tolerance limit at calibration may be safely extended to 18–24 month intervals. Sensors with 50%+ tolerance consumed at calibration should be reduced to 6-month cycles and evaluated for replacement or process condition root cause. Regulatory applications under FDA, OSHA PSM, or ISO 9001 may specify maximum permissible intervals regardless of observed drift — always check applicable regulatory requirements before extending intervals beyond manufacturer recommendations.
Can HART communication be used for remote calibration of pressure transmitters without sending a technician to the field?
HART communication enables remote zero and span trim adjustments from a control room HART master, asset management system, or iFactory's sensor integration platform — without physical access to the transmitter. However, HART remote trim is not equivalent to full calibration: it adjusts the transmitter's output based on operator-supplied reference values without applying a traceable external pressure reference. For regulatory-compliant calibration under ISO 9001, FDA, or safety integrity level (SIL) frameworks, a physical calibration with a traceable reference standard is required at the calibration interval. HART remote trim is best used for between-interval zero corrections on transmitters that drift predictably due to known causes such as temperature cycling.
What is the best way to detect pressure sensor drift before it causes a process upset or quality deviation?
The most effective approach is continuous statistical monitoring of sensor output data using SPC methods — specifically, tracking exponentially weighted moving average (EWMA) or CUSUM charts of sensor output at steady-state process conditions. When the process is known to be at a stable operating point, systematic drift in sensor output is distinguishable from normal process variation. IIoT platforms like iFactory's IoT Sensor Integration module automate this analysis across the entire sensor population, generating calibration work orders when drift trends exceed user-configurable alert thresholds — typically 25–50% of the sensor's total accuracy specification — before the sensor reaches an out-of-spec condition.
How do I justify the capital investment in IIoT pressure monitoring to facility management?
The business case for IIoT pressure monitoring is built across three primary value streams. First, unplanned downtime prevention: a single process upset caused by a drifted pressure sensor in a mid-size U.S. process plant typically costs $80,000 to $400,000 in lost production, off-spec product, and emergency maintenance — preventing two to three such events per year funds most IIoT investments. Second, calibration labor optimization: risk-based calibration interval management enabled by continuous monitoring consistently reduces total calibration labor by 25–35%, which at a facility with 200+ pressure sensors represents $120,000 to $250,000 in annual labor savings. Third, regulatory audit efficiency: automated calibration record management eliminates the labor associated with manual record compilation for FDA or ISO audits and reduces the risk of audit findings that trigger costly corrective action programs.
Stop Managing Pressure Sensors Reactively. Start Monitoring Drift Before It Costs You.
iFactory's IoT Sensor Integration platform is already deployed across process manufacturing, pharmaceutical, and energy facilities. See a live walkthrough configured for your sensor environment — no obligation, no generic demos.


.png)