Takt Time, Cycle Time & Lead Time: Differences That Change Your Plant
By Daniel Brooks on May 23, 2026
Takt time, cycle time, and lead time are the three core metrics that determine whether a production floor runs efficiently or bleeds cost. Most manufacturers track them separately — few use them as a connected system. This guide explains what each metric means, how to calculate it and exactly how the three work together to drive lean production decisions.
Lean Manufacturing · Production Engineering · KPIs
Takt Time, Cycle Time & Lead Time: Differences That Change Your Plant
Three metrics. One system. Calculate, compare, and act on takt time, cycle time, and lead time to drive real efficiency gains across your production floor.
Lead time reduction achievable with aligned metrics
5–15%
Actual value-added % of total lead time in most plants
Real-Time
OEE dashboards track all three simultaneously
Sources: Lean Enterprise Institute · SME Manufacturing Report 2024 · Industry Week Benchmarks · iFactory OEE Deployment Data 2026
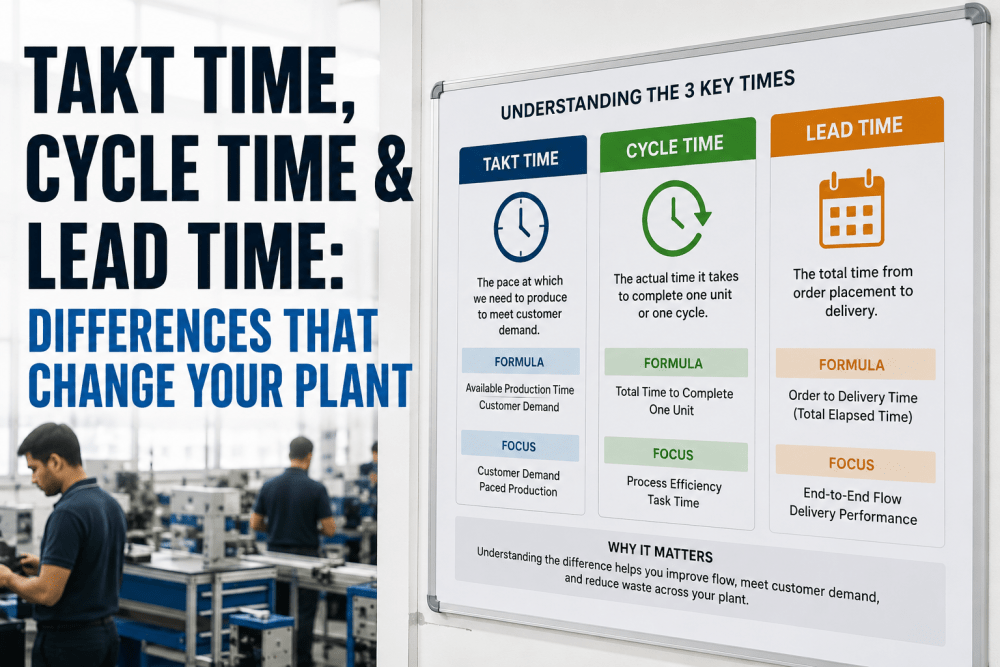
The Three Metrics Defined
Each metric answers a different question and requires a different response when it drifts. Understanding all three — not just one — is what separates lean-running plants from reactive ones.
Takt Time
"How fast do we need to produce?"
A target set entirely by customer demand and available production hours. It is the pace your line must hit — not what it does hit.
Formula
Available Production Time ÷ Units of Customer Demand
Unit: seconds or minutes per unit
Cycle Time
"How fast do we actually produce?"
Floor-measured elapsed time from one unit starting a process step to the next unit starting the same step. Cycle time is reality.
Formula
Net Production Time ÷ Units Produced in That Period
Unit: seconds or minutes per unit
Lead Time
"How long does the customer wait?"
Total elapsed time from order to delivery — including queue, processing, inspection, transport, and wait. Almost always longer than people inside the plant assume.
Formula
Queue + Process + Inspection + Move + Wait Time
Unit: hours, days, or weeks
Takt vs. Cycle Time — The Ratio That Runs Your Line
The relationship between takt time and cycle time is the single most important diagnostic ratio in lean manufacturing. Any deviation has direct operational and financial consequences.
Takt vs. Cycle Time — Scenarios and Responses
Lean Enterprise Institute · SME Benchmarks 2024
Scenario
Condition
Impact
Lean Response
Risk
CT = Takt
Perfect balance
Producing at exactly customer demand rate
Maintain. Monitor for drift. Continue kaizen.
Optimal
CT < Takt
Faster than demand
Overproduction, WIP builds, storage costs rise
Reduce operator count, redirect capacity, slow to takt
Waste Risk
CT > Takt
Slower than demand
Missed shipments, forced overtime, customer risk
Find bottleneck, run time studies, reduce changeover
Critical
CT varies by station
Line imbalance
WIP builds upstream, downstream stations idle
Line balancing: redistribute tasks, redesign sequence
High
Worked Example — Automotive Components Line (8-Hour Shift)
Single product family · U.S. mid-size Tier 2 supplier
Step 1
Available Time
480 min − 50 min breaks = 430 min = 25,800 sec
Step 2
Customer Demand
Daily order = 860 units per shift
Step 3
Takt Time
25,800 ÷ 860 = 30 seconds per unit
Result
Gap Analysis
Actual CT = 35.8s → 5.8s gap → 140 unit shortfall/shift → ~$655K/year revenue at risk
Where Lead Time Actually Goes
Value Stream Mapping consistently shows that process time — when value is actually being added — represents only 5 to 15 percent of total lead time. The rest is waste that can be reduced or eliminated.
Lead Time Composition — Value vs. Non-Value-Added
VSM Reference · Lean Enterprise Institute · Industry Week 2024
Queue / Wait Time
55%
Non-Value-Added
Transport & Move
18%
Non-Value-Added
Inspection & Rework
12%
Necessary NVA
Actual Process Time
10%
Value-Added
Scheduling Delay
5%
Non-Value-Added
In a 14-day manufacturing lead time, only ~1.4 days represent value-adding process time. The remaining 12.6 days are waste — schedulable, reducible, and eliminable with lean tools and real-time visibility.
How All Three Metrics Work as a System
Takt, cycle, and lead time are not independent KPIs. They form a causal chain. When cycle time exceeds takt, WIP builds. WIP buildup feeds queue time. Queue time inflates lead time. Fixing one without tracking the others means solving symptoms, not causes.
New Product Launch — Set Baseline Metrics First
Takt time is the first calculation — before tooling, layouts, or staffing. Design workstation cycle times at 85–90% of takt to absorb variability. Map end-to-end lead time before the first shipment commitment. Cycle time typically runs 15–30% above takt at day one; track toward alignment over weeks 1–8.
Calculate takt from demand forecast before line design
Set station CT at 85–90% of takt as launch target
Map full lead time before committing delivery dates
Week 1–8
Cycle-to-takt alignment window
85–90%
Target station CT as % of takt at launch
15–30%
Typical CT overage vs. takt on day one
Pre-Launch
When lead time mapping must complete
Demand Surge — Recalculate Takt Before Authorizing Overtime
When demand jumps 20–40%, takt compresses. The correct sequence: recalculate takt first, compare it to current measured cycle time, identify the gap, then determine whether it is closeable by workstation optimization or requires additional shifts — before committing to overtime costs.
Recalculate takt with new demand and current shift hours
Measure current CT per station to find constraint
Model shift addition vs. CT improvement before deciding
20–40%
Typical takt compression during surges
First Step
Recalculate takt before any labor decision
$180–$320
Avg hourly cost of unplanned overtime/operator
Bottleneck
Station where CT is closest to or above new takt
Line Rebalancing — Eliminating the Gap Station by Station
Line imbalance creates islands of overwork and underwork, increases WIP, and makes output hostage to the slowest station. Measure cycle time at every station, plot it against takt, then redistribute work elements from overburdened to underloaded stations. The goal: every station at or below takt, minimum idle time.
Time-study every station to exact CT (not estimated)
Plot station CTs on bar chart against takt line
Redistribute tasks from overloaded to underloaded stations
LE%
Line Efficiency = Sum(CT) ÷ (Stations × Takt)
8–15%
Throughput gain from proper rebalancing
Bottleneck
Station where CT > takt = line speed limit
1–3 Days
Typical time-study + rebalancing duration
Lead Time Reduction — Target Non-Value-Added Time
Lead time reduction requires a value stream map, not a gut feel. The highest-leverage interventions are batch size reduction, pull system conversion, and SMED events. Because process time is only 5–15% of total lead time, targeting queue and wait time delivers 5–10x more reduction per effort than optimizing machine cycle time alone.
Map current state with time data at every step
Calculate process time ratio (target: above 25%)
Run SMED on highest-changeover bottleneck first
23–40%
Lead time reduction with VSM + pull system
SMED
Single Minute Exchange of Die — changeover method
<25%
Process time ratio signals major opportunity
Pull
Largest single structural reducer of queue time
Real-Time OEE · Takt Tracking · Cycle Time Monitoring
Track All Three Metrics Live — On One Dashboard
iFactory's OEE Analytics platform gives your team live visibility into takt adherence, cycle time gaps, and lead time trends — with automatic alerts when any metric drifts out of alignment.
The most common failure I see is treating takt time as a one-time calculation done during line design, then never revisiting it. Demand changes. Shift structures change. But takt stays frozen while the floor operates against a number that stopped being accurate 18 months ago. Plants that track all three metrics shift-by-shift — not in a monthly report — consistently outperform on delivery and cost.
Takt time, cycle time, and lead time form a single diagnostic system. Takt sets the pace the market demands. Cycle time reflects the pace your floor delivers. Lead time exposes the full gap between what the customer experiences and what a lean system would provide. When all three are tracked continuously and acted on at the shift level, the results are consistent: throughput increases, inventory shrinks, and delivery performance improves. The math is straightforward — the discipline is the hard part, and it starts with real-time production visibility.
Frequently Asked Questions
Takt time is the pace your line needs to hit to satisfy customer demand — a target set externally by orders and available hours. Cycle time is the pace your line actually hits — measured on the floor. When cycle time exceeds takt time, you are falling behind demand. The goal is to keep cycle time at or slightly below takt across all workstations.
Use a rolling weekly or monthly average rather than reacting to daily spikes. If weekly demand averages 4,300 units across 5 days, set takt based on 860 units/day even if individual days range from 720 to 1,020. Takt should be stable enough for operators to work against, but updated frequently enough to reflect genuine demand shifts — recalculating weekly is standard in high-mix environments.
Yes — and this is where the largest gains are. Because value-added process time is only 5–15% of total lead time, reducing cycle time alone has limited impact. The biggest opportunities are in queue time, batch release delays, and transport routing — none directly related to machine cycle time. Converting push to pull, reducing batch sizes, and eliminating inspection holds can cut lead time 30–60% without changing a single machine's cycle time.
OEE's Performance component is the ratio of ideal cycle time to actual cycle time. A machine rated at 30 seconds running at 36 seconds has a Performance score of 83.3%. Takt time adds the demand dimension OEE does not provide — a machine can have 95% OEE but still fail to meet takt if its designed cycle time was never calibrated to current demand. Real-time OEE dashboards overlaying takt give supervisors the complete picture.
Process time ratio = total value-added process time ÷ total lead time × 100. Example: 3.2 hours of processing in an 18-day (432-hour) lead time = 0.74%. World-class lean plants reach 25–50%. Ratios below 10% indicate the majority of the customer's wait is pure waste — queue, batch delays, inspection holds — targetable through VSM and pull conversion.
Stop Managing by Instinct — Start Managing by Data
Put All Three Metrics on One Live Production Dashboard
iFactory's Real-Time OEE Analytics gives your plant the live data it needs to catch cycle time drift before it becomes a delivery crisis — and to build the operational discipline that turns these three metrics into a competitive advantage.
.png)
.png)