A steel rolling mill in Indiana had 14 critical drive motors spread across two hot strip lines. Each motor was worth $320,000 to replace. Each hour of unplanned downtime on either line cost $480,000 in lost production. The maintenance team monitored these motors the way most plants still do — monthly vibration readings taken with a handheld analyser, logged into a spreadsheet, reviewed when someone had time. On a Thursday afternoon in March, Motor 7 on Line 2 seized without warning. The post-mortem revealed that the inner race bearing had been degrading for 26 days — a pattern clearly visible in the vibration frequency spectrum, but invisible to monthly spot checks. The $480,000 per hour losses accumulated for 11 hours before the replacement motor was installed and the line restarted. Total cost: $5.6 million. Five months later, the plant connected all 14 motors to an AI-powered digital twin monitoring platform with continuous vibration, thermal, and current sensors. Within the first 90 days, the system flagged bearing degradation on Motor 3 — 19 days before projected failure. The replacement was scheduled during a planned weekend shutdown. Cost of the intervention: $41,000. Cost of the avoided failure: $5.3 million.
iFactory Predictive Intelligence
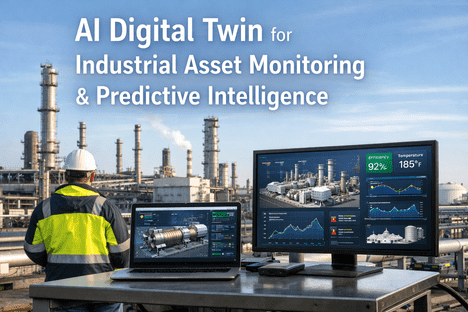
AI Digital Twin for Industrial Asset Monitoring and Predictive Analytics
How AI-powered digital twins with continuous sensor monitoring are replacing periodic inspections with 24/7 intelligent surveillance that predicts failures weeks before they happen
26 days
Average degradation window missed by periodic inspections
94.3%
Failure prediction accuracy with AI twin models
$260K/hr
Average manufacturing downtime cost
130x
ROI ratio — $41K intervention vs $5.3M avoided failure
Periodic Inspections Cannot See What Continuous Monitoring Reveals
The fundamental flaw in traditional asset monitoring is temporal — it samples condition at intervals while degradation happens continuously. A monthly vibration check captures one data point out of roughly 2.6 million seconds of operation. Everything that happens between readings is invisible. AI-powered digital twin monitoring closes that gap permanently.
Periodic Inspections
4 data points per quarter. Failure occurs between readings.
AI Twin Monitoring
Continuous data. Anomaly detected 19 days before failure threshold.
How a Digital Twin Monitors an Asset in Real Time
A digital twin is not a passive dashboard. It is an active, continuously learning model of each physical asset — fed by live sensor streams, calibrated against physics-based behaviour models, and capable of distinguishing normal operational variation from genuine degradation signals that demand attention.
Vibration accelerometers, thermocouples, current transformers, pressure transducers, and acoustic sensors capture thousands of data points per second from each monitored asset. Edge computing nodes process time-critical signals in sub-millisecond response times, sending only meaningful data upstream.
The digital twin maintains a physics-based model of how each asset should behave under current operating conditions — load, speed, ambient temperature, production cycle. Every incoming sensor reading is compared against this expected profile. Deviations that exceed learned tolerances trigger deeper analysis.
Machine learning models classify anomaly types — bearing wear, imbalance, misalignment, electrical faults — and correlate signals across multiple sensor channels. A subtle vibration shift alone might be ambiguous, but combined with a thermal uptick and a current draw increase, the diagnosis becomes high-confidence.
LSTM neural networks project the degradation curve forward in time, calculating when the asset will cross the failure threshold under current conditions. The Remaining Useful Life estimate updates continuously as new data arrives — 19 days to failure becomes 18, then 17, with confidence intervals narrowing as the prediction window shortens.
Based on severity and urgency, the platform auto-generates a prioritised work order, verifies spare parts availability, identifies the best-matched technician, and schedules the intervention during the lowest-impact production window. The entire chain from anomaly detection to action plan happens without human initiation.
Want to see how continuous twin monitoring would work on your critical assets? Book a free monitoring readiness assessment.
What the Twin Watches — Signal Types and What They Reveal
Each sensor type captures a different dimension of asset health. The power of AI twin monitoring is not in any single signal — it is in the correlation across all of them simultaneously, building a multidimensional health picture that no individual sensor or human analyst could construct alone.
| Signal Type |
What It Detects |
Early Warning Window |
Key Equipment |
| Vibration |
Bearing wear, imbalance, misalignment, looseness, gear mesh faults |
2-8 weeks before failure |
Motors, pumps, fans, compressors, gearboxes |
| Thermal |
Winding insulation breakdown, friction, overload, cooling system degradation |
1-4 weeks |
Motors, transformers, bearings, electrical panels |
| Current Signature |
Rotor bar cracks, stator faults, electrical imbalance, power quality issues |
2-6 weeks |
Electric motors, drives, generators |
| Acoustic |
Cavitation, leaks, friction, micro-fractures, valve seat erosion |
1-3 weeks |
Pumps, valves, steam traps, pressure vessels |
| Oil Particle |
Metallic wear particles, contamination, viscosity breakdown, moisture ingress |
4-12 weeks |
Gearboxes, hydraulics, turbines, compressors |
| Multi-Signal Fusion |
Correlated weak signals that individually fall below alarm thresholds |
3-8 weeks (highest confidence) |
All critical rotating and process equipment |
Digital Twin Monitoring vs Traditional Approaches
The shift from periodic to continuous monitoring is not incremental improvement — it is a fundamental change in what is possible. Here is how the three major monitoring approaches compare across the metrics that matter most to plant operations.
Reactive
DetectionAfter failure
Warning TimeZero
Cost Multiplier3-5x planned
Labour HoursHighest (emergency)
Production ImpactUnplanned shutdown
Data CapturedFailure records only
Periodic Inspection
DetectionAt next reading
Warning TimeDays to weeks
Cost Multiplier1.5-2x planned
Labour HoursHigh (route-based)
Production ImpactSemi-planned
Data CapturedSnapshots at intervals
AI Twin Monitoring
DetectionAt anomaly onset
Warning Time14-21 days (94%+)
Cost Multiplier1x (fully planned)
Labour Hours3.2x fewer than emergency
Production ImpactScheduled in low-impact window
Data CapturedContinuous, multi-signal, correlated
The Financial Case for Continuous Twin Monitoring
The economics of digital twin monitoring are driven by a simple asymmetry: the cost of prevention is a fraction of the cost of failure. Every metric below is documented from real industrial deployments.
30-50%
Reduction in unplanned downtime — the single largest cost driver in manufacturing, averaging $260,000 per hour across industries
18-25%
Total maintenance cost reduction by eliminating unnecessary scheduled work and preventing catastrophic reactive repairs
20-40%
Asset lifespan extension through condition-based interventions that prevent damage accumulation from missed early warnings
15-30%
Spare parts inventory reduction from demand-based restocking driven by actual asset condition rather than safety stock assumptions
Want to calculate what continuous monitoring would save at your facility? Get a customised ROI analysis from our engineers.
Frequently Asked Questions
How many assets should we monitor to start seeing results?
Most deployments start with 10-20 critical assets where failure cost is highest. A single avoided catastrophic failure often pays for the entire monitoring system. ROI becomes measurable within 8-12 weeks, and you scale coverage incrementally as value is demonstrated across each asset class.
How long does it take for the AI twin to learn our equipment behaviour?
Anomaly detection alerts begin within 4-6 weeks of data collection. Prediction accuracy improves over 3-6 months as models learn normal operating patterns, seasonal variations, and load-dependent behaviours. Transfer learning from similar equipment at other installations provides useful baseline predictions from day one, even before site-specific learning matures.
What if we already have a SCADA system collecting data?
Existing SCADA data is valuable and integrates directly into the twin platform via OPC-UA and standard historians. However, SCADA typically captures process variables at relatively low sample rates. AI twin monitoring adds high-frequency condition signals — vibration spectra, acoustic emissions, current signatures — that SCADA was never designed to capture. The two systems are complementary, not competitive.
Can AI distinguish between a real degradation signal and normal operational variation?
This is the core capability that separates AI twin monitoring from simple threshold alarms. The twin model accounts for operating context — load changes, speed variations, ambient temperature, production cycle phase — and only flags deviations that exceed learned tolerances relative to current conditions. This context-aware approach eliminates the false alarms that plague fixed-threshold systems.
Does continuous monitoring generate alert fatigue?
AI twin platforms are designed to prevent alert fatigue, not create it. Multi-signal correlation means the system only alerts when multiple independent indicators converge on the same diagnosis. Severity scoring ensures that only actionable alerts reach maintenance teams. Advisory-level observations accumulate in dashboards for trend review without triggering notifications until they cross intervention thresholds.
See Everything. Predict Everything.
Your Assets Are Talking. Build the Intelligence Layer That Listens 24/7.
iFactory's AI-powered digital twin monitoring platform gives every critical asset a continuous health surveillance system — detecting degradation at onset, predicting failures weeks in advance, and auto-generating the interventions that prevent them.
19 days
Avg early warning
130x
ROI on avoided failures
6 wks
Time to first alerts