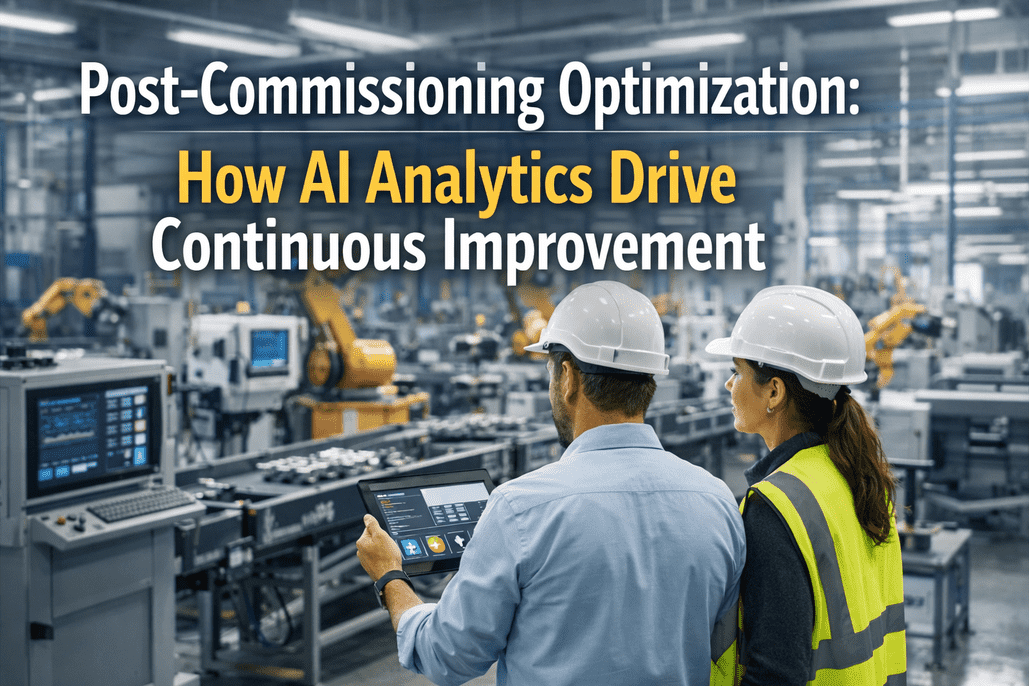
The ribbon is cut. Production is running. Commissioning is "complete." And then comes the most dangerous phase of any greenfield project — the one nobody budgets for: the slow drift from launch performance to sustained mediocrity. Most factories hit peak attention at commissioning, then gradually lose focus as the project team disbands, tribal knowledge walks out the door, and operations settles into "good enough." Meanwhile, micro-stops accumulate invisibly. Process parameters drift from optimal. Changeover times creep upward. Equipment that was new six months ago starts developing patterns that predict failures nobody is watching for. The OEE software market is growing from $65.7B in 2024 to $121B by 2029 — because manufacturers are finally recognizing that the biggest ROI isn't in the build, it's in what happens after. AI analytics transform OEE from a weekly lagging indicator into a real-time operational compass that identifies the next improvement opportunity before humans notice the problem. This is how you turn a new factory into a continuously improving one. Book a demo to see AI-driven continuous improvement in action.
The Post-Commissioning Reality Gap
Every greenfield factory experiences the same pattern: OEE climbs rapidly during ramp-up under intense project attention, plateaus when the commissioning team leaves, and then slowly erodes as small inefficiencies compound. Two lines with identical 85% OEE scores can have completely different problems — one might be losing availability to unplanned downtime, the other losing performance to micro-stops. Without AI breaking the OEE score into its component drivers in real-time, teams waste resources fixing the wrong problems.
Commissioning Attention
Full project team on-site. Every issue gets immediate attention. OEE climbs rapidly from 40-60% toward 70-80%. Daily reviews, dedicated engineers, vendor support.
OEE: 40% → 75%The Plateau
Project team disbands. Vendor support contracts expire. Operations inherits the system. Improvement velocity drops. "Good enough" becomes the standard. Hidden losses go untracked.
OEE: 75% → stuck at 75%AI-Driven Optimization
AI models retrained on 6+ months of production data deliver second-wave improvements. Micro-stops visible. Parameters auto-tuned. Predictive maintenance catching failures weeks ahead.
OEE: 75% → 85%+The gap between 75% and 85% OEE represents 10 points of hidden factory capacity — no new equipment, no new lines, just smarter use of what you already built. For a mid-size facility, that gap is worth $3-8M annually.
How AI Optimizes All Three OEE Pillars Simultaneously
Traditional continuous improvement works one pillar at a time. AI sees the interdependencies between availability, performance, and quality — and optimizes them simultaneously.
Availability
Keeping lines runningWithout AI: React to breakdowns. Schedule PM on calendar intervals regardless of actual condition. Changeovers take however long they take. Micro-stops go unrecorded.
With AI: Predictive models anticipate failures 3-6 weeks ahead. PM scheduled based on actual asset condition. SMED + AI scheduling cuts changeover time 30-50%. Micro-stops are automatically captured, categorized, and ranked by cumulative impact.
Performance
Running at optimal speedWithout AI: Lines run at operator-set speeds. Slow cycles go unnoticed. Bottleneck stations invisible unless someone is watching. Speed reductions become normalized.
With AI: Real-time speed optimization per station. Bottleneck identification through automated Pareto analysis. AI adjusts settings and sequences to maintain peak pace. Digital twin simulates impact of changes before execution.
Quality
Producing right first timeWithout AI: End-of-line inspection catches defects after scrap is created. Startup rejects accepted as inevitable. Root cause analysis is manual and retrospective.
With AI: AI controls every lever impacting quality before scrap is created. Vision systems detect defects at line speed. Closed-loop setpoint optimization continuously fine-tunes temperature, pressure, and flow rates. Startup recipes standardized via AI analysis of historical data.
Want to see which OEE pillar holds the biggest opportunity in your facility? Book a 30-minute OEE assessment — we'll break down your availability, performance, and quality losses and identify the fastest path to improvement.
The AI Optimization Playbook: 4 Quarterly Waves
Post-commissioning optimization isn't a single project — it's a structured program of quarterly improvement waves, each building on data from the previous cycle. AI models get smarter with more data, so returns compound over time.
Baseline & Quick Wins
Establish real OEE baselines across all lines. Deploy automated downtime tracking and loss categorization. AI identifies the top 5 loss categories via Pareto analysis. Quick-win fixes — sensor calibration, PM schedule corrections, operator procedure updates — capture $1-3M in immediate savings.
Predictive & Prescriptive
Predictive maintenance models trained on 6+ months of data begin catching failures 3-6 weeks ahead. AI scheduling optimizes production sequences for energy and changeover efficiency. Closed-loop quality control activates — setpoints adjusted in real-time based on incoming material variation.
Process Optimization
AI models retrained with full production data now identify complex multi-variable relationships that conventional analysis misses. Digital twin simulations test parameter changes virtually before execution. Energy optimization layers on — AI shifts energy-intensive operations to off-peak periods. Autonomous scheduling begins.
Autonomous Improvement
Agentic AI systems observe, reason, and act autonomously on routine optimization decisions. The factory becomes self-tuning — parameters adjust automatically, maintenance schedules dynamically, and production sequences optimize continuously. Human focus shifts to strategic improvement and exception handling.
What AI Optimization Targets: The Full Opportunity Matrix
| Optimization Area | AI Technique | What It Finds | Typical Improvement | Time to Impact |
|---|---|---|---|---|
| Unplanned Downtime | Predictive maintenance (vibration, thermal, acoustic ML) | Bearing wear, seal degradation, motor faults 3-6 weeks before failure | 35-55% reduction | 3-6 months |
| Micro-Stops | Automated event detection + Pareto ranking | 30-second jams, misfeeds, sensor trips that aggregate to hours/day | 40-60% reduction | 1-3 months |
| Changeover Time | AI scheduling + digital twin sequencing | Optimal product sequences, pre-set parameters, SMED automation | 30-50% faster | 2-4 months |
| Slow Cycles | Real-time speed monitoring + bottleneck identification | Lines running below nameplate speed due to drift, worn components | 10-20% speed recovery | 1-3 months |
| Startup Rejects | Standardized startup recipes from historical analysis | Optimal warm-up sequences, first-article parameters | 60-80% fewer startup defects | 2-4 months |
| Production Defects | AI vision + closed-loop setpoint optimization | Defect patterns correlated to process parameter drift | 25% yield increase | 3-6 months |
| Energy Waste | Energy digital twin + demand management AI | Peak demand charges, off-peak shifting opportunities, utility optimization | 20-35% energy cost reduction | 3-6 months |
| Tribal Knowledge Loss | GenAI knowledge capture from operator logs and video | Undocumented procedures, shift-specific best practices, workarounds | Preserved for all shifts/new hires | 1-3 months |
Ready to launch your post-commissioning optimization program? Schedule a strategy call — we'll identify your top 10 optimization opportunities ranked by ROI and build a quarterly improvement roadmap.
The Factory You Built Is Only as Good as How You Improve It
iFactory's AI analytics identify hidden inefficiencies, tune process parameters, and drive quarterly OEE improvements — turning your greenfield investment into a continuously compounding asset.
Frequently Asked Questions
Every OEE Point You Recover Is Pure Profit
The gap between 75% and 85% OEE is worth $3-8M annually for a mid-size facility. AI finds it, quantifies it, and helps you close it — quarter by quarter.