Target OEE for Greenfield Plants: Hit 85%+ From Day One | iFactory
By Riley Quinn on April 17, 2026
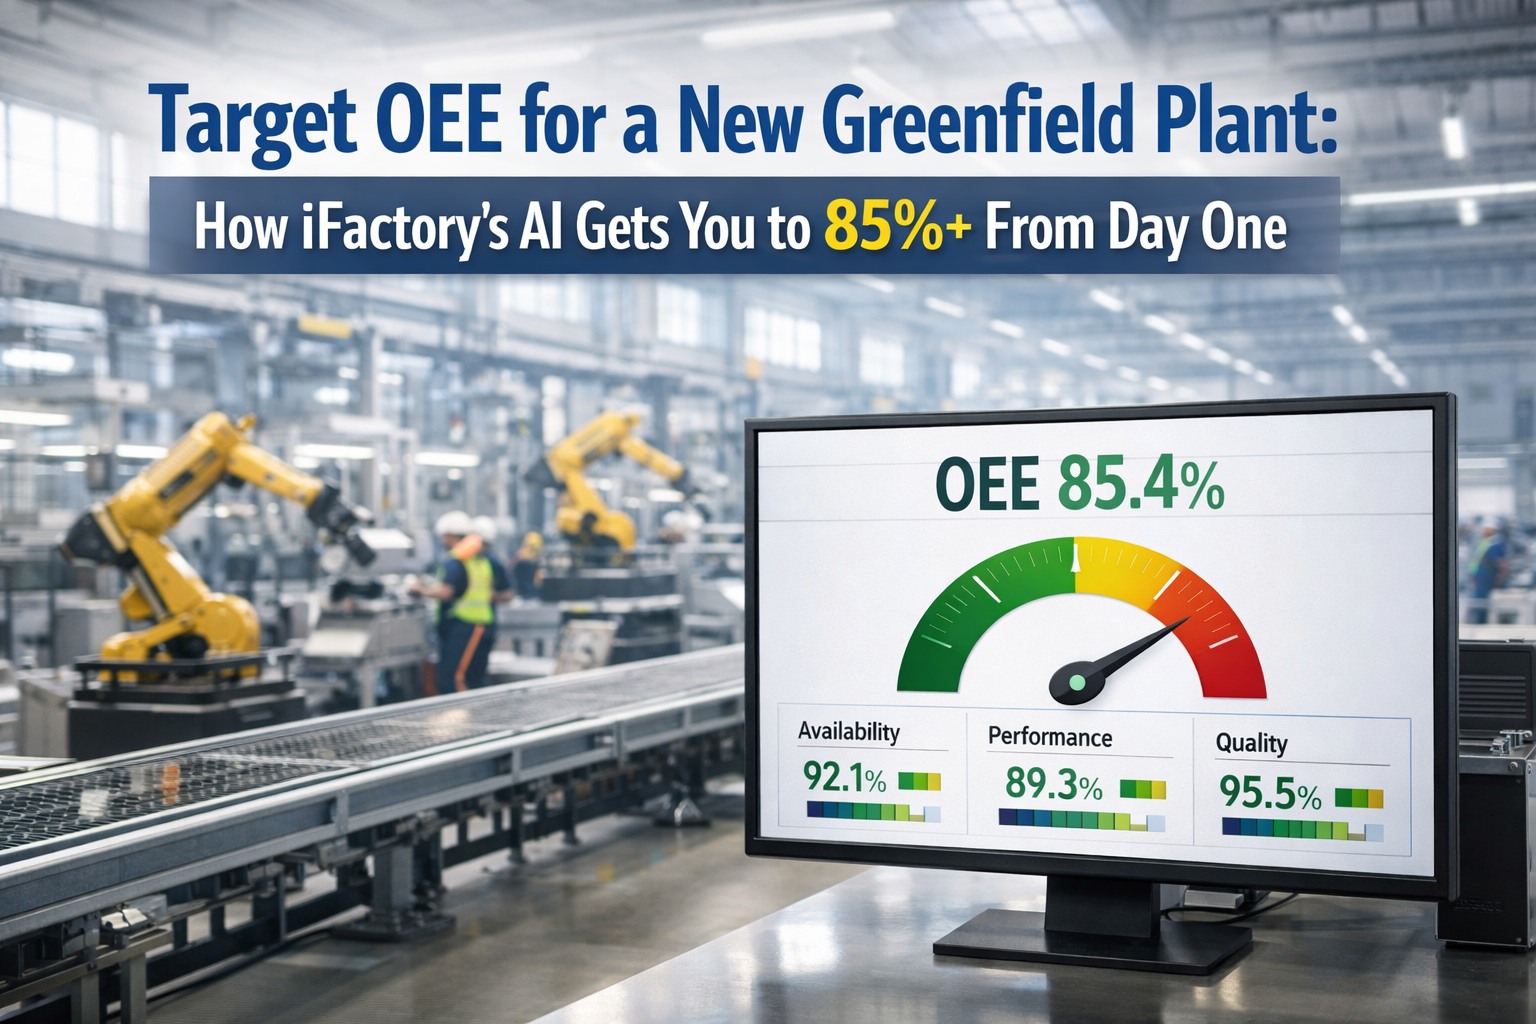
The worldwide average OEE for manufacturing plants sits between 40% and 60%. Only 6% of manufacturers consistently achieve world-class OEE of 85% or higher. But here's the opportunity most plant leaders miss: greenfield projects can design for 85%+ from day one—skipping the years of painful retrofitting that brownfield plants endure. This guide shows exactly how to set your OEE targets and build the systems to hit them from commissioning day.
Overall Equipment Effectiveness (OEE) measures how much of your planned production time is truly productive. It's the single best metric for understanding how downtime, slowdowns, and defects interact. World-class OEE of 85% was defined by Seiichi Nakajima, the originator of Total Productive Maintenance (TPM), and remains the gold standard benchmark for discrete manufacturing.
The OEE Formula
90%
Availability
Uptime vs. Downtime
×
95%
Performance
Speed vs. Ideal Rate
×
99%
Quality
Good Parts vs. Total
=
85%
World-Class OEE
Even 90% × 90% × 90% = only 73% OEE. Every component must perform at target to hit world-class.
Why Greenfield Plants Have the Advantage
Brownfield plants fight legacy equipment, data silos, and years of accumulated technical debt. Your greenfield project starts with a blank slate. Design for 85%+ OEE from the start, and you'll achieve in months what brownfield retrofits take years to accomplish.
Brownfield Reality
55-60% OEE
Legacy equipment with no connectivity
12-24 months to see improvement
Costly retrofits and integration
67% still rely on reactive maintenance
VS
Greenfield Opportunity
85%+ OEE Target
IIoT-ready equipment from day one
Hit targets from commissioning
Design-in predictive maintenance
Real-time OEE dashboards built-in
Ready to design your greenfield plant for world-class OEE? Book a free consultation with our OEE specialists.
OEE Benchmarks by Industry
Your target OEE depends on your industry. Regulatory-driven industries with standardized processes achieve higher OEE, while high-mix, low-volume operations face inherent complexity. Use these benchmarks to set realistic targets for your greenfield project.
Medical Devices
78% avg24% achieve 85%+
Automotive
75% avgTop 20% hit 85%+
Electronics
80% avgLeaders hit 85%+
Food & Beverage
70-80% avgWorld-class at 85%
Aerospace & Defense
68% avgComplex setups
Discrete Manufacturing
67% avgWide variance
The Six Big Losses Destroying OEE
Every point of OEE loss traces back to one of six categories defined by Total Productive Maintenance (TPM). Understanding where your losses occur is the first step to eliminating them.
Availability Losses
34% of total efficiency loss
1
Equipment Breakdowns
Unplanned stops from equipment failure — 42% of all unplanned downtime
2
Setup & Changeovers
Time lost switching products — 29% of efficiency losses
Performance Losses
Speed and micro-stop losses
3
Minor Stoppages
Brief stops under 5 minutes — often undercounted in manual tracking
4
Reduced Speed
Running below ideal cycle time — hidden capacity killer
Quality Losses
Defects and rework
5
Startup Defects
Scrap during warmup and changeover periods
6
Production Defects
Rejects and rework during steady-state production
How Much Hidden Capacity Is In Your Plant?
Every 1% OEE improvement unlocks production capacity you're already paying for. iFactory's AI identifies your biggest loss categories and prioritizes fixes by ROI impact.
iFactory's AI-powered platform addresses each OEE component with purpose-built tools that integrate during plant construction—not after production starts.
1
Real-Time OEE Dashboards
+20%Uptime Improvement
Live visibility into availability, performance, and quality—shift by shift, machine by machine.
2
Predictive Maintenance AI
43%Downtime Reduction
AI models predict failures before they happen. Address issues in planned windows—not emergency shutdowns.
3
Automated Work Orders
28%Faster Response
When sensors detect drift, work orders generate automatically with parts lists and SOPs.
4
Loss Analysis & Root Cause
70%Repeat Issue Reduction
AI categorizes every loss event automatically. Surface top contributors and eliminate them systematically.
Want to see how iFactory tracks OEE in real-time? Request a live demo of our dashboards.
The ROI of 85%+ OEE
$50B
Annual US downtime cost
Manufacturing downtime costs US manufacturers $50 billion annually
25%
Hidden capacity unlocked
Moving from 60% to 85% OEE unlocks capacity you're already paying for
8-11mo
Typical ROI payback
AI-driven OEE improvements typically pay back in under one year
40%
Maintenance cost reduction
Predictive maintenance cuts maintenance costs by 25-40%
Expert Perspective
"85% OEE is a proven, achievable benchmark—not a theoretical ceiling. Automotive and semiconductor manufacturers routinely operate above 85% on well-managed lines. The path to 85% typically takes 12-24 months with structured TPM programs and real-time loss visibility."
— Industry OEE Best Practices, 2026
67%
Still use reactive maintenance
72%
Have hidden fix workarounds
74%
See delays trigger chain reactions
Need help setting realistic OEE targets for your industry? Contact our team for benchmarks.
Frequently Asked Questions
Is 85% OEE realistic for a new plant?
Yes—with proper planning. The 85% benchmark was established by Seiichi Nakajima based on real plants achieving it consistently. Greenfield projects have the advantage of designing systems for this target from day one. Medical device manufacturers achieve 85%+ at nearly 24% of facilities; automotive leaders consistently hit mid-80s with lean practices.
What's the biggest factor limiting OEE?
Availability losses are the primary challenge, accounting for 34% of total efficiency losses. Equipment breakdowns cause 42% of unplanned downtime, followed by setup and changeover time at 29%. Predictive maintenance addresses availability directly—cutting downtime by 30-50% in facilities with IoT sensors.
How quickly can we see OEE improvement?
With real-time OEE tracking, improvements can begin within weeks. Implementing OEE tracking improves uptime by 20% on average. Predictive maintenance delivers ROI in 8-11 months. Plants using automated OEE tracking platforms reach 85% significantly faster.
Why is manual OEE tracking insufficient?
Manual tracking misses minor stoppages under 5 minutes, lags by hours or days, and often smooths data to hide real problems. 72% of plants have "hidden factories" of undocumented fixes masking true downtime. Real-time automated capture surfaces the losses that separate a 75% plant from an 85% plant.
How does iFactory integrate with our equipment?
iFactory connects via OPC-UA, MQTT, and REST APIs—standard protocols supported by modern IIoT-ready equipment. For greenfield projects, we integrate during construction so dashboards are live from commissioning day. The platform automatically ingests sensor data, calculates OEE in real-time, and generates work orders when thresholds are crossed.
Design Your Plant for 85%+ OEE From Day One
iFactory's AI-powered CMMS integrates during construction—not after production starts. Get real-time OEE dashboards, predictive maintenance, and automated work orders from commissioning day.