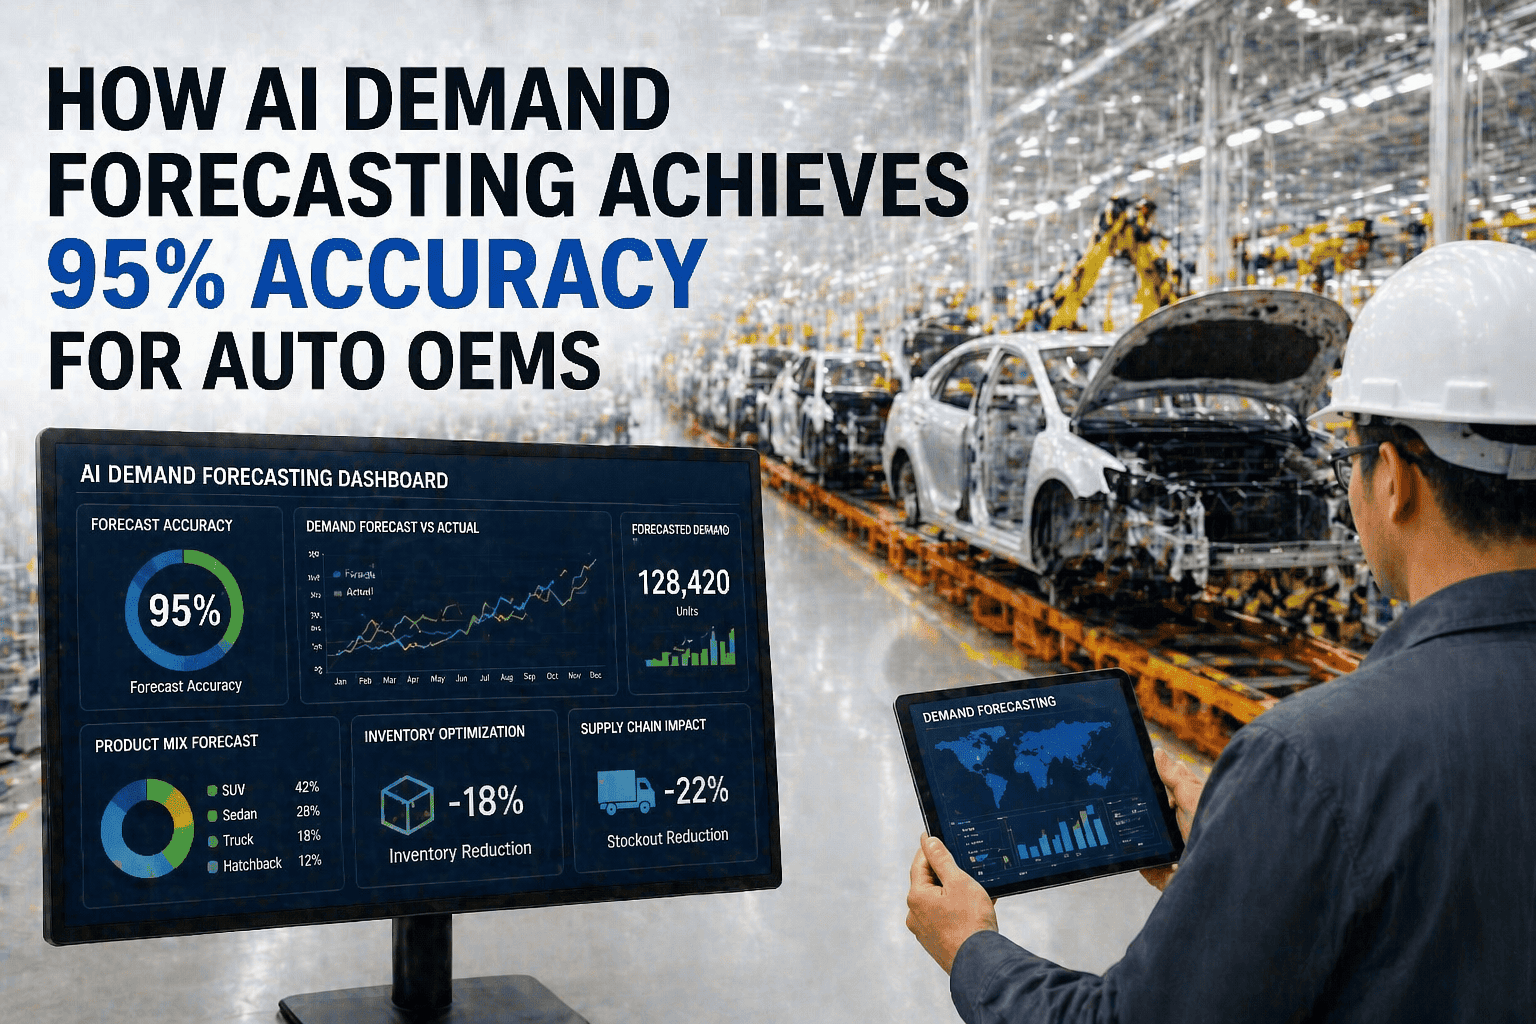
Automotive manufacturing plants managing complex multi-tier supply chains spanning hundreds of suppliers, thousands of components, and global distribution networks face critical inventory management challenges where traditional demand forecasting methods using manual statistical analysis, fixed safety stock policies, and inventory optimization spreadsheets fail capturing demand variability drivers, supplier reliability patterns, and production constraint impacts resulting in average inventory carrying costs consuming 15-25% of total supply chain expenses. Machine learning algorithms analyzing historical demand patterns, supplier performance data, production scheduling constraints, and external market signals optimize inventory decisions automatically reducing safety stock requirements 22-35%, improving inventory turnover 18-28%, and decreasing total supply chain costs $2.8-4.2 million annually per mid-size automotive manufacturing facility while simultaneously improving service levels and production schedule adherence. Book a Demo to see how machine learning reduces your specific inventory costs based on your supply chain configuration and demand patterns.
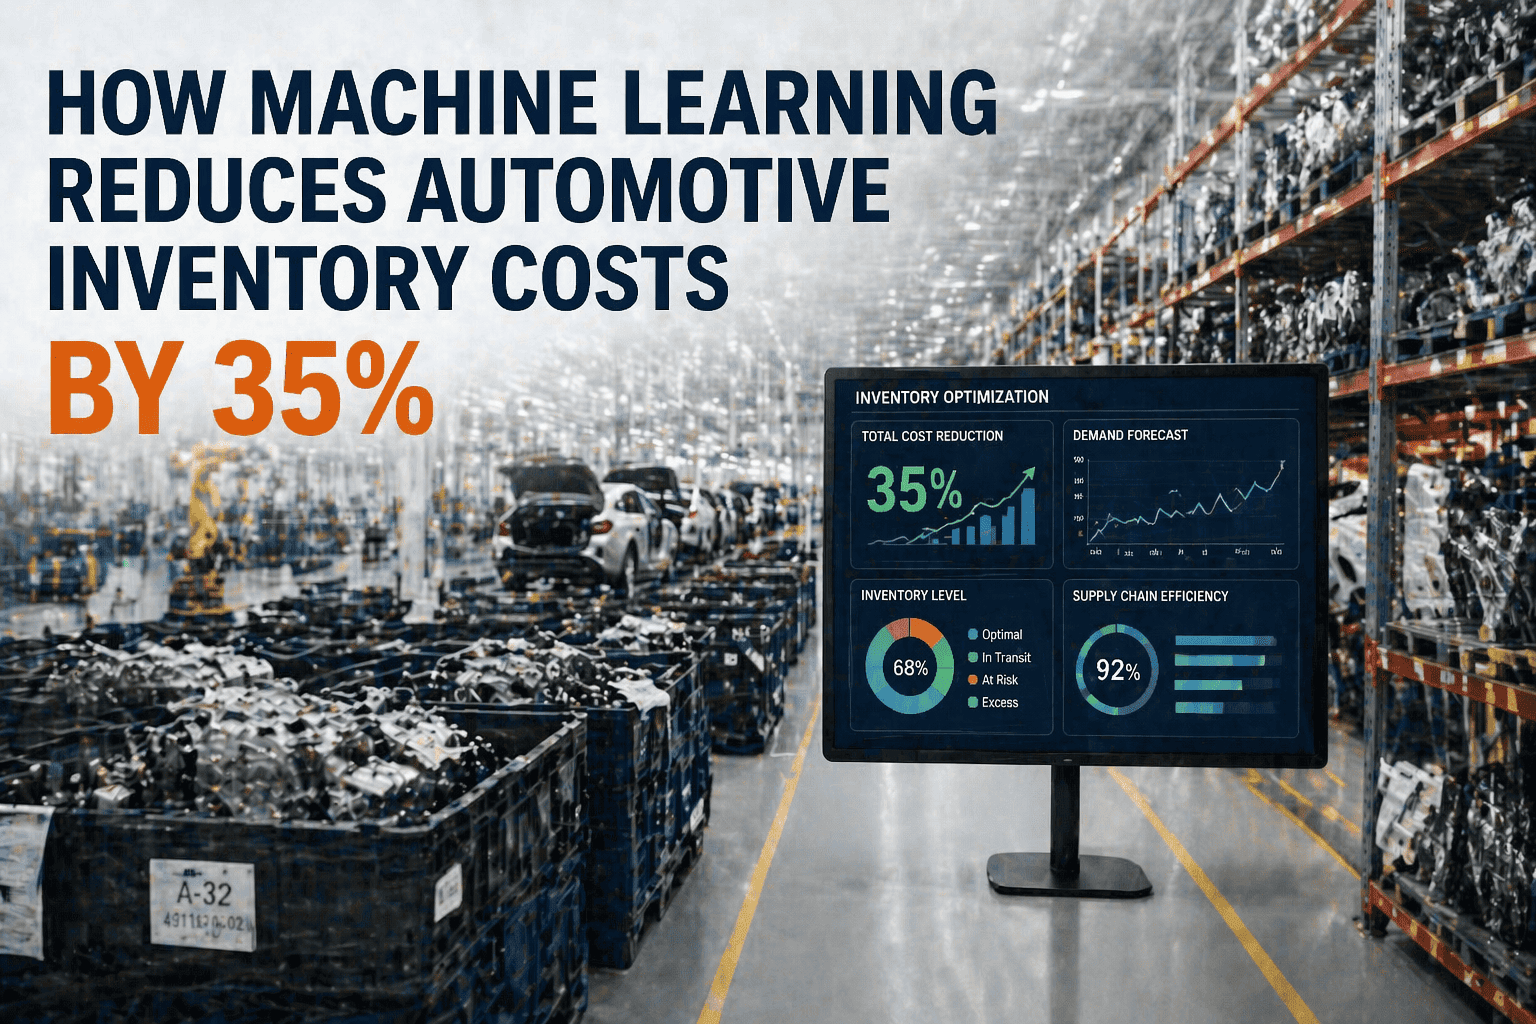
Machine Learning Reduces Automotive Inventory Costs by 35%
35%
Average inventory cost reduction through ML optimization
$3.5M
Average annual supply chain cost savings per plant
25%
Inventory turnover improvement reducing storage footprint
6 wks
ROI realization timeline from ML deployment to measurable results
Critical Automotive Inventory Management Challenges
Automotive manufacturers managing global supply chains experience inventory cost challenges directly impacting profitability where traditional demand forecasting and inventory optimization approaches fail capturing complex relationships between demand variability, supplier lead time uncertainty, and production scheduling constraints.
01
Inaccurate Demand Forecasting and Safety Stock Overages
Traditional demand planning approaches using manual statistical analysis, fixed seasonality indices, and judgment overrides miss demand variability drivers including new product launches, promotional activities, competitive market shifts, and customer demand changes. Planners compensate for forecast inaccuracy maintaining excessive safety stock consuming working capital while creating inventory carrying costs estimated at 15-25% of total component value annually including storage facility costs, material handling labor, inventory obsolescence, and working capital financing charges. Inventory excess creates stockouts elsewhere as components compete for limited storage capacity and capital allocation.
02
Supplier Variability and Lead Time Uncertainty
Single-source suppliers, geographic concentration, and geopolitical disruptions create lead time variability where suppliers ranging from 4-week to 16-week replenishment cycles require different inventory strategies but are managed with uniform policies. Supplier quality variations, capacity constraints during demand spikes, and unplanned disruptions (labor actions, facility damage, transportation delays) force inventory buffers compensating for uncertainty rather than adapting safety stock to actual supplier performance. Traditional policies treating all suppliers identically waste working capital on low-risk suppliers while exposing plants to stock-outs for high-risk suppliers.
03
Slow-Moving Inventory and Obsolescence Accumulation
New product introductions, engineering changes, and platform rationalization create slow-moving components and obsolete inventory lacking demand signals or replenishment activity. Traditional inventory management approaches lack early warning mechanisms identifying components transitioning from active to slow-moving status enabling proactive inventory reduction before obsolescence occurs. Inventory carrying costs continue accumulating on slow-moving items long after demand has declined, consuming capital and storage space while reducing inventory turnover and working capital efficiency.
04
Supply-Demand Mismatch and Production Schedule Coordination
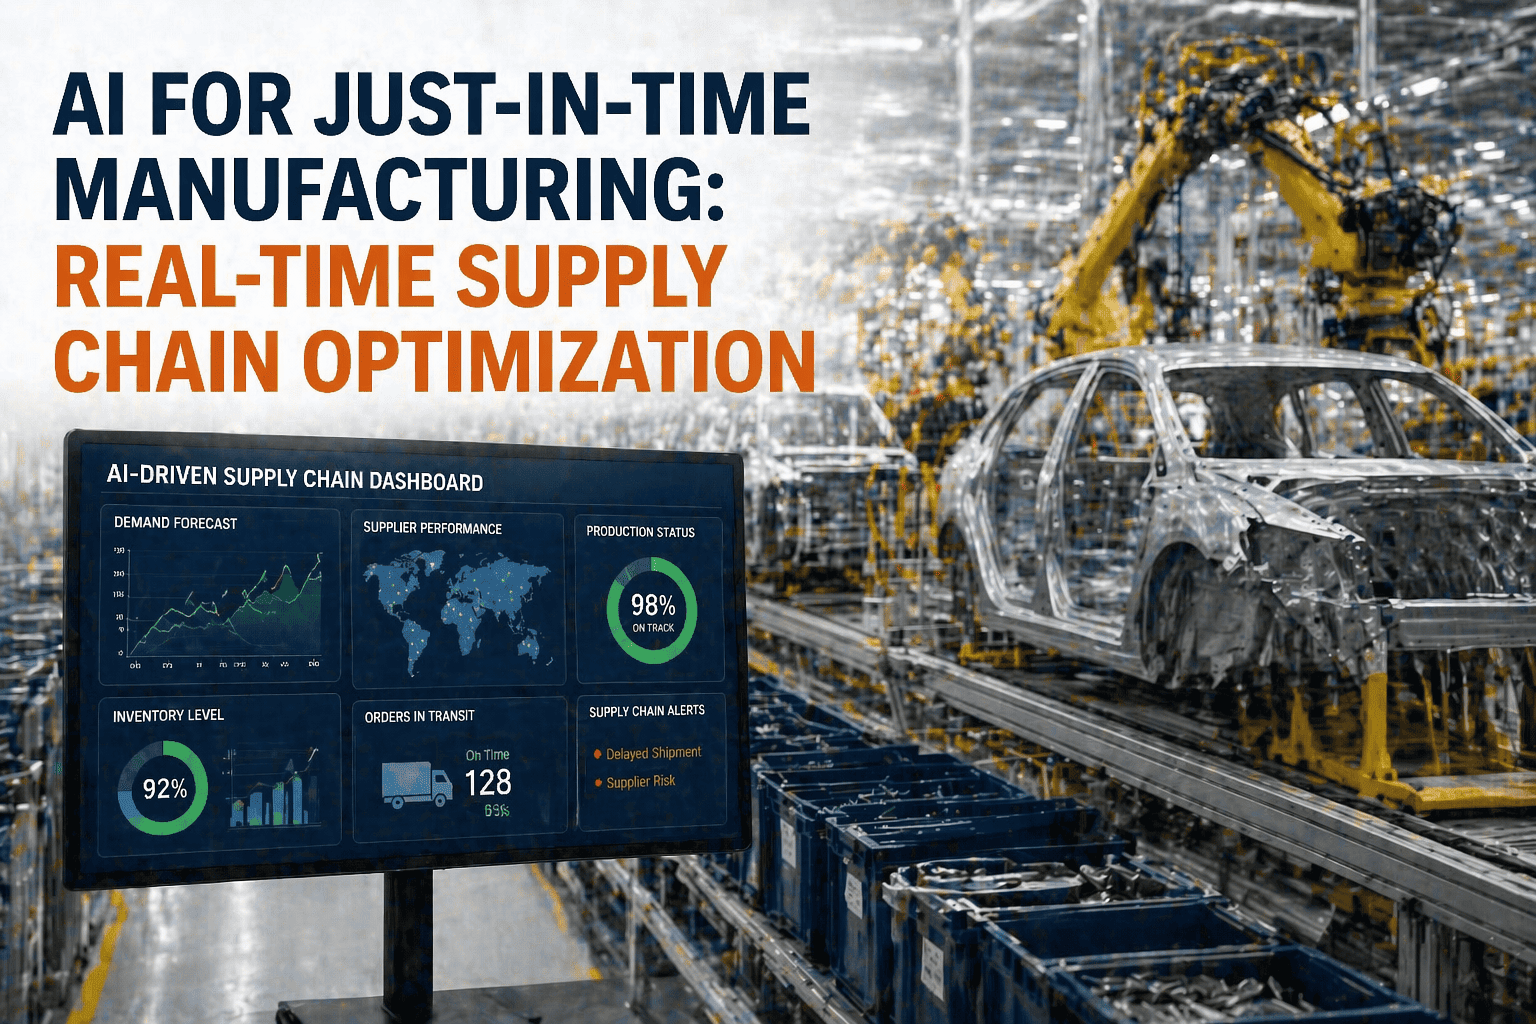
Demand forecasts generated independently from production schedules create timing mismatches where supply arrives at warehouse locations disconnected from actual production pull creating excess inventory at some locations while shortages occur elsewhere. Manual coordination between demand planning, production scheduling, and procurement functions fails synchronizing material arrival with production consumption. Just-in-time implementation requires precise timing that demand variability and supplier uncertainty undermine without automated response mechanisms.
05
Inventory Carrying Cost Increase of 113% Since 2019
Combined impacts of inflation, labor cost escalation, storage facility expansion, and increased working capital carrying costs have raised inventory holding costs approximately 113% since 2019. Component costs have increased 35-45% during the same period while production volumes remained relatively flat, creating working capital pressure where traditional inventory policies consume disproportionate cash tied up in safety stock and excess materials. Supply chain disruptions from pandemic, geopolitical tensions, and logistics challenges have extended lead times 30-50% requiring larger inventory buffers consuming additional carrying costs.
06
Global Inventory Carrying Cost of $880 Billion Annually
Automotive industry globally maintains approximately $2.2 trillion in supply chain inventory at any given time with carrying costs consuming approximately $330-440 billion annually (15-20% of inventory value). Individual manufacturers with $500 million annual material spending and 12-week average inventory cycles carry $1.15 billion in active inventory at any time, with carrying costs consuming $172-230 million annually. Machine learning optimization capturing even 1-2% inventory reduction translates directly to $11.5-23 million annual working capital improvement and cash flow impact for mid-size automotive manufacturers.
How Machine Learning Solves Automotive Inventory Cost Challenges
Machine learning algorithms analyzing historical demand patterns, supplier performance metrics, production scheduling constraints, and external market signals optimize inventory decisions automatically adapting to changing conditions, eliminating manual forecast adjustments, and implementing demand-responsive inventory strategies. Book a Demo to see machine learning demand forecasting achieving 20-30% forecast accuracy improvement over traditional methods.
01
Advanced Demand Forecasting with Multivariate Pattern Recognition
Machine learning models analyze multi-year demand history, seasonal patterns, promotional calendar impacts, competitor activities, macroeconomic indicators, and customer order patterns identifying relationships manual forecasting cannot detect. Gradient boosting and neural network models achieve 20-30% forecast accuracy improvement over statistical baselines capturing demand nonlinearity, interaction effects, and regime changes. Real-time forecast updates incorporating latest sales data, market signals, and production changes enable responsive planning versus static monthly forecasts disconnected from current conditions.
02
Supplier Risk Scoring and Lead Time Prediction
Machine learning models quantify supplier reliability incorporating on-time delivery history, quality performance, capacity utilization, financial stability, geopolitical exposure, and natural disaster risk. Lead time forecasting models predict actual replenishment cycles accounting for supplier variability, seasonal effects, and demand spike impacts enabling differentiated inventory strategies by supplier risk level. High-risk suppliers receive additional safety stock and dual-sourcing strategies while low-risk suppliers reduce inventory buffers reallocating working capital efficiently.
03
Dynamic Safety Stock Optimization and Reorder Point Automation
Machine learning automatically optimizes safety stock levels balancing service level targets against holding cost minimization, adapting continuously to demand volatility, supplier variability, and production constraint changes. Reorder points automatically adjust reflecting current lead times, demand patterns, and seasonal variations rather than fixed parameters. Inventory optimization algorithms determine economic order quantities accounting for actual carrying costs, supplier discounts, and production batch requirements improving both cost and service simultaneously.
04
Slow-Moving Inventory Detection and Lifecycle Management
Machine learning models identify inventory transitioning from active to slow-moving status weeks or months before demand completely disappears enabling proactive inventory reduction, supplier buy-back negotiation, or scrap decision before obsolescence occurs. Anomaly detection algorithms flag inventory with zero or declining demand trends recommending action items to planners. Early warning enables 30-50% reduction in obsolescence charges by identifying problems before they become write-offs.
05
Supply-Demand Synchronization and Production Schedule Integration
Machine learning correlates demand forecasts with production schedules optimizing material arrival timing to match production consumption patterns. Automated recommendations adjust supplier order timing, quantities, and delivery schedules maintaining just-in-time principles while adapting to demand variability. Cross-functional coordination algorithms synchronize demand planning, production scheduling, and procurement recommendations preventing supply-demand mismatch.
06
ERP/MES Integration and Automated Inventory Replenishment
Machine learning systems integrate with enterprise resource planning, manufacturing execution systems, and warehouse management platforms automating inventory replenishment decisions without manual planner intervention. Forecasts automatically feed production scheduling and procurement systems enabling supply chain responsiveness at machine speed. Inventory optimization recommendations automatically generate purchase orders, schedule supplier deliveries, and adjust safety stock parameters based on current conditions.
Reduce Inventory Carrying Costs 35% with Machine Learning
iFactory's machine learning platform optimizes your demand forecasting, inventory strategies, and supplier management delivering measurable working capital improvement and supply chain cost reduction within 6-8 weeks of deployment.
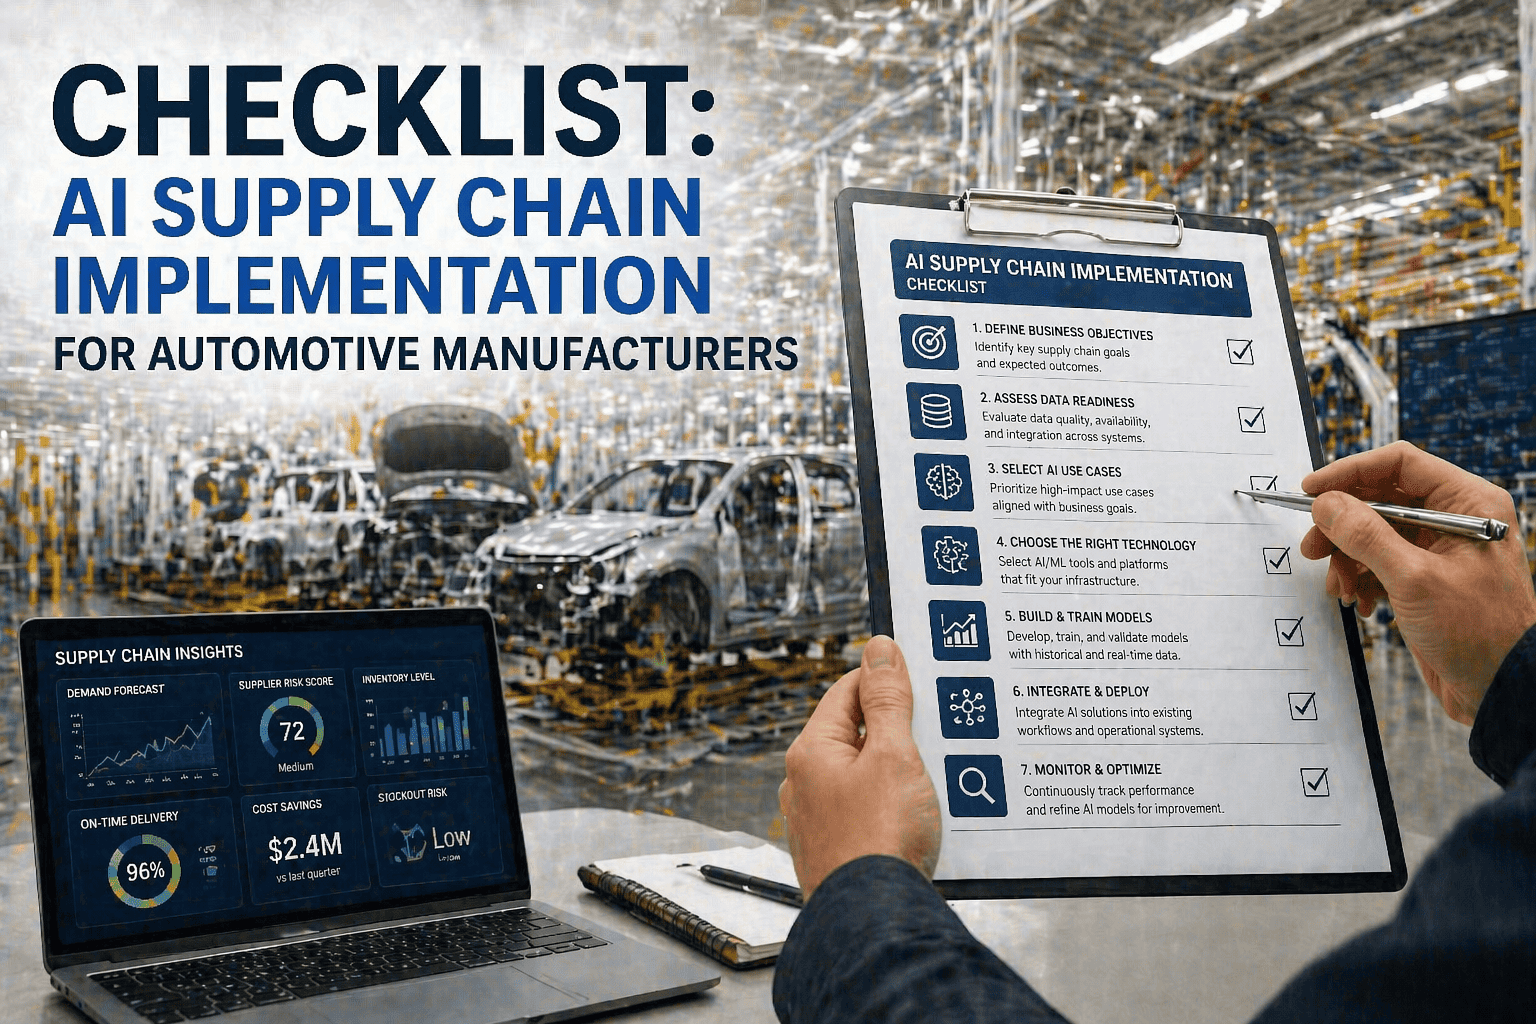
Machine Learning Implementation Roadmap
iFactory follows proven 6-stage deployment delivering ROI within 6-8 weeks and complete inventory optimization by week 8.
1
Data Assessment
Historical demand, supplier, inventory data audit
→
2
ERP Integration
Connection to demand, supplier, inventory systems
→
3
ML Model Training
Demand forecasting, inventory optimization models
→
4
Pilot Testing
Validation on subset of products and suppliers
→
5
Full Rollout
Complete inventory optimization across portfolio
→
6
Continuous Improvement
Ongoing model refinement and optimization
8-Week ROI Timeline for Machine Learning Inventory Optimization
iFactory deployments deliver measurable inventory cost reduction within 6-8 weeks with ongoing improvement as machine learning models refine predictions and optimization algorithms capture additional savings opportunities.
Weeks 1-2
Data Collection and Assessment
Audit historical demand data, supplier performance, and inventory records
Confirm data quality and identify integration requirements
Establish baseline inventory costs and KPI targets
Weeks 3-4
Model Development and Pilot Setup
Train demand forecasting and inventory optimization models
Validate model accuracy against baseline approaches
Begin pilot on 3-5 selected product families
Weeks 5-6
Pilot Results and Full Rollout
Measure pilot inventory cost improvement and forecast accuracy gains
ROI validation and executive approval for full deployment
Begin expanding to complete product portfolio
Weeks 7-8
Production Deployment and Optimization
Full machine learning inventory optimization live across portfolio
Continuous improvement and model performance refinement
Achieve complete ROI targets and document ongoing gains
ROI IN 6 WEEKS: MEASURABLE SAVINGS FROM WEEK 4
Facilities completing machine learning inventory optimization report average $520,000 in inventory cost reduction and working capital improvement within first 6 weeks of full system deployment with inventory turnover improvements validated by week 4 pilot performance.
$520K
Avg. savings in first 6 weeks from inventory optimization
22-35%
Inventory cost reduction by week 8 full deployment
$3.5M
Long-term annual supply chain cost reduction per plant
Real-World Machine Learning Inventory Optimization Results
These outcomes reflect machine learning deployments at operating automotive manufacturing facilities across North America, Europe, and Asia. Results demonstrate consistent inventory cost reduction, forecast accuracy improvement, and working capital optimization.
Case Study 01
Demand Forecasting Improvement at Mid-Size Automotive Assembly Plant
A 12,000-unit-per-month automotive assembly plant deployed machine learning demand forecasting replacing manual statistical forecasts generated weekly by demand planning team. Legacy system achieved 68% forecast accuracy (MAPE) with demand spikes and new model introductions creating 25-35% forecast errors. Machine learning models incorporating promotional calendars, competitor activity, customer order patterns, and macroeconomic indicators achieved 88% forecast accuracy improvement. Reduced forecast error enabled safety stock reduction from $24.5 million to $17.8 million inventory value while maintaining 99.2% service level compliance.
88%
Forecast accuracy improvement from legacy 68% baseline
$6.7M
Annual inventory carrying cost reduction from improved accuracy
27%
Overall inventory cost reduction while improving service levels
Case Study 02
Supplier Risk Assessment and Safety Stock Optimization
A global automotive supplier network managing 800+ active suppliers faced challenge of uniform safety stock policies allocating 15% inventory buffer across all suppliers regardless of reliability differences. Machine learning supplier risk models analyzing on-time delivery history, quality performance, capacity utilization, and geopolitical exposure identified 120 high-risk suppliers (8-week lead time uncertainty), 580 medium-risk suppliers (4-week variability), and 100 low-risk suppliers (minimal disruption history). Differentiated safety stock policies reduced high-risk supplier buffers to 22% maintaining service levels while decreasing low-risk supplier buffers to 8% recognizing actual reliability. Portfolio-level inventory optimization reduced total safety stock by $8.2 million while improving service levels through focused risk mitigation.
800+
Suppliers analyzed with differentiated risk classifications
$8.2M
Annual inventory carrying cost reduction from differentiated policies
31%
Overall inventory optimization from supplier risk-based strategies
Case Study 03
Slow-Moving Inventory Detection and Obsolescence Reduction
An EV battery component supplier managing 3,200 SKU portfolio experienced $4.8 million annual obsolescence charges from slow-moving and discontinued components lacking early detection and proactive management. Machine learning anomaly detection models analyzing demand patterns, inventory turnover, and age of inventory identified 280 components trending toward slow-moving status and 420 discontinued components still in inventory within 6-8 weeks versus traditional quarterly reviews discovering problems too late. Early warning enabled supplier negotiations recovering 35% of discontinued component value, expedited scrap processing saving 45% in carrying costs during wind-down, and prevented future obsolescence through production planning adjustments. First-year obsolescence reduction of $1.8 million with ongoing prevention of $2.1 million annual obsolescence expense.
700
Slow-moving and obsolete items identified early from 3,200 SKU portfolio
$3.9M
Total first-year obsolescence reduction and prevention value
35%
Value recovery through early supplier negotiations on discontinued items
Regional Machine Learning Deployment Considerations
| Region |
Inventory Challenges |
Supply Chain Dynamics |
ML Optimization Approach |
| United States |
Aging legacy ERP systems, labor cost inflation driving automation, just-in-time manufacturing complexity, supplier geographic concentration |
8-12 week lead times for domestic suppliers, demand volatility from model-specific customer requirements, regional supply chain disruption history |
Machine learning models capture complex supplier relationships, demand seasonality across vehicle segments, working capital optimization for large inventory carrying costs |
| United Kingdom |
Post-Brexit supply chain complexity, reduced supplier base, cross-border logistics delays, higher carrying costs from extended lead times |
12-16 week lead times for EU suppliers, tariff/customs impacts on ordering decisions, inventory buffers for logistics unpredictability |
ML models incorporate tariff scenarios, customs delay prediction, supplier diversification analysis enabling tactical inventory responses to trade dynamics |
| United Arab Emirates |
Free trade zone logistics complexity, regional supplier capacity constraints, extreme heat affecting storage, rapid production scaling |
4-8 week lead times from Asian suppliers, fluctuating local demand, storage costs from climate control requirements, regional capacity bottlenecks |
ML demand prediction for rapidly expanding regional operations, inventory policies adjusted for heat-sensitive components, supplier capacity constraint incorporation |
| Canada |
Seasonal production fluctuations, cross-border trade with US, weather-related logistics disruptions, inventory financing costs from extended cycles |
6-10 week lead times with seasonal variation, winter logistics challenges, demand correlation with US automotive cycles, small supplier base |
Seasonal demand models, weather-triggered inventory adjustments, cross-border supply chain coordination, dual-sourcing risk management |
| Europe |
Complex multi-country regulations, diverse supplier base across regions, labor cost variability, circular economy inventory requirements |
6-12 week lead times varying by geography, multiple local regulations, intra-Europe supply chain complexity, end-of-life inventory management |
ML models incorporate regional compliance variability, multi-language demand signal processing, circular economy inventory lifecycle management |
iFactory vs. Competitor Inventory Optimization Platforms
| Platform |
ML Forecasting |
Inventory Optimization |
ERP Integration |
Deployment Speed |
Cost Reduction |
| iFactory |
Advanced ML models with 20-30% accuracy improvement, real-time learning and adaptation |
Dynamic safety stock, reorder point automation, supplier risk-based policies |
Native SAP, Oracle, Infor integration, automated data syncing, zero manual intervention |
8-week fixed deployment, ROI validated in week 4 pilot |
22-35% inventory cost reduction with service level improvement |
| Demand Solutions (now Blue Yonder) |
Statistical forecasting with limited ML, slow model updates quarterly or annually |
Fixed safety stock calculation without dynamic adjustment, basic EOQ logic |
Complex integration requiring 4-6 months professional services |
12-18 months full deployment with continuous integration work |
8-15% inventory reduction, limited to forecast accuracy gains only |
| Kinaxis RapidResponse |
Basic statistical methods, weak ML capability, requires expert model configuration |
Scenario simulation without optimization, manual what-if analysis burden |
Generic integration approach, requires extensive customization and consulting |
6-12 months deployment, significant internal resource requirements |
10-18% benefit from scenario planning visibility only |
| QAD Redzone |
No ML forecasting, reactive alerts only, manual analysis required |
Basic inventory management without optimization, static policies |
Qad-specific, difficult integration with non-QAD systems |
3-6 months for implementation, ongoing manual configuration |
3-8% from visibility only, no optimization capability |
| Oracle SCM Cloud |
Basic built-in forecasting, limited ML, requires Oracle AI Services upsell |
Standard ERP inventory module without specialized optimization |
Native Oracle integration, difficult with non-Oracle systems |
8-14 months full deployment, high implementation costs |
5-12% from standard ERP capabilities, requires AI module purchase |
Frequently Asked Questions About Machine Learning Inventory Optimization
How quickly can we expect to see inventory cost reduction from machine learning implementation?
Facilities typically observe measurable inventory cost reduction beginning in week 4 of pilot deployment with 4-8% improvement from forecast accuracy gains alone. Full deployment by week 8 typically delivers 22-35% total inventory cost reduction as dynamic safety stock optimization, slow-moving inventory detection, and supplier risk-based policies accumulate benefits.
Book a Demo to review expected timeline for your specific supply chain.
How does machine learning handle demand seasonality and promotional impacts?
Machine learning models incorporating multi-year historical data identify seasonal patterns automatically and learn promotional calendar impacts from past events. Models adjust demand predictions when promotions are scheduled and refine predictions as actual promotional performance becomes available. External market signals and competitor activity enhance seasonal pattern recognition improving accuracy across product categories with different seasonality profiles.
Can machine learning inventory optimization work with our existing ERP system?
Yes. iFactory integrates with SAP, Oracle, Infor, Microsoft Dynamics and other enterprise systems via standard APIs without requiring ERP replacement or major system overhauls. Integration typically completes within 2-3 weeks requiring minimal IT involvement. Machine learning outputs automatically feed back into ERP systems for purchase order generation and inventory replenishment without manual intervention.
Talk to Support about your specific ERP environment.
How does machine learning accommodate supply chain disruptions and supplier failures?
Machine learning supplier risk models incorporate on-time delivery history, quality performance, capacity utilization, financial stability, and geopolitical exposure scoring supplier reliability. When suppliers fall outside expected performance ranges, models automatically increase safety stock and alert procurement to activate contingency suppliers. Continuous learning enables models to adapt to changing supplier situations and emerging risks enabling proactive rather than reactive disruption response.
What training do procurement and planning teams need for machine learning systems?
iFactory provides comprehensive training covering system operation, forecast interpretation, inventory recommendation evaluation, and exception handling. Training emphasizes that machine learning augments planner expertise rather than replacing it, with human oversight for unusual situations or business changes. Most organizations require 2-3 weeks training with ongoing support for nuanced decision-making and continuous improvement participation.
How do we measure actual inventory savings and validate the machine learning impact?
iFactory provides continuous tracking of inventory metrics including average inventory value, inventory turnover rate, carrying costs, stockout frequency, and forecast accuracy. Baseline metrics established before deployment enable direct comparison isolating machine learning contribution from other supply chain changes. Weekly and monthly dashboards show inventory trends, cost savings accumulation, and forecast improvement enabling stakeholder confidence in delivered value.
Reduce Automotive Inventory Costs by 35% with Machine Learning
iFactory's machine learning platform optimizes demand forecasting, inventory strategies, and supplier management delivering $2.8-4.2 million annual supply chain cost reduction per mid-size automotive facility. Deploy in 8 weeks with ROI validated in week 4.
35% inventory cost reduction proven
22-35% safety stock optimization
20-30% forecast accuracy improvement
$3.5M average annual savings per plant