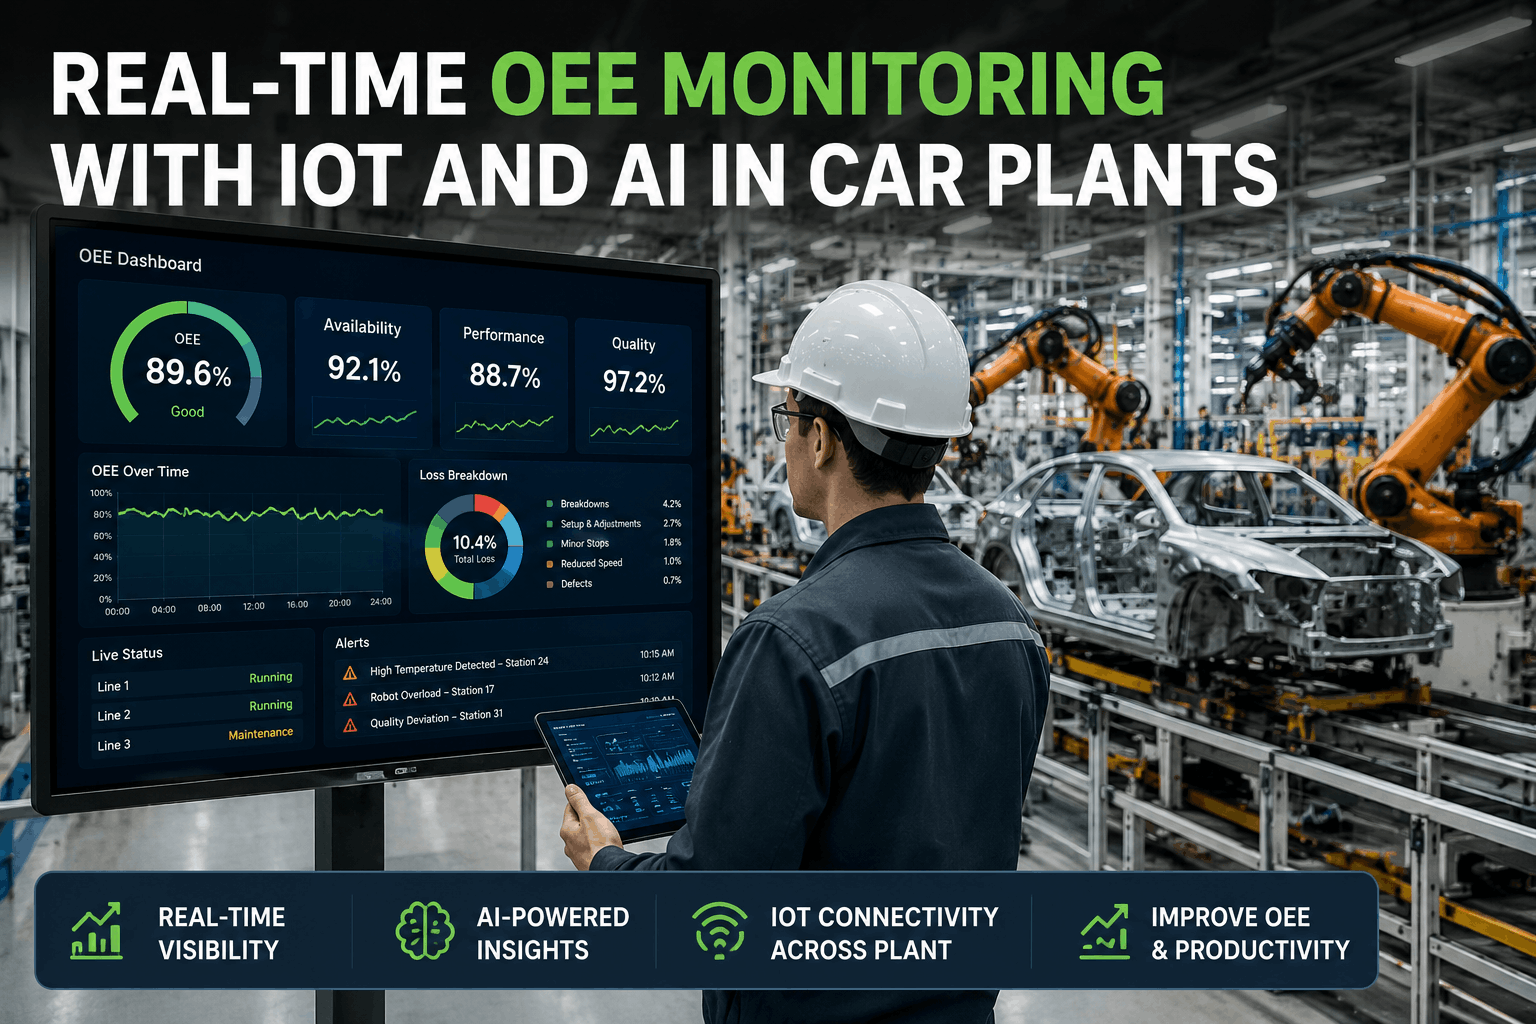
Real-Time OEE Monitoring With IoT and AI in Car Plants

By Tom Walker on May 29, 2026

real-time-oee-monitoring-with-iot-and-ai-in-car-plants

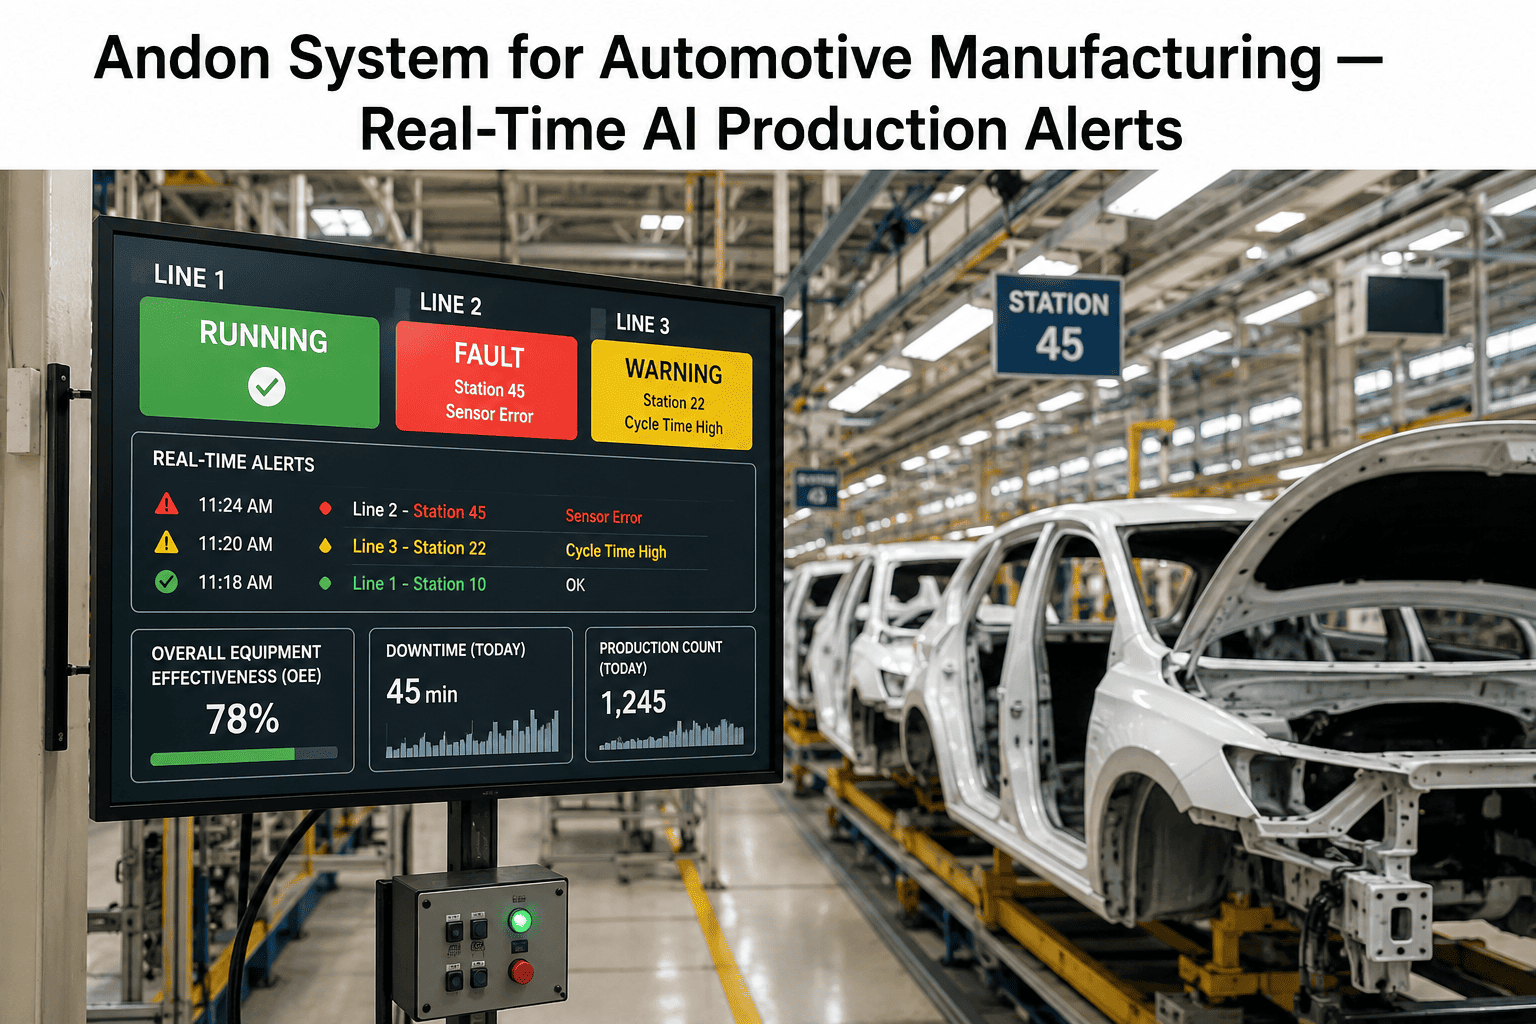
Automotive manufacturing plants currently average 55–65% OEE — against a world-class benchmark of 85%. That gap isn't a knowledge problem. Plant managers know their lines are underperforming. The problem is visibility: by the time traditional OEE reports land on a manager's desk, the shift that caused the losses is already over. The decisions that could have recovered 2–3 hours of production value happened hours ago, without the data needed to make them correctly. Real-time OEE monitoring — powered by IoT sensors and AI — closes that gap. It turns OEE from a lagging scorecard into a live operational tool that tells operators what is going wrong, why it is going wrong, and what to do about it — while there is still time to act. Book a demo to see iFactory's real-time OEE monitoring live on automotive production data.

IoT & Industry 4.0
Real-Time OEE Monitoring With IoT and AI in Car Plants
Automotive plants average 55–65% OEE. World-class is 85–92%. The gap between them isn't equipment — it's visibility. Real-time IoT and AI closes it.
55–65%
average automotive OEE — vs. 85–92% world-class target
15–25 pts
OEE gain within year one — iFactory deployment data
3–5 days
to go live on a single production line with plug-and-play IoT gateways

The OEE Gap in Automotive Manufacturing Is Not an Equipment Problem

Only 3% of manufacturers consistently achieve 85%+ OEE. For automotive plants, the world-class target is even higher — 85–92% for assembly operations. The distance between average (60%) and excellent (85%) represents a staggering amount of recoverable production value. At a typical automotive final assembly line running at $2.3M per hour, a 10-point OEE improvement translates to $15–20M in annual recovered throughput — without adding a single machine, operator, or shift.

OEE Benchmark: Where Automotive Plants Actually Stand
World-Class Target (Automotive)
85–92%
Target
Top Quartile Automotive Plants
78–82%
Good
Industry Average (Automotive)
55–65%
Average
Plants Without Real-Time Monitoring
45–55%
At Risk
Sources: TeepTrak Automotive OEE Benchmark Report 2024 (450+ facilities) · iFactory OEE Analytics Data 2026 · Tractian 2026

The problem is not that plants lack OEE data — most already have some form of tracking. The problem is that data arrives too late to act on. Basic digital OEE systems report dashboards that lag by hours. Teams react to yesterday's problems. By the time a downtime pattern is identified in a weekly report, it has already cost 3–4 shifts of recoverable production. Real-time IoT and AI changes the fundamental timing of OEE visibility — from lagging to live. Talk to an iFactory OEE specialist about your current monitoring setup.

Understanding OEE: The Three Levers That Drive the Number

OEE is a single percentage — but it is not a single thing. It is the product of three independent drivers, and knowing the score alone tells you almost nothing about what to fix.

A
Availability
Actual Run Time ÷ Planned Production Time
Lost when machines stop unexpectedly — breakdowns, changeovers, material shortages, operator absence. The most impactful single lever in most automotive plants. IoT machine state monitoring captures every stop event automatically, classifies cause, and triggers alerts in real time.
Primary losses: Unplanned downtime, excessive changeover
P
Performance
Actual Output Rate ÷ Ideal Output Rate
Lost when machines run slower than designed — minor stoppages, reduced speed, operator-paced operations. Often invisible in traditional OEE tracking because no single event is large enough to trigger an alarm. AI identifies performance drift patterns in real time — the 3% speed reduction that alone costs 30 minutes per shift.
Primary losses: Minor stops, speed losses, idling
Q
Quality
Good Units ÷ Total Units Produced
Lost when production generates defects — startup scrap, rework, process-driven quality escapes. AI quality monitoring catches the upstream process signals that predict defects before they are produced, shifting intervention from end-of-line inspection to real-time process correction.
Primary losses: Scrap, rework, startup defects
OEE = Availability × Performance × Quality
90%Availability
×
95%Performance
×
99%Quality
=
84.6%OEE (World-class)
A plant at 60% OEE could be 70/90/95 (downtime crisis) or 90/90/74 (quality crisis) — the corrective action is completely different. Real-time IoT decomposition tells you which one you are facing right now.

The IoT + AI Architecture: How Real-Time OEE Works

Real-time OEE monitoring is not a single sensor or a dashboard upgrade — it is a data pipeline that connects every machine to an AI intelligence layer and delivers actionable insight to the right person at the right moment. Book a demo to see iFactory's IoT + AI architecture demonstrated on a live automotive plant.

Layer 1 — Data Collection
IoT Sensor & Machine Connectivity
PLC state signals (OPC-UA / Modbus) IoT vibration & current sensors SCADA data feeds Vision system outputs Manual operator inputs Energy meters
Plug-and-play IoT gateways connect legacy machines in hours. No PLC reprogramming required. Single line live in 3–5 days.

Layer 2 — Edge Processing
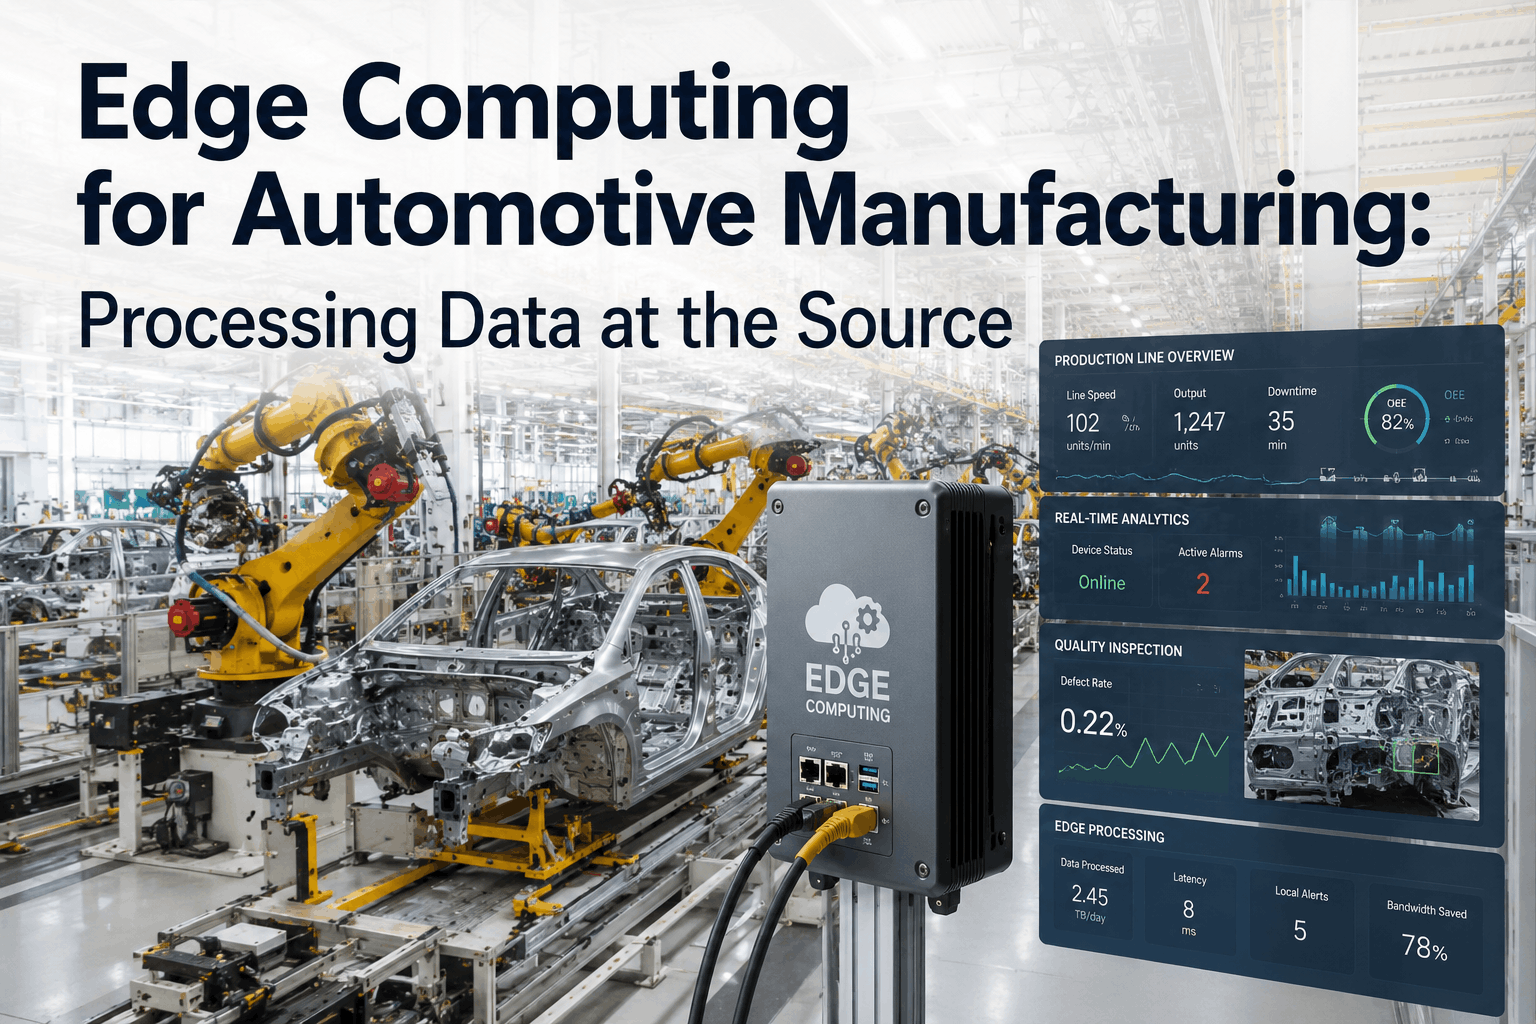
Real-Time AI Analysis at the Edge
Machine state classification (running / idle / fault) Automatic downtime cause categorisation Cycle time anomaly detection Quality signal correlation Six Big Losses assignment
AI classifies every event in milliseconds — eliminating manual downtime coding and the data entry errors that corrupt traditional OEE calculations.

Layer 3 — AI Intelligence
Predictive OEE & Root Cause Engine
Predictive OEE for next shift Root cause Pareto analysis Shift comparison & anomaly flagging Trend drift detection (Performance losses) Maintenance risk scoring
AI surfaces root causes automatically — Pareto charts, waterfall breakdowns, and shift comparisons delivered without analyst intervention.

Layer 4 — Action Layer
Operator Alerts, MES & ERP Integration
Real-time shop floor dashboards Shift manager mobile alerts MES downtime record updates SAP production order feedback CMMS maintenance work orders
Insights reach the operator before the shift ends — not in a weekly report. Actions happen while losses can still be recovered.

On-Premise or Cloud: iFactory Deploys Both Ways

On-Premise Deployment
For OEMs with data sovereignty & latency requirements
Pre-configured edge server installed at your plant
Production and OEE data never leaves your facility
Sub-100ms latency — real-time alerts without cloud round-trip
Supports IATF 16949 and customer cybersecurity requirements
Works on air-gapped OT networks if required
Discuss On-Premise Setup
Cloud Deployment
For suppliers and multi-plant visibility
Zero on-premise servers — production-ready in days
Multi-plant OEE benchmarking from a single dashboard
Automatic platform updates and AI model improvements
Scales from one line to 500+ facilities without infrastructure change
Secure OPC-UA and HTTPS connectivity to existing systems
Discuss Cloud Setup

The Six Big Losses: What AI Finds That Humans Miss

Every point of OEE you lose traces back to one of six specific causes defined in the TPM framework. Traditional tracking captures the obvious ones — the 2-hour breakdown that stops a line. AI finds the invisible ones — the cumulative 45 minutes per shift lost to minor stoppages that individually last under 5 minutes, never trigger an alarm, and collectively destroy Performance OEE.

Availability Losses
01
Unplanned Downtime
Equipment breakdowns, failures, and unplanned stops. Biggest single OEE lever in most automotive plants. IoT detects machine state change instantly; AI predicts failures 12–48 hours in advance.
Avg automotive impact: 8–12% OEE
02
Planned Stops & Changeover
Scheduled maintenance, tooling changes, product changeovers. AI scheduling optimises changeover sequence to minimise total time. SMED opportunities identified from IoT timing data automatically.
Avg automotive impact: 5–8% OEE
Performance Losses
03
Minor Stoppages & Idling
Sub-5-minute stops from jams, sensor faults, or material presentation issues. Individually invisible; collectively devastating. IoT captures every event; AI identifies recurring patterns that operators never see in aggregate.
Avg automotive impact: 4–7% OEE — most underreported
04
Reduced Speed
Machines running below ideal cycle time — operator-paced work, worn tooling, conservative speed settings. AI compares actual cycle time against ideal in real time and flags drift within minutes of onset.
Avg automotive impact: 3–5% OEE
Quality Losses
05
Startup Scrap & Rejects
Defects produced during line startup or after changeover. AI identifies the process parameter windows that predict startup scrap and guides operators to the correct settings before first-off inspection.
Avg automotive impact: 2–3% OEE
06
Production Rejects & Rework
Steady-state quality losses from process drift or incoming material variation. AI SPC monitors quality-relevant process parameters in real time and flags approaching out-of-control conditions before defects are produced.
Avg automotive impact: 2–4% OEE

KPI Impact: Real-Time IoT + AI OEE vs. Traditional Monitoring

OEE Improvement — First Year
Traditional batch OEE reporting
2–5 pts typical
Real-time IoT + AI (iFactory)
15–25 pts within year one
Time to Identify Downtime Root Cause
Manual investigation
Hours to days
AI root cause engine
<60 seconds
Availability Gain (Predictive Maintenance)
Reactive / preventive only
Baseline
IoT + AI predictive
12–18 pt availability gain (iFactory data)
Shift Report Preparation Time
Manual data entry & reporting
30–60 min per shift
Automated IoT reporting
Zero manual entry
Sources: TeepTrak Automotive OEE Benchmark Report 2024 · iFactory OEE Analytics Platform Data 2026 · Tractian Manufacturing Report 2026

iFactory Real-Time OEE: Platform Features

01
Universal Machine Connectivity
Plug-and-play IoT gateways connect PLCs, CNCs, robots, and legacy equipment via OPC-UA, Modbus, PROFINET, and direct sensor input — no PLC reprogramming, no production disruption.
02
Real-Time A × P × Q Decomposition
OEE computed from live data every second. Availability, Performance, and Quality tracked independently — so teams always know which lever to pull, not just what the score is.
03
AI Downtime Classification
Every stop event automatically classified into the Six Big Losses using AI — eliminating manual downtime coding, reducing human error in root cause data, and freeing operators from reporting tasks.
04
Predictive OEE Forecasting
AI forecasts next-shift OEE based on current equipment health, maintenance history, and production schedule — giving plant managers the window to intervene before the score drops.
05
Multi-Plant Benchmarking
Compare OEE, availability, and Six Big Losses across lines, shifts, plants, and regions from a single dashboard — identifying which plants have best practices worth replicating across the network.
06
MES & SAP Integration
OEE data, downtime records, and maintenance alerts feed directly into SAP, MES work orders, and CMMS systems — eliminating double data entry and connecting shop floor performance to enterprise systems in real time.

FAQ: Real-Time OEE Monitoring with IoT and AI

A single production line can go live in as little as 3–5 days with iFactory's plug-and-play IoT gateways — connecting to existing PLCs, CNCs, and sensors without programming changes. A full facility with multiple lines, SCADA integration, and custom dashboards typically completes in 2–4 weeks. Enterprise rollouts across multiple sites take 6–10 weeks. iFactory recommends tracking OEE for at least 30 days to establish an accurate baseline — many plants discover their actual OEE is 10–15% lower than assumed once properly measured with automated data collection. Book a demo to discuss the deployment timeline for your specific plant.

Yes. For machines without native digital outputs, iFactory's IoT gateway options include: current/voltage clamp sensors that detect machine run state from power consumption, vibration sensors mounted on the machine exterior, and photoelectric sensors detecting cycle completions at the output point. These non-invasive approaches capture machine state (running, idle, fault) for OEE Availability and Performance calculation without any modification to the machine or its control system. The most common scenario in automotive plants is a mix — modern PLCs connected via OPC-UA alongside older equipment connected via retrofit sensors. iFactory handles both in the same platform.

Both options deliver identical OEE analytics capabilities — real-time monitoring, AI root cause, predictive OEE, and multi-plant benchmarking. The difference is infrastructure location: on-premise deploys a pre-configured edge server inside your plant where OEE data never leaves your facility and latency is under 100ms for real-time alerts. Cloud requires no local servers, enables faster onboarding, and provides unified multi-plant dashboards across all facilities from day one. OEMs with OT cybersecurity requirements or data sovereignty obligations typically choose on-premise; Tier 1/2 suppliers and multi-site operations typically choose cloud. Both are production-proven and supported by the same iFactory team. Contact support to discuss which deployment fits your IT architecture.

Plants that make the switch from batch OEE reporting to real-time IoT + AI monitoring report OEE gains of 15–25 percentage points within the first year — without adding equipment, shifts, or headcount. The mechanism is not magic: it is the compounding effect of acting on losses in real time rather than discovering them in a weekly report. The availability gain from predictive maintenance alone typically delivers 12–18 percentage points on affected assets. For a plant at 62% OEE, reaching 77% represents roughly $8–12M in additional annual throughput value on a typical automotive final assembly line.

iFactory supports hybrid data collection — automated IoT and sensor data for connected machines, operator-entered data for manual processes, and MES-imported production counts for lines where MES is the data source. All three streams feed the same real-time OEE calculation and AI analysis engine. Operators can enter downtime reasons and quality counts from any device — tablet, kiosk, or mobile — with AI suggesting the most likely cause based on current machine state and historical patterns, reducing entry time from 3–5 minutes to under 30 seconds per event.
On-Premise & Cloud Available
Stop Reporting Yesterday's OEE. Start Recovering Today's Losses.
iFactory's real-time OEE platform connects every machine in your car plant via IoT and AI — delivering live A × P × Q visibility, automatic root cause, and predictive OEE forecasting. Available on-premise or cloud.
Real-Time OEE IoT Machine Connectivity AI Root Cause Predictive OEE On-Premise Deployment Cloud Deployment

Share This Story, Choose Your Platform!