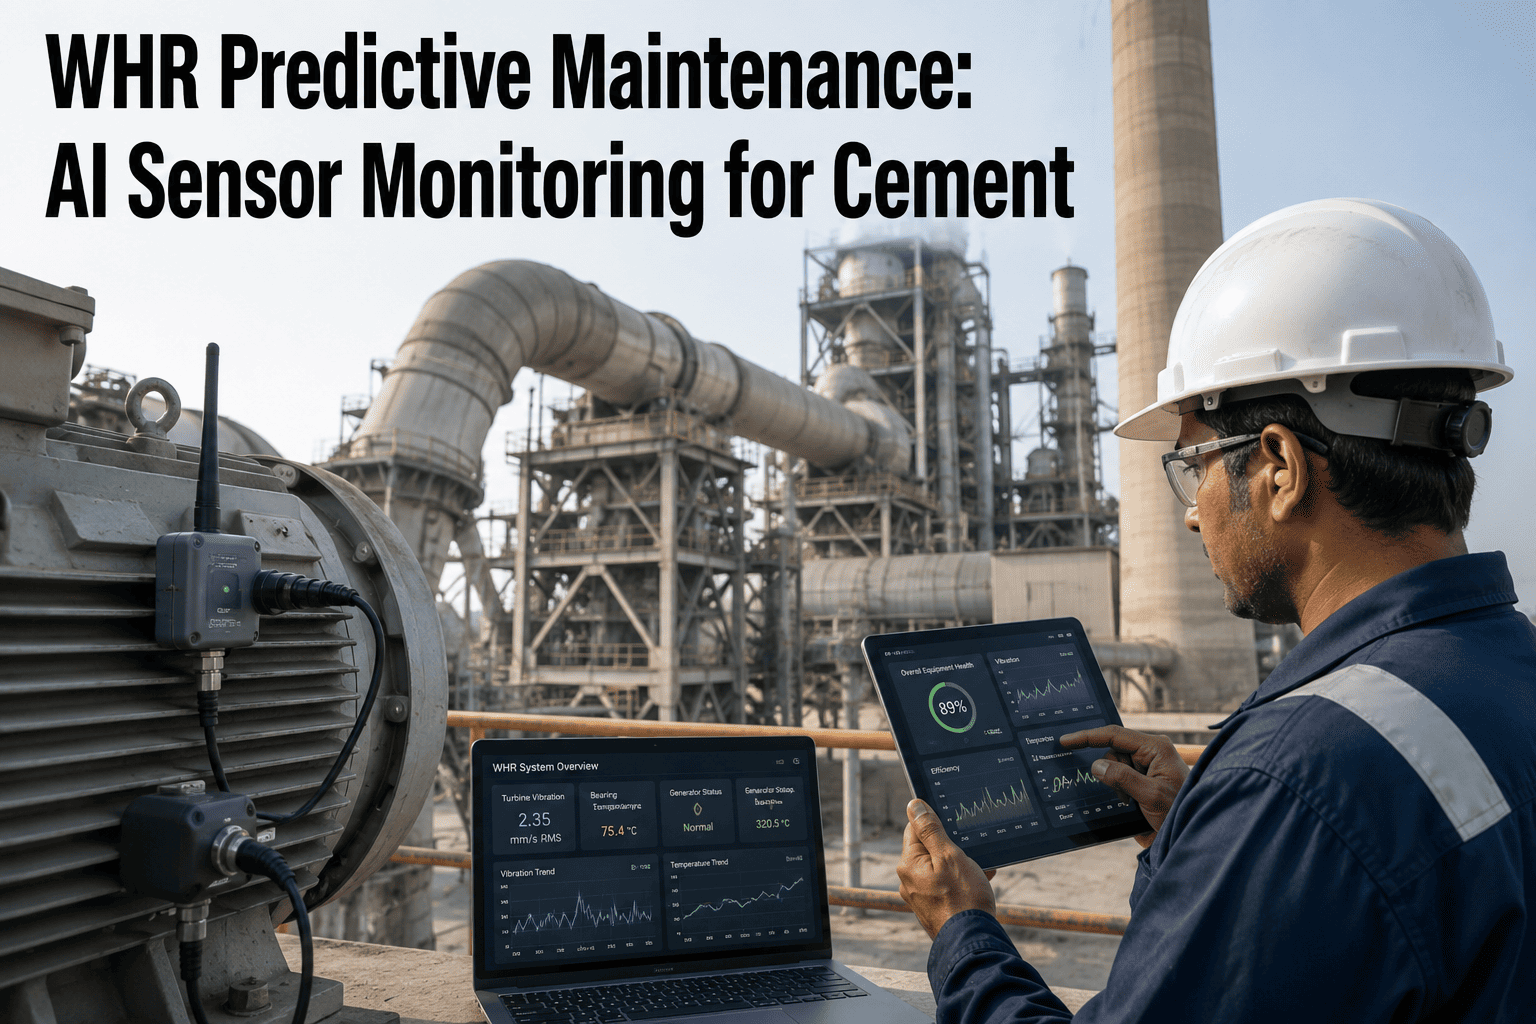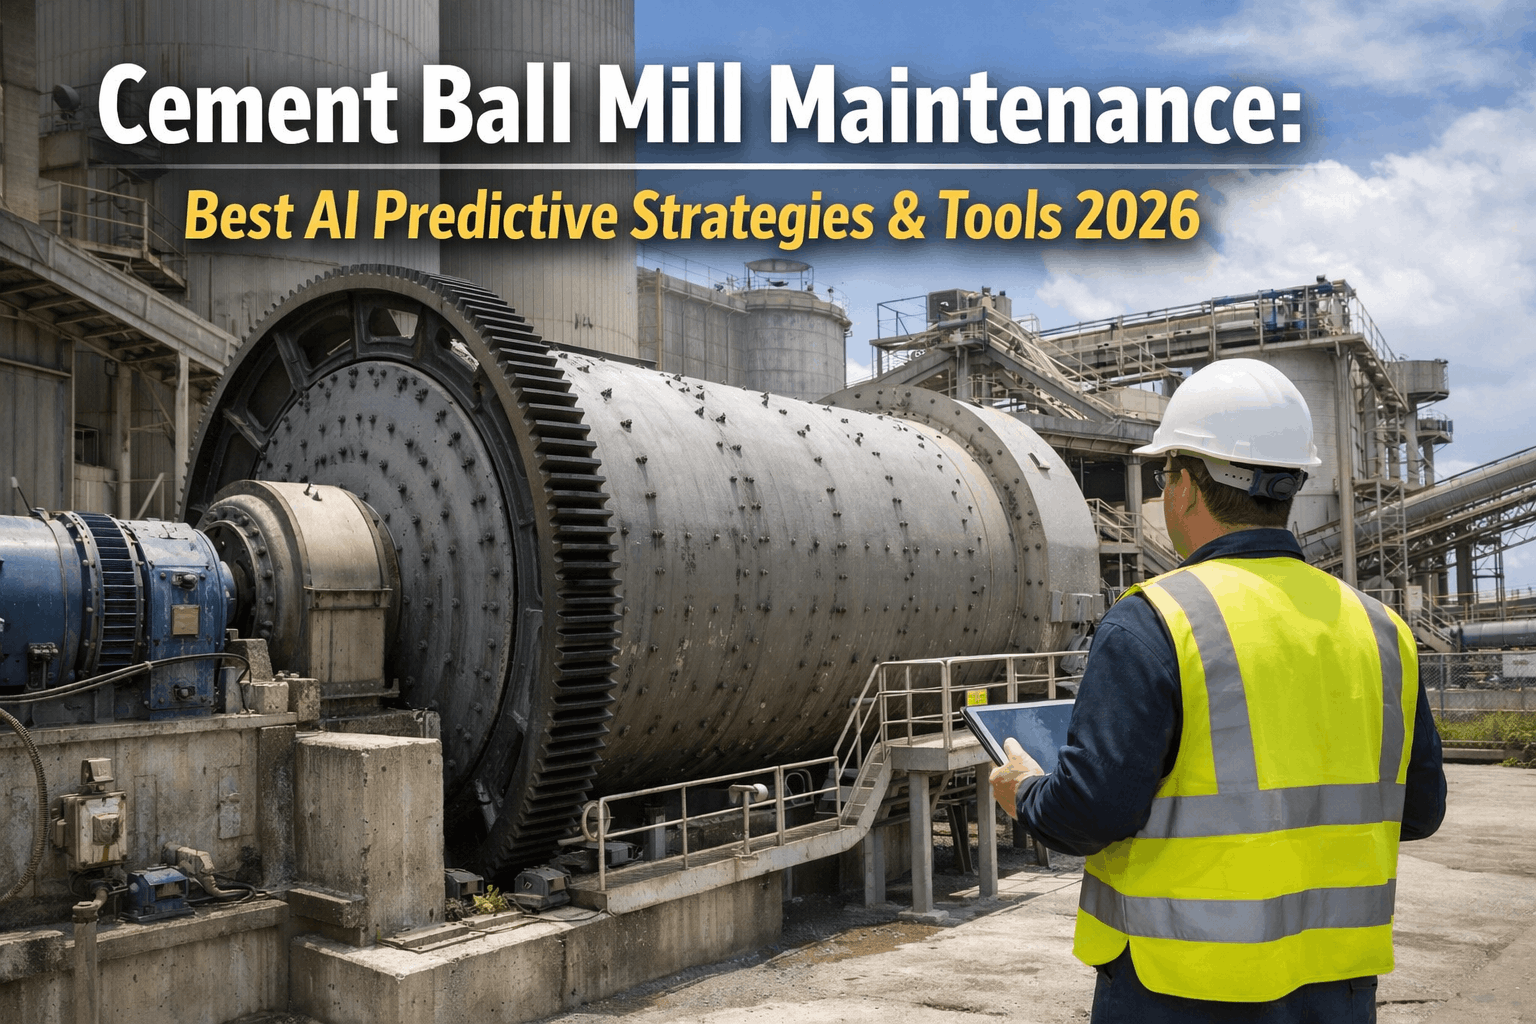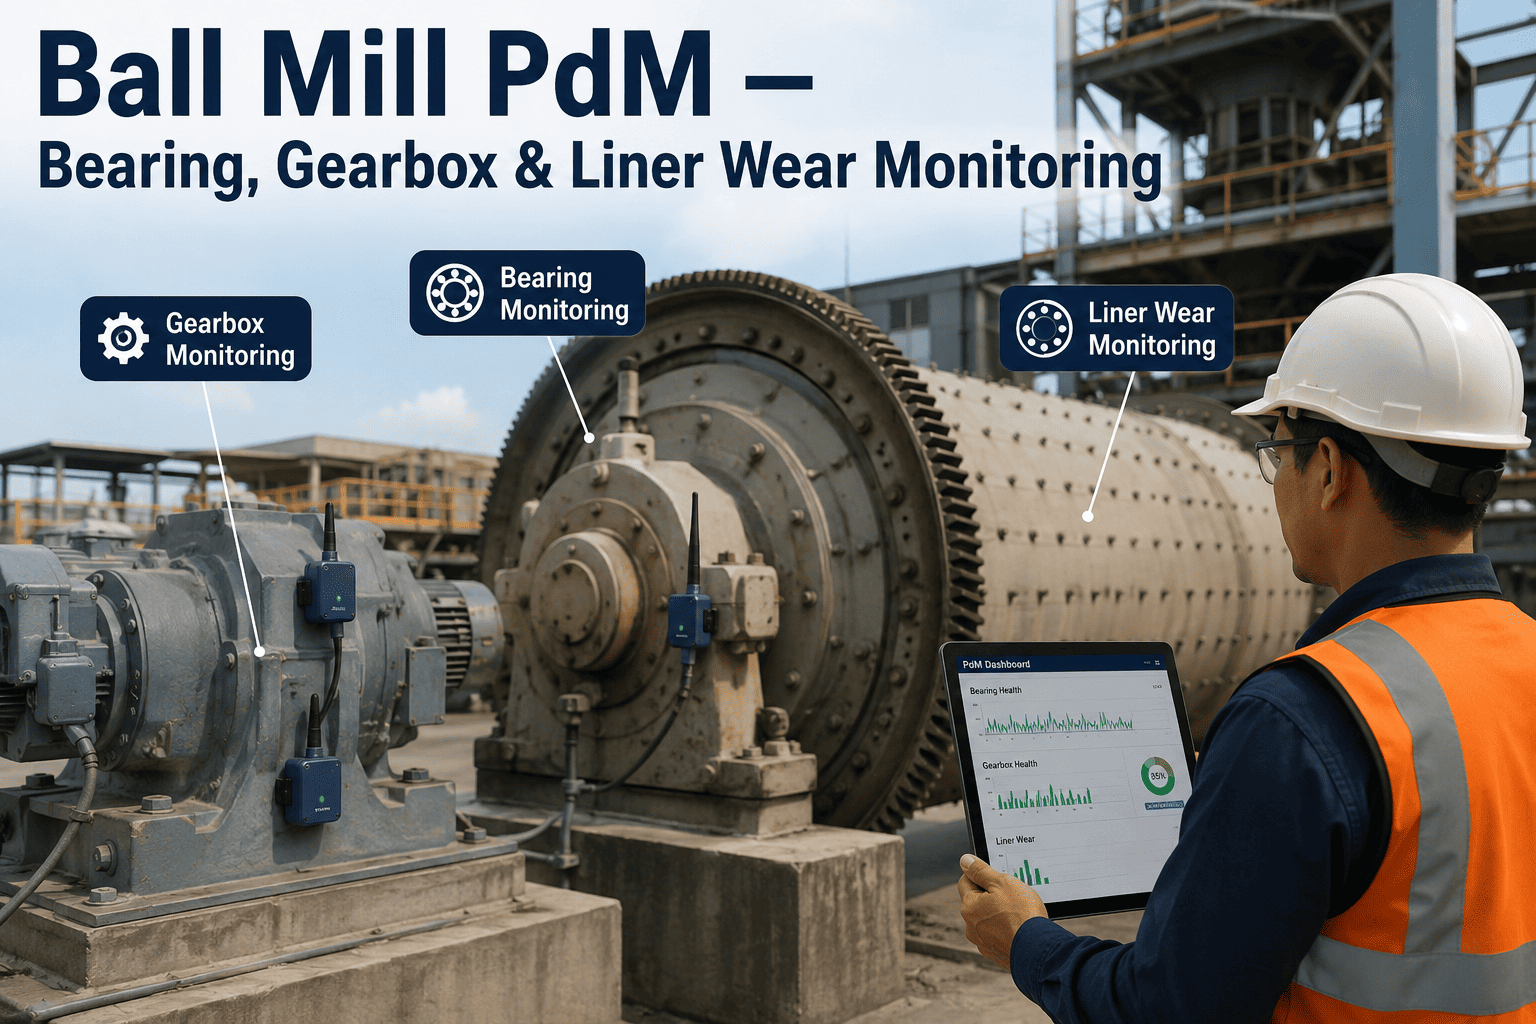
In the high-stakes world of cement manufacturing, the ball mill remains the beating heart of the grinding circuit, a massive rotating cylinder filled with steel balls that pulverize clinker into fine powder. Yet, this workhorse is also a source of catastrophic downtime when its critical components—trunnion bearings, gearboxes, and liners—begin to fail. Traditional time-based maintenance schedules are no longer sufficient; they either waste valuable component life or miss the subtle early warning signs that precede a breakdown. At iFactory, we have engineered a predictive maintenance suite that transforms raw sensor data into actionable intelligence, enabling plant managers and maintenance directors to shift from reactive repairs to proactive, data-driven decision-making. By deploying a multi-layered sensor network that captures bearing temperature and vibration, gearbox oil debris and spectral analysis, and liner wear profile via laser scanning, our system provides a comprehensive health dashboard for every ball mill in your plant. This guide will walk you through the technical nuances of each monitoring domain, the analytics that predict failure modes, and the optimization strategies that reduce energy consumption while extending equipment life. Book a Demo to see how iFactory can transform your mill maintenance program.
Transform Your Mill Maintenance Program
Leverage AI-driven predictive analytics to eliminate unplanned downtime and optimize grinding efficiency. See the iFactory platform in action.
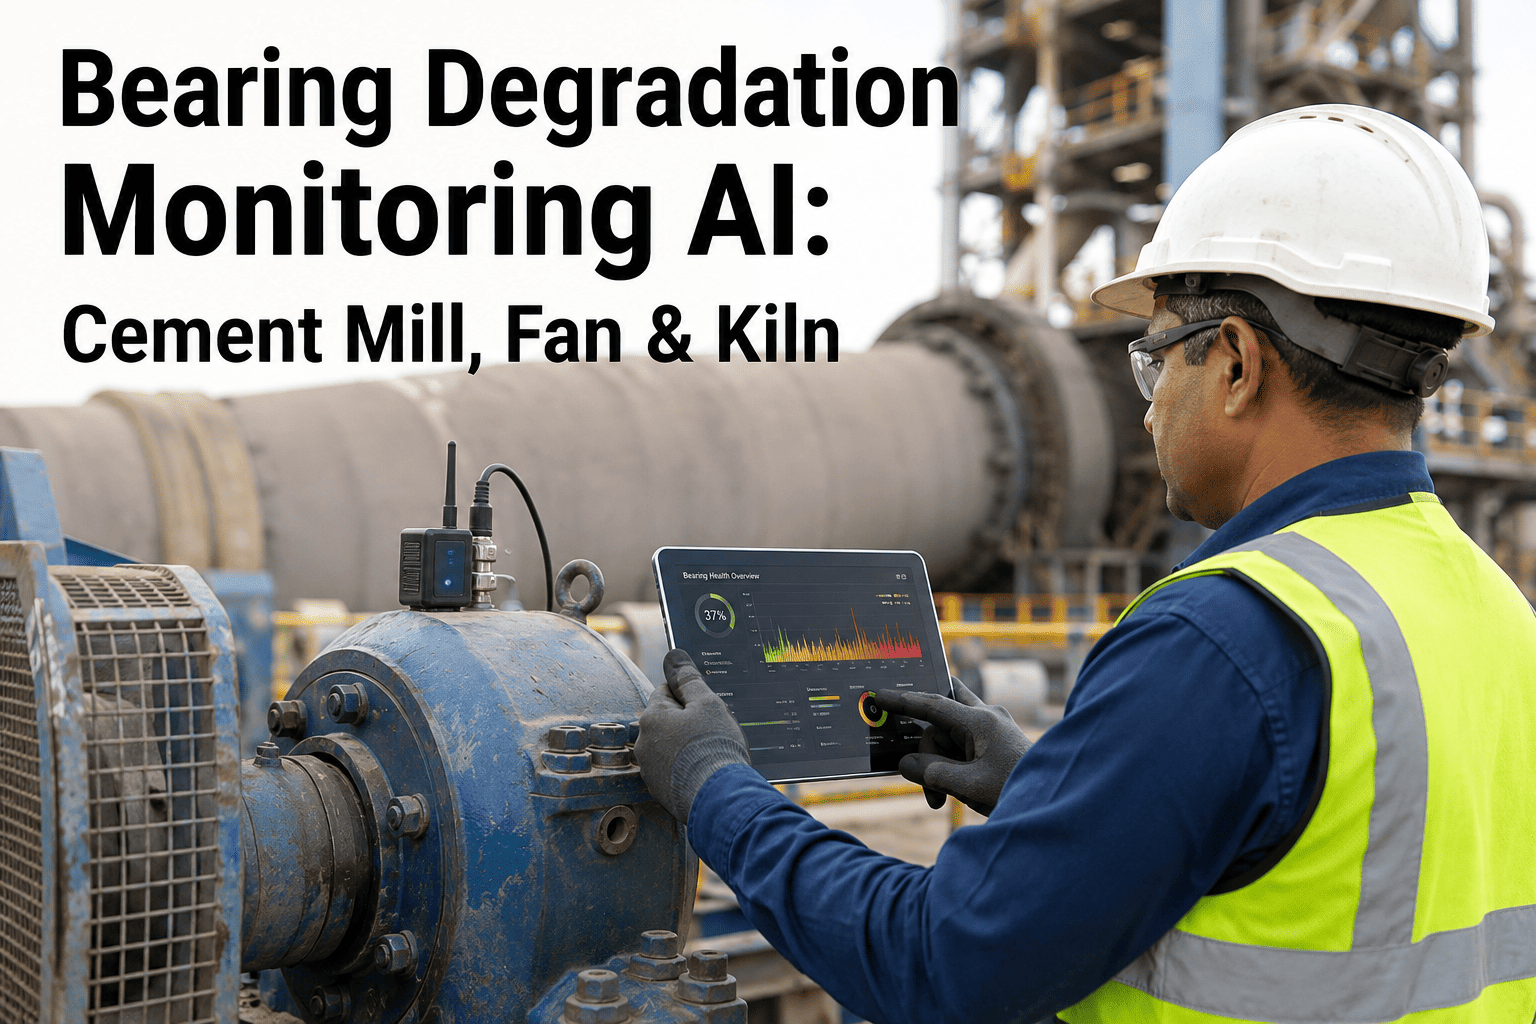
Trunnion Bearing Monitoring
Continuous temperature and vibration analysis to detect early-stage wear, misalignment, and lubrication failure. Our algorithms predict remaining useful life with >95% accuracy.
Gearbox Condition Monitoring
Oil debris analysis, spectral vibration, and thermal imaging identify gear pitting, bearing spalling, and shaft misalignment before they cause catastrophic failure.
Liner Wear Profile
3D laser scanning and ultrasonic thickness measurement map liner degradation in real time, enabling precise replacement planning and grinding media optimization.
Technical Architecture of Ball Mill PdM
An effective predictive maintenance system for ball mills requires a layered sensor architecture that captures data at the component level and integrates it into a unified analytics platform. At the bearing level, we deploy dual-mode sensors that measure both temperature (RTD PT100) and high-frequency vibration (accelerometers with 10 kHz sampling rate). These sensors are mounted on the trunnion bearing housings, both feed and discharge ends, to capture axial and radial vibrations. Data is transmitted via industrial IoT gateways using OPC UA protocol to the iFactory edge server, where initial signal processing removes noise and computes key health indicators such as RMS velocity, crest factor, and kurtosis. For gearboxes, we add oil condition sensors that measure viscosity, dielectric constant, and particle count, along with an in-line debris monitor that captures ferrous and non-ferrous wear particles. Spectral analysis of vibration data using Fast Fourier Transform (FFT) identifies specific gear mesh frequencies and bearing defect frequencies (BPFI, BPFO, BSF). Liner wear is assessed through a combination of ultrasonic thickness gauges installed at strategic locations along the shell and a robotic laser profiler that scans the liner surface during scheduled maintenance windows. All data streams converge in the iFactory cloud platform, where machine learning models—trained on historical failure data from over 200 cement plants—generate predictive alerts and recommended actions.
Key Performance Indicators for Ball Mill Health
| Component | Parameter | Normal Range | Alert Threshold | Failure Mode |
|---|---|---|---|---|
| Trunnion Bearing | Temperature | 40-60°C | >75°C | Lubrication failure, wipe |
| Trunnion Bearing | Vibration (RMS) | <2.5 mm/s | >4.5 mm/s | Misalignment, fatigue |
| Gearbox | Oil Particle Count | <100 particles/ml | >500 particles/ml | Gear wear, bearing spalling |
| Gearbox | Vibration (Gear Mesh) | <10 g | >20 g | Tooth breakage, pitting |
| Liners | Thickness | 50-80 mm | <30 mm | Perforation, breakage |
| Liners | Profile Deviation | <5 mm | >15 mm | Washout, uneven wear |
Progressive Failure Timeline: From Early Warning to Catastrophe
Stage 1: Thermal Drift
Bearing temperature rises 5-10°C above baseline. Vibration remains normal. Our algorithm flags this as a lubrication issue, recommending grease replenishment or oil change. If ignored, this stage lasts 2-4 weeks.
Stage 2: Vibration Onset
Vibration levels increase to 3.5-4.0 mm/s, with emerging harmonics at bearing defect frequencies. Gearbox oil shows elevated particle count. Action: schedule inspection within 1 week.
Stage 3: Accelerating Degradation
Temperature exceeds 80°C, vibration spikes above 6 mm/s. Gearbox emits audible noise. Oil analysis reveals ferrous particles >1000/ml. Immediate shutdown required to prevent seizure.
Stage 4: Catastrophic Failure
Bearing weld, gear tooth fracture, or liner perforation leads to unplanned downtime of 48-72 hours, costing $500k+ in lost production and emergency repairs.
Grinding Media Optimization Through Predictive Analytics
The grinding media charge—the steel balls inside the mill—directly impacts both energy consumption and product fineness. Traditional methods rely on power draw curves and manual sieve analysis, which are infrequent and imprecise. iFactory's approach integrates real-time mill power consumption, acoustic emission analysis, and liner wear data to dynamically optimize the ball charge. Our machine learning model correlates the acoustic signature of ball impacts (measured by a microphone array mounted on the mill shell) with the specific surface area of the product. By analyzing the frequency spectrum, we can detect when the ball charge is too high (excessive noise, wasted energy) or too low (inefficient grinding, product coarseness). The system then recommends a precise ball addition or removal schedule, typically achieving a 12% reduction in specific energy consumption while maintaining Blaine fineness targets. Additionally, the model predicts the optimal ball size distribution based on liner wear profile—as liners wear, the lift height changes, altering the trajectory of the balls. Our algorithm adjusts the charge composition to compensate, ensuring consistent grinding performance throughout the liner life cycle.
Acoustic Emission Analysis
Microphone arrays capture ball impact frequencies. Our FFT-based analysis identifies charge volume, ball size distribution, and liner condition in real time.
Power Draw Correlation
Mill motor power consumption is a direct indicator of charge weight. Our model predicts optimal power draw for target throughput and fineness.
Liner Wear Compensation
As liners wear, the effective mill volume changes. Our system recalculates the ideal ball charge to maintain grinding efficiency.
Automated Ball Addition
Integration with ball feeding systems allows automated, data-driven ball additions, eliminating guesswork and overfilling.
Ready to Optimize Your Mill's Performance?
Implement AI-driven predictive maintenance for ball mills and achieve unprecedented reliability and efficiency. Our platform integrates seamlessly with existing PLCs and sensors.
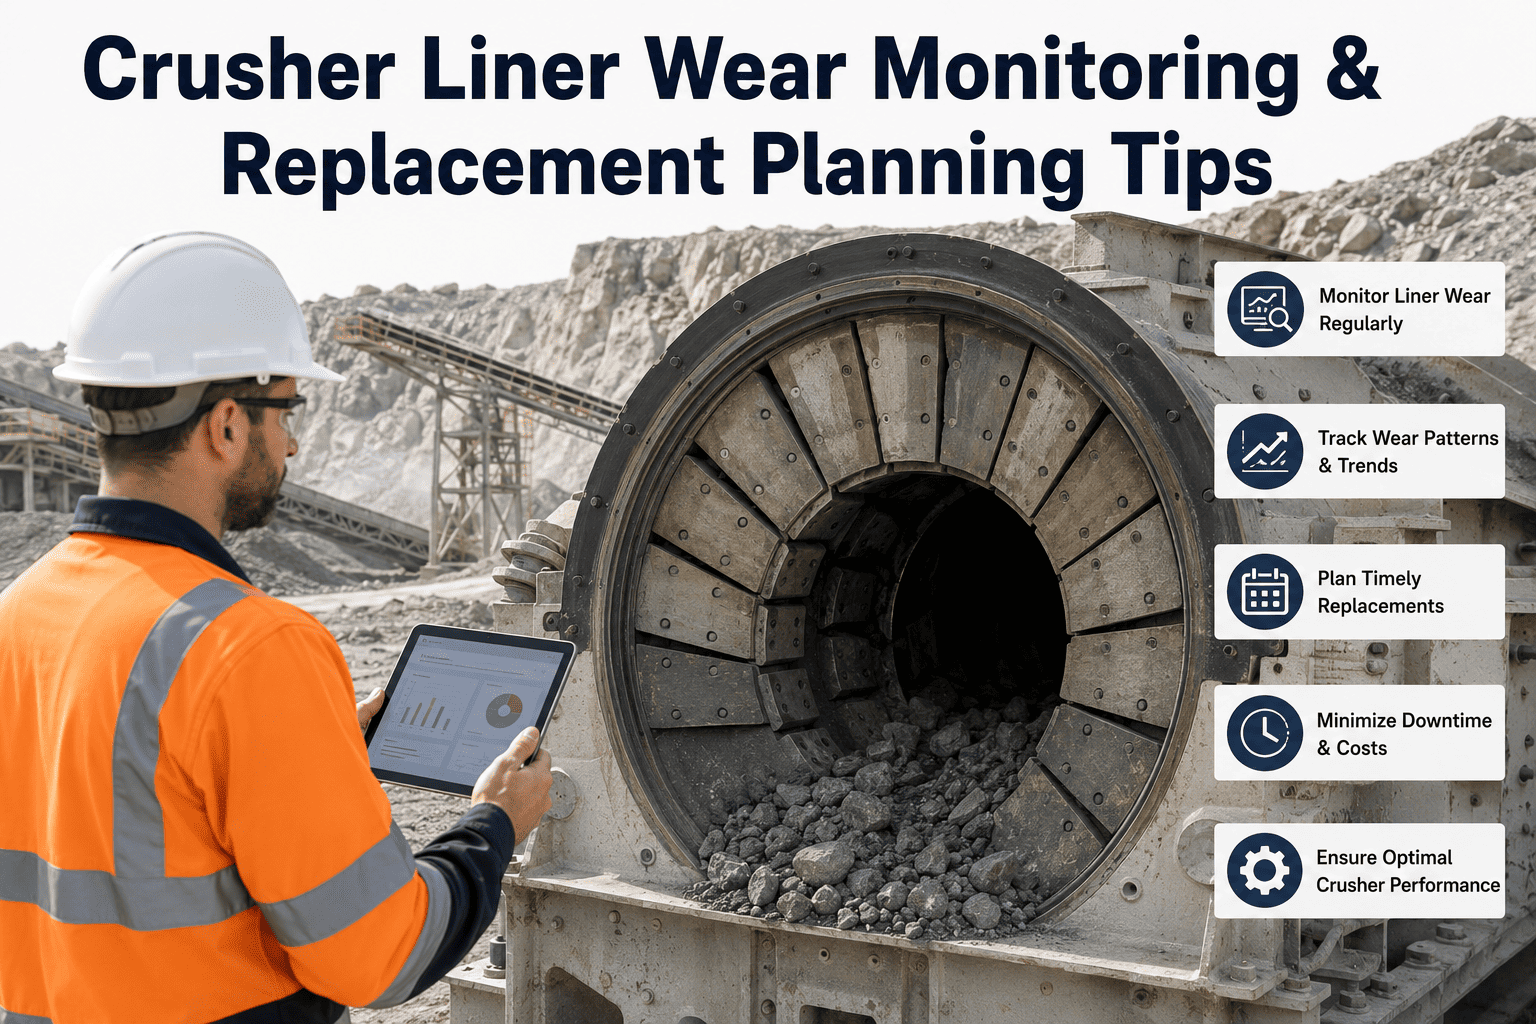
Liner Wear Profile Monitoring: From Manual to Autonomous
Liner wear is the most insidious failure mode in ball mills because it progresses slowly and is difficult to measure without stopping the mill. Traditional practice involves scheduling a shutdown every 3-6 months for manual inspection using templates or calipers—a process that is labor-intensive, subjective, and often misses localized wear patterns. iFactory's autonomous liner monitoring system uses a combination of fixed ultrasonic sensors and a robotic crawler equipped with a line laser profiler. The ultrasonic sensors, embedded in the mill shell at 12 strategic locations, measure liner thickness continuously during operation. The crawler, deployed during scheduled maintenance windows, scans the entire liner surface with sub-millimeter accuracy, generating a 3D point cloud that is compared to the original CAD model. Our analytics platform identifies areas of accelerated wear, such as the toe region or near the feed end, and predicts the remaining useful life for each liner segment. This data feeds into a replacement optimization algorithm that groups liner replacements to minimize the number of shutdowns. The result is a 20% extension in liner life and a 15% reduction in maintenance downtime.
Liner Wear Monitoring Technologies Comparison
| Technology | Accuracy | Measurement Frequency | Cost | Integration Complexity |
|---|---|---|---|---|
| Manual Template | ±5 mm | Quarterly | Low | None |
| Ultrasonic Fixed | ±1 mm | Continuous | Medium | Moderate |
| Laser Profiler (Crawler) | ±0.5 mm | Monthly | High | High |
| iFactory Hybrid | ±0.5 mm | Continuous + Monthly | Optimized | Turnkey |
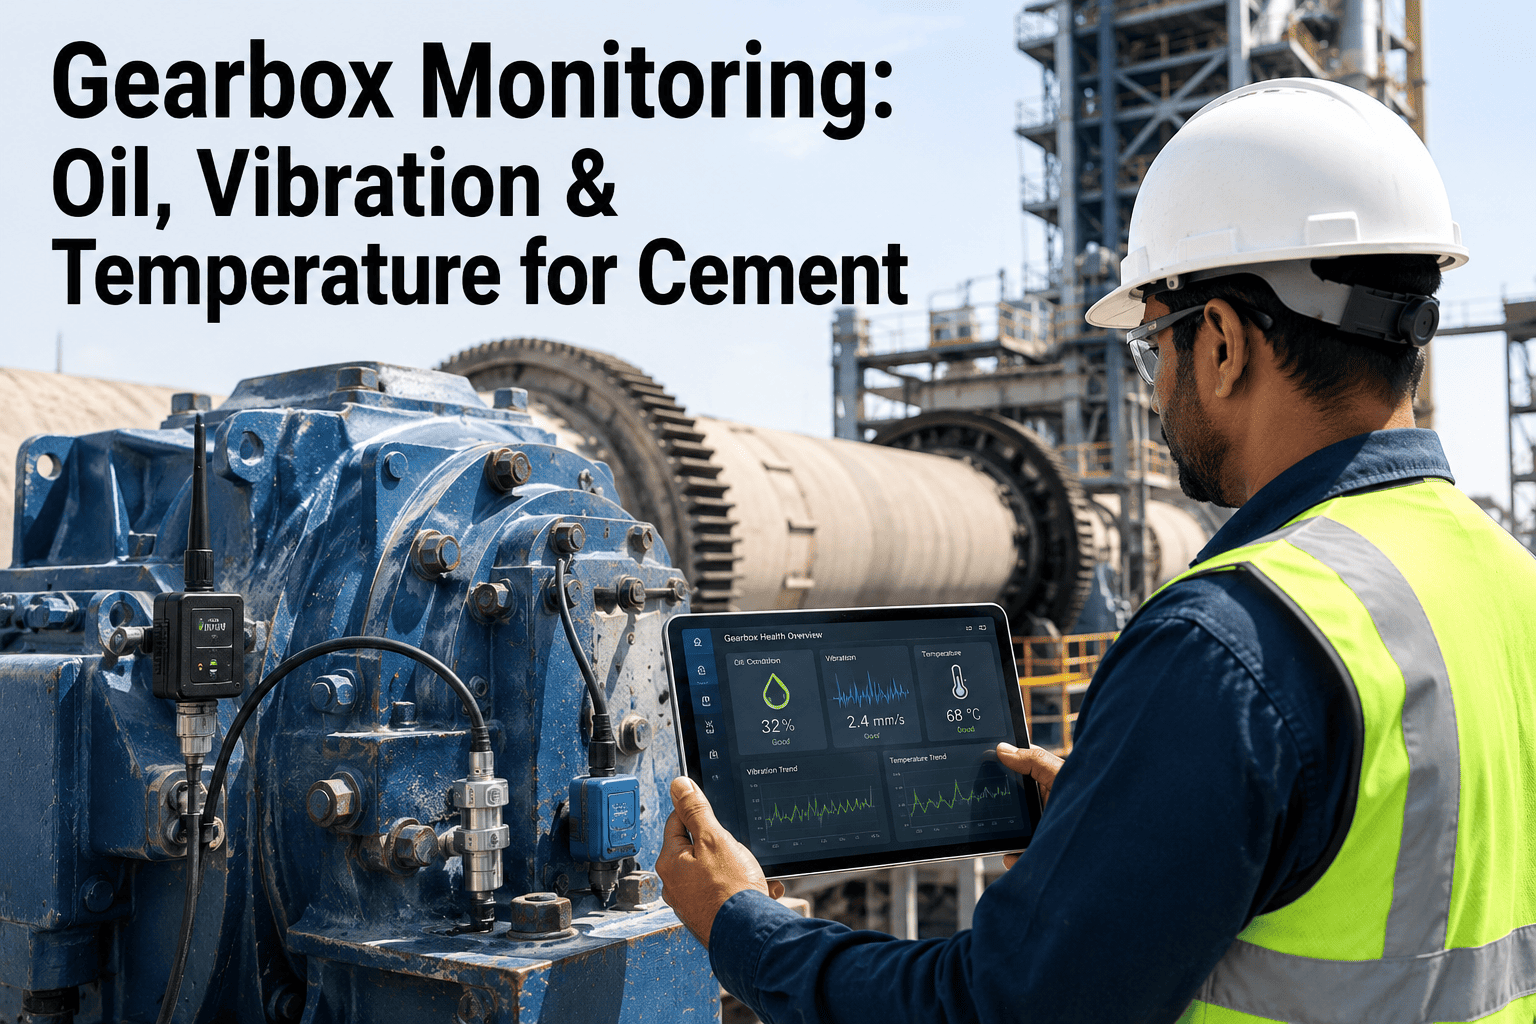
Gearbox Condition Monitoring: Oil Analysis and Vibration Synergy
The mill gearbox is a complex assembly of helical and bevel gears, bearings, and shafts, all operating under high torque and shock loads. Gearbox failures account for approximately 15% of all ball mill downtime, and the lead time for replacement gears can exceed 6 months. iFactory's gearbox monitoring strategy combines online oil analysis with high-frequency vibration monitoring. Oil analysis sensors continuously measure viscosity, moisture content, and particle count, while an in-line debris monitor captures ferrous and non-ferrous wear particles. Vibration sensors mounted on the gearbox housing capture acceleration data up to 10 kHz, which is processed using envelope analysis to detect early-stage pitting and spalling. Our proprietary algorithm fuses these data streams to generate a single health index for the gearbox. For example, a rise in particle count combined with a specific vibration signature at the gear mesh frequency indicates gear tooth fatigue. The system then calculates the remaining useful life and recommends a precise window for gearbox overhaul, typically providing 4-6 weeks of advance notice. This allows maintenance teams to order replacement parts and schedule the work during a planned shutdown, avoiding the 72-hour emergency repair scenario.
Online Oil Analysis
Real-time measurement of viscosity, moisture, and particle count. Detects contamination and wear debris before damage propagates.
High-Freq Vibration
10 kHz sampling with envelope analysis for bearing and gear defect detection. Identifies spalling, pitting, and cracks.
Thermal Imaging
Infrared cameras monitor gearbox surface temperature. Hot spots indicate misalignment, overloading, or lubrication failure.
Fusion Analytics
Machine learning model combines oil, vibration, and thermal data for a unified health score and RUL prediction.
Frequently Asked Questions
How does iFactory's ball mill PdM system handle false alarms?
Our system uses a multi-sensor fusion approach that cross-validates anomalies across temperature, vibration, and oil analysis before triggering an alert. For instance, a temporary temperature spike caused by ambient conditions is ignored if vibration and oil data remain normal. Additionally, our machine learning models are trained on years of historical data from diverse cement plants, enabling them to distinguish between genuine failure signatures and operational noise. False alarm rates are typically below 2%. For more details, contact our support team.
What is the typical ROI for implementing ball mill PdM?
Customers typically see a payback period of 6-12 months. The ROI is driven by three main factors: elimination of unplanned downtime (average cost $500k per event), reduction in maintenance labor and parts (30% savings), and energy efficiency gains (12% reduction in specific power consumption). A typical cement plant with 3 ball mills can save over $1.5 million annually. Book a Demo to receive a customized ROI analysis for your plant.
Can the system integrate with existing DCS and CMMS platforms?
Yes, iFactory's platform is built on open standards (OPC UA, MQTT, REST APIs) and can integrate with virtually any DCS (Siemens, ABB, Rockwell) and CMMS (SAP, Maximo, Oracle). Our edge gateway collects data from existing sensors and controllers, so there is no need to replace your current infrastructure. The integration typically takes 2-4 weeks. Contact support for a technical consultation.
What sensors are required for trunnion bearing monitoring?
We recommend a minimum of two RTD PT100 temperature sensors and two accelerometers per bearing (one radial, one axial). The sensors should be mounted on the bearing housing, not the shaft, to ensure accurate measurement. Our standard kit includes wireless vibration sensors with a 10 kHz bandwidth and a temperature range of -40 to 150°C. For hazardous areas, we offer intrinsically safe versions. Book a Demo to discuss your specific sensor requirements.
How does the system handle liner wear measurement without stopping the mill?
We use a combination of fixed ultrasonic sensors that measure liner thickness continuously during operation, and a robotic crawler deployed during scheduled maintenance windows for high-precision 3D profiling. The ultrasonic sensors provide real-time wear trends, while the crawler offers detailed mapping. This hybrid approach ensures continuous monitoring without requiring additional shutdowns. Contact support for a detailed technical datasheet.
Take Control of Your Mill's Reliability
Stop relying on guesswork and reactive maintenance. iFactory's predictive analytics give you the data you need to optimize performance and eliminate downtime. Schedule your demo today.