Chemical plant energy systems—steam networks, cooling towers, compressors, and distillation
reboilers—consume 40-65% of total operating costs, yet traditional energy management relies on
monthly utility bills and manual audits that identify waste weeks after it occurs. iFactory's AI
energy optimization platform continuously analyzes real-time consumption patterns across your
chemical processes, detecting inefficiencies from equipment fouling, suboptimal control logic, and
load imbalances 8-24 hours before they impact production costs—enabling adjustments that reduce
energy consumption 10-18% without capital investment or process interruption. Book a demo to see energy
optimization for your plant configuration.
Real-Time Energy Monitoring
Track steam, electricity, cooling water, and fuel gas
consumption across all units with 5-minute granularity—identifying waste patterns
invisible to monthly utility bills.
Predictive Efficiency Analytics
AI models forecast energy demand based on production schedules,
ambient conditions, and equipment health—enabling proactive optimization before waste
occurs.
Sustainability Compliance
Automatically track carbon footprint reduction and generate ESG
reports—turning energy savings into verifiable sustainability credentials for
stakeholders.
Quick Answer
iFactory connects to your DCS, historians, or utility meters via OPC-UA
to continuously analyze steam consumption, electrical load profiles, cooling efficiency, and
heat recovery performance. Machine learning models identify optimal operating windows based on
current production rates, feedstock properties, and ambient conditions—recommending parameter
adjustments that reduce energy consumption 10-18%, lower utility costs $150K-$400K annually,
and improve sustainability metrics without capital investment or production interruption.
How AI Energy Optimization Delivers Measurable Results
The workflow below shows iFactory's four-stage energy optimization approach: data integration
from existing control systems, real-time consumption monitoring, optimization recommendation
generation, and validated savings tracking with continuous improvement.
1
Utility Data Integration
iFactory connects to existing DCS/SCADA and utility meters via
OPC-UA, extracting 180-280 energy tags per unit: steam flows, electrical loads, cooling
water temps, fuel consumption. System establishes dynamic baselines from 30-45 days
historical data.
280 tags/unit45-day baselineZero hardware changes
→
2
Real-Time Efficiency Monitoring
AI analyzes energy data every 5 minutes, calculating current
efficiency metrics: steam-to-product ratio, kWh/lb produced, cooling tower approach.
Compares actual performance against optimal baseline adjusted for production rate and
ambient conditions.
5-min analysis18-hour early warningMultivariate correlation
→
3
Optimization Recommendations
When inefficiency detected, system recommends specific adjustments:
reduce reboiler duty 6%, optimize cooling tower fan speed, adjust steam pressure
setpoints. Each recommendation includes predicted savings ranked by ROI impact.
Specific actionsROI prioritizedPredicted savings
→
4
Validated Savings Tracking
System measures actual energy reduction after implementation: steam
consumption down 11.2%, electrical load optimized 9.4%. Calculates financial impact based
on utility rates and production volume. Results logged for continuous model improvement.
Actual vs predictedFinancial impactContinuous learning
Energy Optimization
Reduce Energy Costs 10-18% Without Capital Investment
iFactory's AI optimizes existing equipment to peak energy efficiency
through continuous parameter adjustment based on real-time production rates, ambient
conditions, and utility consumption patterns.
Energy Optimization Applications Across Chemical Processes
iFactory delivers energy-specific optimization models for the most energy-intensive chemical
manufacturing unit operations, each trained on operational data from deployed plants to maximize
efficiency and minimize utility costs.
Distillation Column Energy
Optimizes reflux ratio, reboiler duty, and condenser cooling based
on real-time feed composition and product purity requirements—reducing steam consumption
while maintaining separation efficiency.
Steam reduction:10-16%
Purity maintained:+0.5%
Throughput impact:Neutral
Payback period:3.2 mo
Heat Exchanger Networks
Monitors fouling progression and thermal efficiency across heat
recovery networks, recommending flow rebalancing and temperature adjustments to maintain
heat recovery before cleaning is needed.
Heat recovery:+6.4%
Utility savings:12-18%
Cleaning deferred:25%
ROI timeline:4.1 mo
Utility Systems Optimization
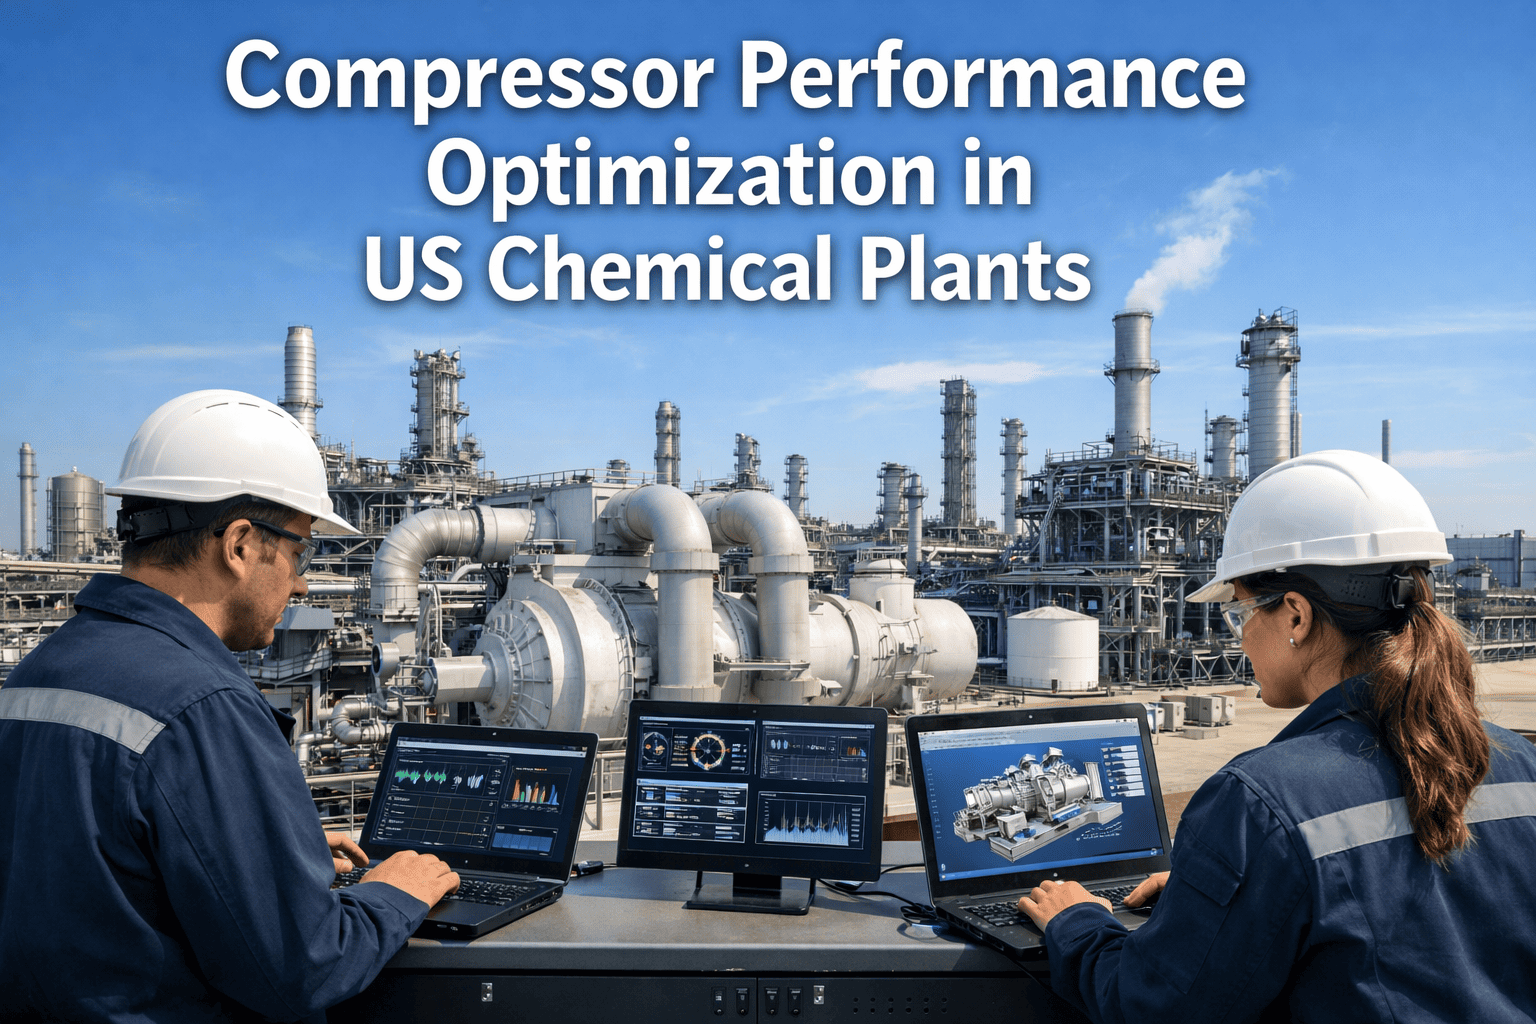
Optimizes steam pressure levels, cooling tower operation, and
compressor loading based on real-time demand—eliminating energy waste from over-design and
suboptimal control logic.
Electrical load:-9.8%
Steam efficiency:+11.3%
Cooling optimization:14.2%
Annual savings:$185K
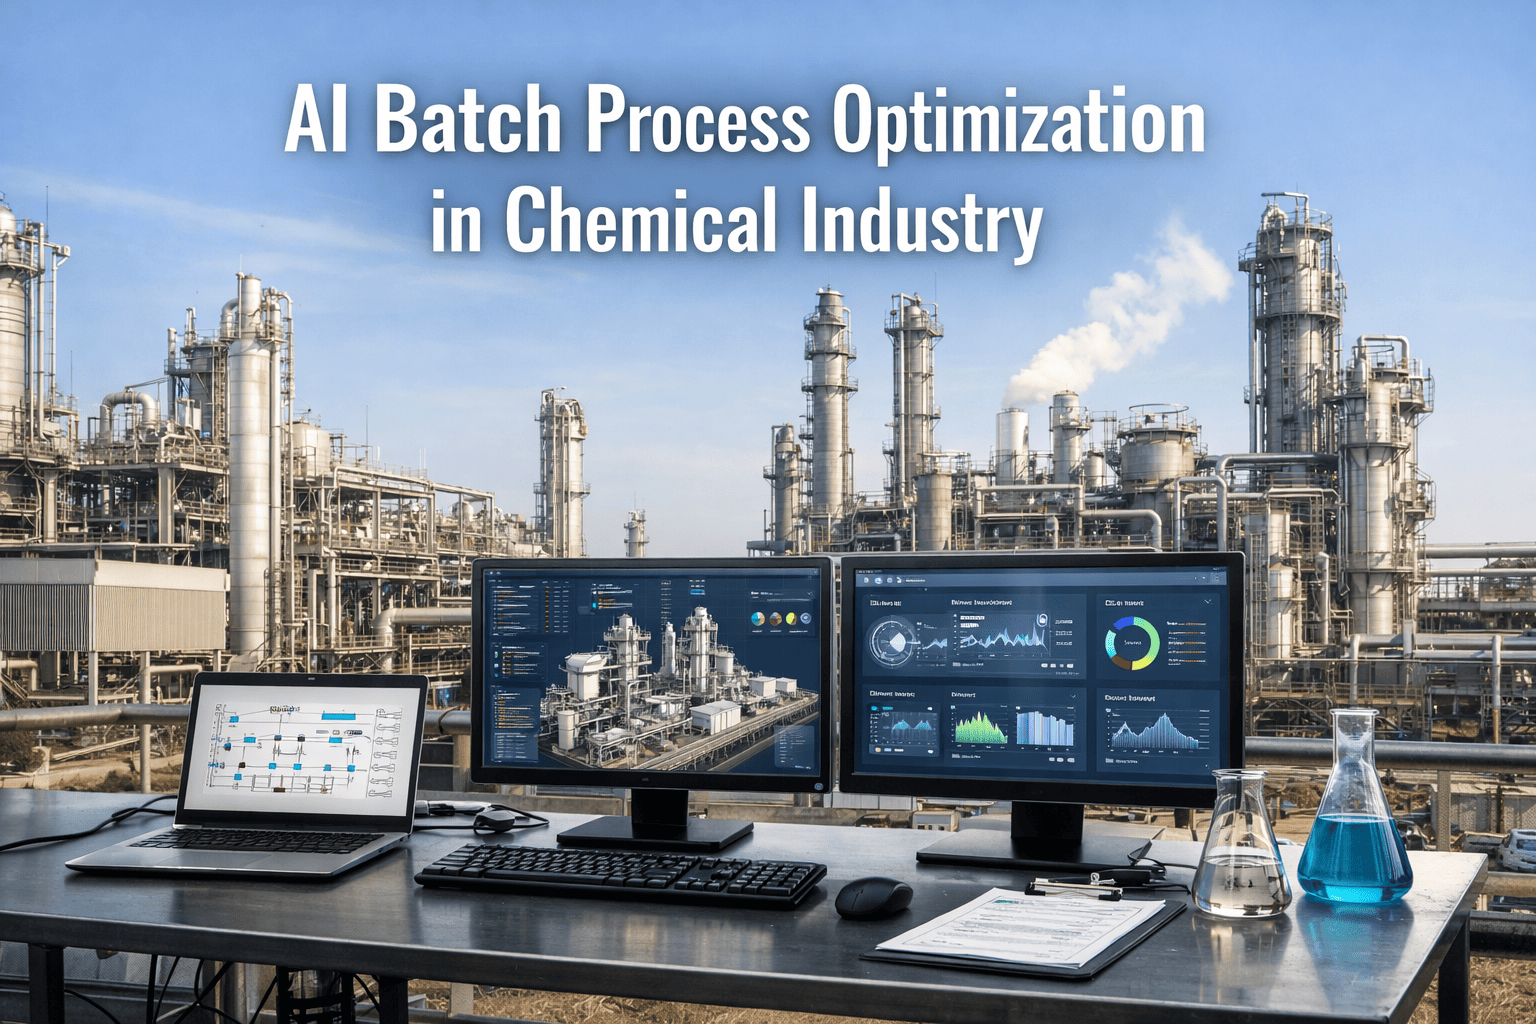
Batch Process Energy
Optimizes heating/cooling profiles, agitation energy, and vacuum
pump operation in batch reactors to minimize energy per batch while maintaining reaction
kinetics and product quality specifications.
Energy/batch:-12.4%
Batch time:-8 min
Quality variance:±0.3%
Payback:3.8 mo
Measured Results from Chemical Plant Energy Deployments
Performance data from 18-month deployments across specialty chemicals, commodity chemicals, and
pharmaceutical intermediates production—validated through utility meter reconciliation and
financial impact analysis.
11%
Average Energy Reduction
Measured across steam, electricity, and cooling water for 50M
lb/year facilities through utility meter validation. Range 8-18% depending on baseline
efficiency.
$185K
Annual Utility Savings
Combined steam, electricity, cooling water, and fuel gas
reduction measured via utility meters. Equivalent to 11% reduction for typical mid-sized
chemical plant.
4.7 mo
Average Payback Period
Time to recover implementation investment through verified energy
savings. ROI typically 4-6 months based on deployment cost $75K-$110K.
92%
Prediction Accuracy
Model accuracy for energy savings forecasts after 6 months of
operational feedback. Enables reliable budgeting and sustainability reporting.
"Our ethylene plant's energy costs were rising despite stable
production volumes. iFactory identified that our depropanizer column was operating 12% above
optimal reflux ratio due to outdated control logic. After implementing their AI
recommendations, we reduced steam consumption by 14.2% on that unit alone—saving $68,000
annually. The system now continuously optimizes our entire distillation train, delivering
$210K in verified annual savings with a 4.3 month ROI."
Operations Director
Global Chemical Producer • 120 million lb/year Olefins Complex •
Texas, USA
Frequently Asked Questions
QDoes energy optimization require new hardware or sensors?
No. iFactory connects to your existing DCS, SCADA, or historians via OPC-UA to access current energy meter data. No additional hardware installation required—optimization begins using your plant's existing instrumentation.
QHow quickly will we see energy savings after implementation?
Initial efficiency improvements typically appear within 2-4 weeks as the system establishes baselines and identifies quick-win opportunities. Significant savings (5%+) are usually achieved by month 3, with continuous improvement thereafter.
QCan the system optimize across multiple utilities simultaneously?
Yes. iFactory's multi-objective optimization balances steam, electricity, cooling water, and fuel gas consumption holistically. Recommendations consider trade-offs between utilities to maximize total cost savings while meeting production requirements.
QHow does the system handle production rate changes or feedstock variations?
AI models dynamically adjust energy baselines based on real-time production rates, feedstock properties, and ambient conditions. Optimization recommendations automatically adapt to changing operating scenarios without manual reconfiguration.
AI Energy Optimization
Reduce Energy Costs 11%, Save $185K Annually, Achieve ROI in
4.7 Months
iFactory's AI optimizes chemical plant energy systems through
continuous real-time analysis and parameter adjustment recommendations—delivering measurable
utility savings without capital investment or production interruption.