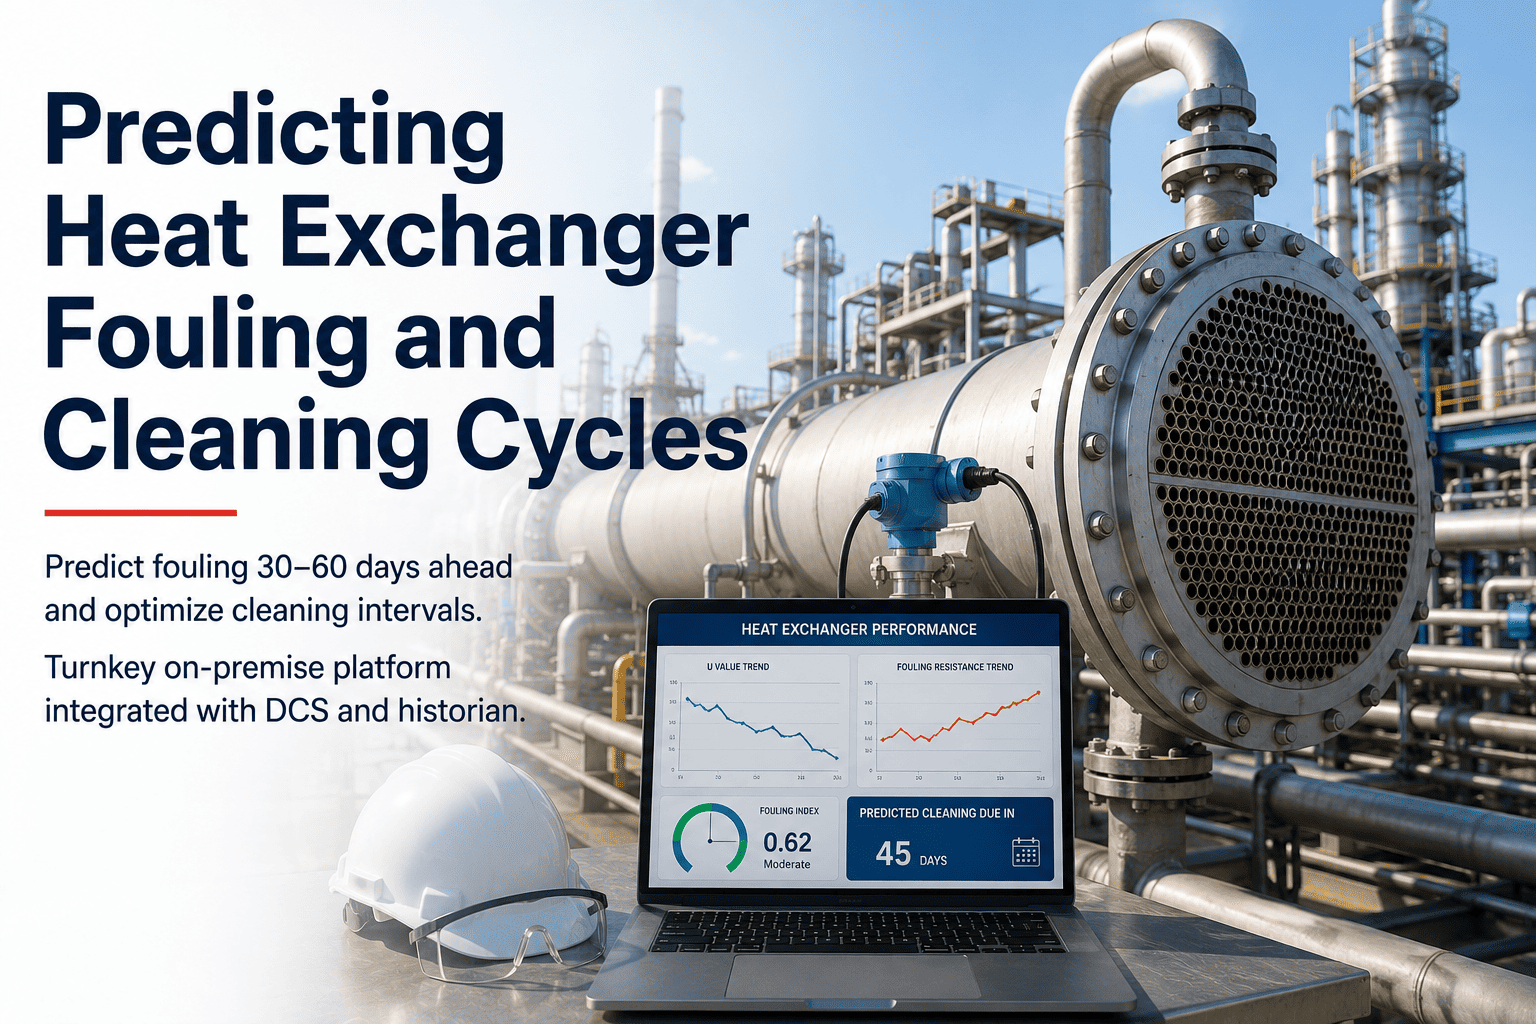
Heat exchanger fouling is the quietest revenue leak in a chemical plant. There's no alarm, no trip, no dramatic event — just a deposit building on the tube wall a fraction of a millimetre at a time, silently eroding 10 to 25 percent of heat transfer efficiency while the energy bill climbs and the schedule slips. By the time an operator notices the overall heat transfer coefficient has dropped 15 percent, the plant has already burned thousands in excess fuel, steam, or compressor hours, and the cleaning window is overdue. The reason it goes unmanaged is partly organizational — the cost hides in the energy budget, not the fouling budget, so no one function sees the whole picture. And the reason it's hard to fix is that the two default strategies both waste money: calendar-based cleaning assumes a uniform fouling rate that rarely matches reality, and pressure-drop limits miss high-resistance films until the damage is done. The answer is condition-based: track the U-value against a clean baseline, model the fouling trajectory, and clean at the moment the economics say to — not on a date. To see fouling prediction running on your exchanger fleet from your own historian, book a demo.
HEAT EXCHANGERS · FOULING & CLEANING OPTIMIZATION
Predict Fouling 30–60 Days Out. Clean on Economics, Not the Calendar.
A turnkey, on-premise platform tracks each exchanger's overall heat transfer coefficient against its clean baseline, classifies the fouling mechanism from the trajectory shape, and forecasts the cleaning window weeks ahead — integrated with your DCS and historian, no rip-and-replace. Turn the fouling tax from an invisible energy penalty into a scheduled, defensible decision.
10–25%
Heat transfer efficiency fouling silently erodes
30–60 days
Advance forecast of the cleaning window
70% ΔT
Where a hard cleaning trigger typically fires
15-min
Historian data cadence the model runs on
Why Fouling Goes Unmanaged Until It's Expensive
Fouling is uniquely easy to ignore because it never announces itself. There's no single failure to react to — just a gradual decline that most plants only catch once it's severe, using tools that either look too infrequently or measure the wrong thing. For a reliability engineer, the frustration is that the data to catch it early usually already exists in the historian; what's missing is the systematic analysis that turns that data into a decision before the penalty compounds.
The Cost Hides Across Budgets
A fouled exchanger forces the fired heater to compensate, and that penalty shows up in the energy budget, not the fouling budget. Because the cost is spread across functions no single team owns, nobody sees the full picture — so fouling gets accounted for as a maintenance line item when its real penalty is a much larger, invisible energy tax.
Weekly U-Checks Miss the Leading Edge
Manual U-coefficient calculations done weekly are intermittent by nature, and by the time the number visibly drops, the cleaning window is already overdue. Fouling progresses continuously; sampling it once a week means catching the trend well after the leading edge has passed, when the recoverable margin is already gone.
Pressure Drop Is a Late Signal
Pressure-based monitoring only responds to deposits with real physical bulk, so it misses early-stage high-resistance films — asphaltene, coke, thin scale — until the U-value has already degraded substantially. Waiting for differential pressure to move means waiting past the point where early intervention was still cheap.
Calendar Cleaning Fits Nobody's Reality
Fixed-interval cleaning assumes a uniform fouling rate that actual conditions rarely match — so some exchangers get cleaned needlessly early while others foul past the optimal point before their date arrives. It's a schedule built on an average that describes no individual unit, wasting shutdown capacity on one and lost efficiency on another.
The trap is that fouling is discovered during disruption rather than during a planned window. Without predictive insight, the first real signal is often a throughput limit or an unplanned shutdown — the most expensive possible moment to learn the exchanger needed cleaning weeks ago.
The Physics: What the U-Value Actually Tells You
Fouling prediction rests on one measurable truth: a fouled exchanger transfers heat worse than a clean one, and that degradation is quantifiable in real time from data the plant already collects. The overall heat transfer coefficient is the direct measure of thermal performance, and comparing it against the clean design baseline yields the fouling resistance — the number that matters. This is why the shift to condition-based monitoring is usually analytical, not instrumental: the sensors are already there.
STEP 1
Compute U From Live Data
The actual overall heat transfer coefficient is calculated continuously from live shell- and tube-side inlet and outlet temperatures, flow rates, and heat duty, using the log mean temperature difference method corrected for the flow arrangement — or the effectiveness-NTU method when temperatures aren't fully known. This runs on historian data at intervals like every 15 minutes, far more frequently than weekly manual checks.
STEP 2
Derive Fouling Resistance
Fouling resistance is the difference between the current and clean-baseline coefficients — Rf = (1/U_actual) − (1/U_clean) — expressed in m²·K/W as the deposit's thermal resistance. Because UA measures thermal performance directly, it detects high-resistance fouling films long before they cause any hydraulic restriction, catching early-stage asphaltene and scale that pressure drop simply can't see.
STEP 3
Watch the Approach Temperature Collapse
As fouling grows, the approach temperature narrows and the delta-T collapses. A common practice sets a soft alarm when the approach narrows to roughly 80 percent of the design delta-T and a hard cleaning trigger at 70 percent, with a sustained few-degree collapse over consecutive readings confirming the trend. These thresholds turn a physical decline into a defensible, documented action point.
STEP 4
Trend and Forecast the Trajectory
Trended over time and modeled against the design coefficient, the fouling-resistance trajectory becomes a forecast: predictive models trained on historical fouling signatures project when performance will cross the cleaning threshold, naming the failure window weeks to months ahead with confidence scoring rather than reacting after the metric has already dropped.
See Fouling Prediction on Your Own Exchangers
Bring a fouling-sensitive service — a crude preheat exchanger, a reboiler, an overhead condenser. iFactory engineers will show the U-value trajectory pulled from your historian, the mechanism classification, and the cleaning-window forecast, all without touching your DCS control layer.
Know the Mechanism, Choose the Cleaning
Not all fouling is the same, and the mechanism determines both how fast it grows and how it has to be removed — chemical cleaning for scale, mechanical for biological and particulate, specialized approaches for coking. A prediction platform that classifies the mechanism from the trajectory's shape and rate of change doesn't just tell you when to clean; it points toward how, and toward the root cause worth attacking. These are the mechanisms a reliability engineer manages across a chemical fleet.
Crystallization / Scaling
Dissolved salts — commonly calcium carbonate or sulfate — exceed solubility as the fluid heats and precipitate as a hard, adherent scale on the wall. It's the classic water-system foulant, and its hard, well-crystallized deposits are among the most resistant to mechanical removal, typically needing chemical or acid cleaning matched to the deposit chemistry.
Particulate / Sedimentation
Suspended solids, silt, and corrosion debris settle and accumulate, especially in low-velocity zones where the flow can't keep them entrained. Often more responsive to mechanical removal — flushing, brushing, hydroblasting — than scale or biofilm, but it compounds quickly once a low-flow dead zone establishes itself.
Biological (Biofilm)
Algae, bacteria, and microbial slime colonize under-treated cooling water, and the biofilm both insulates the surface and traps other foulants, accelerating everything else. It usually needs mechanical removal plus a water-treatment fix at the source, since cleaning without addressing the growth condition just resets the clock.
Corrosion Products
The tube or plate material reacts with the process fluid to form a thermally resistive oxide layer directly on the surface, which then seeds further scale and particulate. Beyond cleaning, it signals a materials-or-chemistry problem — the right response may be a surface coating, a filming amine, or a materials review rather than just another clean.
Chemical Reaction / Coking
Polymerization or coking of the process fluid at hot surfaces forms a bonded deposit — the dominant mechanism in petrochemical and refinery service, where asphaltenes precipitate and thermally degrade to coke on high-skin-temperature tubes. It grows fastest where delta-T is highest and demands specialized cleaning, making early trajectory detection especially valuable.
Mixed & Service-Specific
Real fouling is often several mechanisms at once — corrosion seeding particulate, scale trapping biofilm — and each service has its own signature. Classifying the mechanism from the fouling-rate curve and confirming with deposit analysis is what lets the response target the actual cause instead of repeating a generic clean that the deposit will simply reform after.
The Optimal Cleaning Moment Is an Economic Decision
The goal of fouling prediction isn't to clean as early as possible or as late as possible — it's to clean at the single point where the economics are best. That point is precise: it's the moment where the next marginal unit of fouling costs more in fuel and lost heat recovery than a cleaning intervention would cost. Cleaning before it wastes shutdown capacity; cleaning after it burns money in the energy budget. Naming that moment is the whole value.
TOO EARLY
Wasted Shutdown Capacity
Cleaning an exchanger that still has useful margin left consumes maintenance labor, cleaning cost, and a shutdown slot that another unit needed more. Calendar schedules cause exactly this — pulling a still-performing exchanger offline on its date while the recoverable efficiency was barely worth the intervention.
THE OPTIMUM
Marginal BTU Meets Marginal Cost
The optimal moment is where the next increment of fouling costs more in fuel and lost preheat than the cleaning does. A model that trends the energy penalty in dollar terms against cleaning cost finds this crossover per exchanger, converting the decision from intuition into a defensible, quantified recommendation.
TOO LATE
The Compounding Energy Tax
Past the optimum, every day of continued fouling drops inlet temperature to the fired heater, lifts fuel consumption, and erodes throughput margin — a penalty that compounds silently in the energy budget until it forces an unplanned shutdown at the worst possible time and cost.
This reframes cleaning from a maintenance chore into an optimization. One reliability team that switched from annual to condition-based cleaning on this logic freed up meaningful shutdown capacity and, just as importantly, finally had a defensible number for the fouling tax on every shell-and-tube they owned — turning an argument about intuition into a decision backed by data.
Fouling Is a Network Problem, Not a Single-Unit One
Monitoring one exchanger in isolation misses the largest part of the penalty, because heat exchangers rarely work alone — they sit in integrated networks and preheat trains where fouling in one unit redistributes load across the rest. A reliability engineer optimizing the fleet has to see the network effect, not just individual U-values, because that's where the real energy recovery is won or lost.
01
Load Redistributes When One Unit Fouls
A fouled exchanger forces adjacent units to absorb more duty and lowers the process temperature reaching downstream, so a single unit's decline ripples across the network. Monitoring exchangers one at a time misses this coupling entirely — the full operating effect only shows up at the network level.
The Preheat Train Amplifies It
02
In a preheat train, fouling drops the feed temperature entering the fired heater, driving fuel consumption up and eroding throughput margin across the whole train. It's the most fouling-sensitive heat-transfer system in a plant, and the place where pinch and heat-integration losses concentrate.
03
Prioritize by Network Impact, Not Local Severity
The most-fouled exchanger isn't always the one worth cleaning first — the one whose fouling most degrades the network's heat recovery is. Seeing UA degradation across every unit against the integration scheme lets the team sequence cleaning by total recovered energy, not by which single unit looks worst.
04
Connect Fouling to Its Drivers
AI optimization connects fouling behavior to the process conditions that drive it — temperature, flow velocity, feed composition — so the model doesn't just track the symptom but links it to the operating levers. That's what turns monitoring into mitigation: adjusting conditions to slow fouling, not just cleaning after it.
What Changes for the Reliability Engineer
Fouling prediction changes the reliability engineer's role from reacting to efficiency complaints to owning a defensible, data-backed cleaning program — and finally being able to quantify a cost the plant has always paid but never measured.
01
A Defensible Number for the Fouling Tax
Instead of arguing cleaning schedules on intuition, you carry a quantified energy penalty per exchanger and a crossover point that says exactly when cleaning pays. The conversation with the energy team and operations shifts from opinion to a shared, measured number everyone can act on.
02
Cleaning Windows Planned, Not Forced
A 30-to-60-day forecast means cleaning lands in a planned maintenance window with parts, contractors, and shutdown slot arranged — instead of erupting as an unplanned shutdown when throughput hits a wall. The work moves from reactive scramble to scheduled, sequenced maintenance.
03
Shutdown Capacity Freed Up
Cleaning only the exchangers that actually need it, at the right moment, recovers the shutdown days that calendar-based over-cleaning used to consume. That freed capacity goes to the work that genuinely moves reliability, rather than to servicing units that still had margin.
04
Mechanism Insight Drives Root-Cause Fixes
Because the model classifies the fouling mechanism, you can attack the cause — a water-treatment gap, a low-velocity dead zone, a feed-blend issue — instead of endlessly re-cleaning the same unit. Reliability shifts upstream from removal to prevention.
How iFactory Deploys — Turnkey, On-Premise, No Rip-and-Replace
The platform is built to layer onto the plant you already run: it reads your existing instrumentation, runs entirely inside your network, and ships as a turnkey system so the path from decision to running forecast is measured in weeks. It works alongside your DCS, CMMS, and ERP rather than replacing any of them.
1
Connect the Historian and DCS
The platform ingests shell- and tube-side temperatures, flow rates, and physical-property data from your DCS historian at intervals like every 15 minutes — reading existing tags rather than requiring new instrumentation, since most plants already collect what's needed.
2
Baseline Every Exchanger
Each unit's clean design coefficient is established as its reference, and the live U-value is computed continuously via LMTD or effectiveness-NTU so fouling resistance is trended against the right baseline for that specific service from day one.
3
Model, Classify, and Forecast
Fouling-rate models calibrated to each service track the trajectory, classify the mechanism from its shape and rate, estimate time to the cleaning threshold, and recommend the optimal cleaning date — balancing energy loss against cleaning cost and production impact.
4
Trigger CMMS Work, Run On-Premise
When performance crosses a defensible threshold, the platform auto-triggers a CMMS cleaning work order — and the whole system runs on-premise, inside your network, integrated with existing DCS, CMMS, and ERP with no rip-and-replace and no data leaving your walls.
Frequently Asked Questions
The questions reliability engineers ask most often when evaluating heat exchanger fouling prediction.
Why track the U-value instead of just monitoring differential pressure?
Because they detect fouling at very different stages. The overall heat transfer coefficient measures thermal performance directly, so it catches high-resistance fouling films — early asphaltene, coke, thin scale — long before those deposits have enough physical bulk to restrict flow. Pressure drop only responds once a deposit is thick enough to cause hydraulic restriction, which means pressure-based monitoring misses the leading edge of fouling entirely and only alarms after the U-value has already degraded substantially. For early, actionable detection you want the U-value trajectory; pressure drop is a useful confirming signal but a poor primary one. To see U-value trending on your services,
book a demo.
Do we need new sensors, or can this run on our existing historian?
In most cases it runs on what you already have. Calculating the overall heat transfer coefficient needs shell- and tube-side inlet and outlet temperatures, flow rates, and heat duty — and most plants already collect exactly this in their DCS historian. That means the shift to condition-based monitoring is usually analytical rather than instrumental: the platform ingests your existing tags at intervals like every 15 minutes and computes U continuously via LMTD or effectiveness-NTU. Occasionally a specific service is missing a flow or temperature measurement and benefits from adding one, but the starting assumption is that the data to predict fouling is already in your historian, waiting to be analyzed systematically instead of sampled weekly by hand.
How does the platform know the optimal time to clean?
It finds the economic crossover point — the moment where the next increment of fouling costs more in fuel and lost heat recovery than a cleaning intervention would cost. The model trends each exchanger's fouling resistance, translates the efficiency loss into an energy penalty in dollar terms, and compares that against the cost of cleaning and the production impact of the shutdown. Cleaning before that crossover wastes shutdown capacity on a unit that still had useful margin; cleaning after it burns money in the energy budget. By naming the crossover per exchanger and forecasting when it arrives, the platform converts the cleaning decision from calendar habit or intuition into a defensible, quantified recommendation you can take to operations and the energy team.
Can it tell us what kind of fouling we're dealing with?
To a useful degree, yes — the platform classifies the likely mechanism from the shape and rate of change of the fouling trajectory, because different mechanisms foul with different signatures. A rapid coking curve on a high-skin-temperature service looks different from slow crystallization scaling or a biofilm's accelerating growth. That classification matters because the cleaning method follows the mechanism: chemical or acid for scale, mechanical or hydroblasting for particulate and biological, specialized approaches for coking. It also points toward root cause — a corrosion signature suggests a materials or chemistry issue, a biofilm signature a water-treatment gap. Deposit analysis still confirms composition definitively, but the trajectory classification tells you where to look and how to plan the intervention before you open the unit.
Will this disrupt our DCS or require replacing our control systems?
No — it's explicitly designed to layer on without touching your control layer. The platform reads from your DCS historian and runs its analytics on-premise inside your own network, working alongside your existing DCS, CMMS, and ERP rather than replacing any of them. It's a monitoring and prediction layer, not a control system, so it doesn't sit in the control loop or require re-engineering your automation. When it identifies a cleaning need, it can trigger a work order in your existing CMMS. The turnkey, on-premise deployment means the model can be reading your historian and producing fouling forecasts in a matter of weeks, with no rip-and-replace and no plant data leaving your network. Contact
iFactory support to review integration with your specific historian and DCS.
STOP PAYING THE INVISIBLE FOULING TAX
Predict Fouling Weeks Ahead and Clean at the Right Moment — Every Exchanger, Every Time.
Continuous U-value tracking from your own historian, mechanism classification, network-aware prioritization, and a cleaning-window forecast tied to the economic crossover — turnkey, on-premise, integrated with your DCS and CMMS with no rip-and-replace. Turn fouling from a silent energy penalty into a scheduled, defensible decision.