Robotic Leak Localization: Combining Gas Sensors, Thermal, and Vision
By Jennie on March 7, 2026
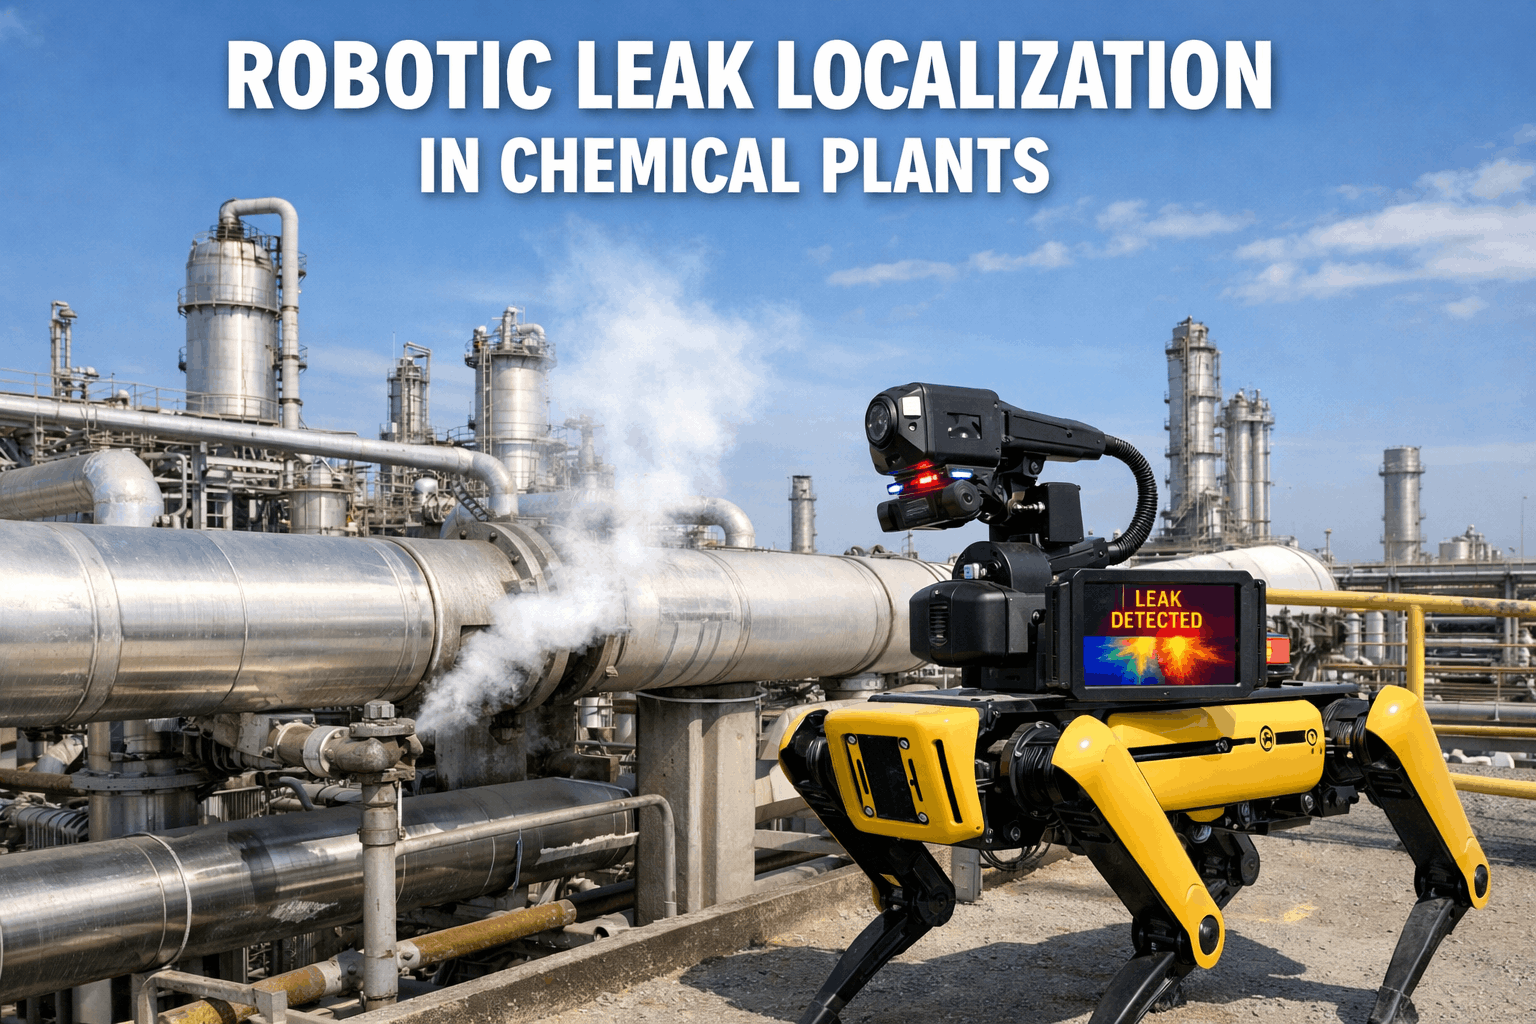
A chemical plant in the Gulf Coast runs 14 miles of pressurized piping carrying hydrogen, chlorine, ammonia, and dozens of volatile organic compounds across 340 acres. Last year, their leak detection program logged 1,847 gas alarms. Technicians responded to every one — walking the area with handheld sniffers, checking flanges, scanning valve packing, inspecting heat exchangers. Of those 1,847 alarms, 612 were confirmed leaks. The other 1,235 were false positives, transient readings, or alarms where the source could not be located before the reading dissipated. Average time to locate a confirmed leak source: 2.7 hours. Average time spent on a false positive before abandoning: 1.4 hours. Total annual labor consumed: 3,383 hours — roughly 1.6 FTE doing nothing but chasing gas readings. Robotic leak localization changes the equation fundamentally. Instead of a human walking an area with a single sensor, a robot combines three sensor modalities simultaneously — gas concentration mapping, thermal imaging, and visual inspection — to triangulate the leak source in minutes rather than hours, confirm whether the leak is real before dispatching a technician, and generate a maintenance ticket with the precise location, severity, and sensor evidence attached. The technician arrives at the flange, not the general area. The work order includes the thermal image showing the temperature differential and the gas concentration gradient pointing to the source. The repair starts immediately instead of after a 2-hour search. Schedule a demo to see how robotic leak data feeds directly into automated maintenance ticketing.
Manual Leak Response
Technician walks the area with a handheld sniffer. Single-sensor, single-modality. Source location depends on wind, experience, and patience.
Single sensor2.7 hr avg locate67% false positive rate
VS
Robotic Multi-Sensor Localization
Robot combines gas, thermal, and vision simultaneously. Triangulates source in minutes. Generates ticket with evidence before a technician is dispatched.
3 sensor fusion8–15 min locateUnder 5% false positive
Side-by-Side: Manual Detection vs. Robotic Localization
Manual
Robotic
Sensor modalities
Single (handheld gas sniffer)
Three simultaneous (gas + thermal + vision)
Source localization time
2.7 hours average per confirmed leak
8–15 minutes with multi-sensor triangulation
False positive rate
67% — most alarms cannot be confirmed
Under 5% with cross-sensor correlation
Hazardous exposure
Technician in the gas plume for 1–3 hours
Zero human exposure during localization
Documentation quality
Handwritten notes, no photos, imprecise location
GPS coordinates, thermal image, gas map, video
Night / adverse weather
Degraded — wind disrupts readings, dark limits visual
Unaffected — thermal and gas sensors work in any condition
Ticket generation
Manual entry after returning to office, hours later
Auto-generated with full sensor evidence in real time
Coverage per patrol
1–2 units per shift (walking pace, single area)
6–10 units per patrol (autonomous route, full perimeter)
The Three Sensor Modalities: What Each One Detects
No single sensor can localize a leak reliably. Gas sensors detect the presence and concentration of a substance but cannot pinpoint the source when wind disperses the plume. Thermal cameras see temperature differentials caused by evaporation or pressurized release but cannot identify the chemical or confirm it is a leak versus normal process heat. Visual inspection cameras document the physical condition of flanges, valves, and fittings but cannot detect invisible gases. The power of robotic localization comes from combining all three simultaneously — each sensor compensating for the blind spots of the other two.
Modality 1: Gas Concentration SensorsDetection
Sensor types: Photoionization detectors (PID) for VOCs, electrochemical cells for toxic gases (H₂S, NH₃, Cl₂, HCN), catalytic bead or NDIR sensors for combustibles (CH₄, H₂), and tunable diode laser absorption spectroscopy (TDLAS) for long-path detection of specific compounds.
What it contributes: Confirms that a chemical release is occurring, identifies the substance or substance class, measures concentration at multiple points along the robot's path, and generates a concentration gradient map that indicates the direction of the source. The robot follows the gradient upwind — concentrations increase as it approaches the leak point.
Detects presence and identity. Cannot pinpoint source alone because wind disperses the plume unpredictably.
Sensor types: Long-wave infrared (LWIR, 8–14 μm) for general thermal anomalies and equipment hot spots. Mid-wave infrared (MWIR, 3–5 μm) for hydrocarbon gas visualization (OGI — optical gas imaging). Cooled MWIR detectors for maximum sensitivity on small leaks.
What it contributes: Visualizes the thermal signature of a leak — evaporative cooling at the release point, Joule-Thomson cooling from pressurized gas expansion, or heat anomalies from exothermic reactions. OGI cameras make invisible hydrocarbon plumes visible as shimmering clouds, revealing the exact emission point. Thermal also detects insulation failures, overheating equipment, and flare pilot issues.
Pinpoints location visually on hydrocarbons. Cannot identify the chemical or quantify concentration without gas sensor correlation.
Sensor types: High-resolution RGB cameras with optical zoom (30–40×), pan-tilt-zoom (PTZ) gimbals for targeted inspection, LED illumination for night operations, and AI-powered defect detection trained on corrosion, staining, wet surfaces, frost patterns, and mechanical damage.
What it contributes: Documents the physical evidence: corrosion at a flange, staining below a valve stem, frost formation from a cryogenic release, wet surfaces from liquid leaks, and mechanical damage from vibration or impact. The visual record becomes part of the maintenance ticket — the technician sees exactly what the robot saw before arriving at the job.
Provides evidence and context. Cannot detect invisible gases or quantify concentrations without gas and thermal correlation.
Sensor Fusion
One Sensor Detects. Two Sensors Correlate. Three Sensors Localize.
iFactory integrates multi-sensor robotic data into a unified leak record — gas identity, thermal confirmation, visual evidence, and GPS coordinates — generating a complete maintenance ticket without human interpretation.
The Cross-Sensor Correlation Engine: How Fusion Works
Sensor fusion is not simply displaying three data streams side by side. It is an algorithmic process that correlates signals across modalities to produce a localization confidence score that no single sensor can achieve alone. Here is the five-step process that transforms raw sensor data into a confirmed, localized, ticketed leak.
Gas Detection Triggers the SearchTrigger
During autonomous patrol, the robot's gas sensors detect elevated concentration of a target compound above background threshold. The system logs the GPS position, concentration reading, wind speed and direction (from onboard anemometer), and timestamp. This is the trigger event — not yet a confirmed leak, but enough to initiate the localization sequence.
The robot switches from patrol mode to localization mode: reducing speed, increasing sensor sampling rate from 1 Hz to 10 Hz, activating the thermal camera, and beginning a systematic crosswind sweep pattern designed to map the concentration gradient across the area.
Gradient Mapping Narrows the ZoneLocalize
The robot executes a crosswind zigzag pattern, recording gas concentration at each GPS position. The correlation engine builds a real-time concentration gradient map — a heat map overlaid on the plant layout showing where concentration is highest. The gradient vector points toward the source. Wind compensation algorithms adjust for measured wind speed and direction, converting the dispersed plume shape back to a probable source zone.
At this stage, the source zone is narrowed from "somewhere in this unit" to "within a 5–15 meter radius of this GPS coordinate." The gas map alone cannot achieve higher precision because turbulent mixing near equipment creates concentration pockets that may not be at the source.
Thermal Imaging Pinpoints the SourceConfirm
Within the 5–15 meter source zone identified by gas gradient mapping, the robot sweeps the thermal camera across all potential leak points: flanges, valve stems, pump seals, instrument connections, and pipe supports. The thermal camera detects the temperature anomaly at the leak point — evaporative cooling (liquid leaks), Joule-Thomson cooling (high-pressure gas), or OGI plume visualization (hydrocarbon gases).
The thermal confirmation narrows the source from "5–15 meter zone" to "this specific flange, valve, or connection." The cross-correlation between gas gradient peak and thermal anomaly location produces a localization confidence score. When both modalities agree on the same point: 95%+ confidence.
Visual Inspection Documents the EvidenceDocument
The robot's PTZ camera zooms to the confirmed leak point and captures high-resolution images showing the physical condition: corrosion, staining, frost, wet surfaces, damaged gaskets, or displaced insulation. AI image analysis classifies the defect type and severity. Multiple angles are captured for the maintenance record.
The visual record serves three purposes: it confirms the physical mechanism (a corroded bolt, a degraded gasket, a cracked weld), it tells the repair technician exactly what they will find, and it provides before-repair documentation that becomes part of the asset's permanent maintenance history.
Automated Ticket Generation in CMMSTicket
The correlation engine packages the complete leak record — gas identity and concentration, thermal image with annotated anomaly, visual photos, GPS coordinates, confidence score, and severity classification — and auto-generates a maintenance work order in the CMMS. The ticket includes: asset identification (mapped to the plant's asset registry by GPS), leak classification (fugitive, process, safety), estimated emission rate, and recommended repair action.
The technician receives the ticket on their mobile device with navigation to the exact location, the thermal image showing the leak point, the visual photo showing the component condition, and the repair recommendation. Average time from detection trigger to dispatched ticket: under 20 minutes. Average time from ticket receipt to repair start: under 1 hour. Sign up free to see how robotic sensor data auto-generates prioritized leak repair tickets in the CMMS.
Leak Classification: How Severity Determines Response
Not every detected leak requires the same response. The robotic system classifies each confirmed leak into severity tiers that determine the urgency of the maintenance ticket, the required response timeline, and the regulatory reporting obligation. The classification uses three inputs: gas concentration at the source, emission rate estimate, and chemical toxicity or flammability rating.
High Toxicity / Flammability
Low Toxicity / Flammability
High Emission Rate
Critical — Immediate Response
Emergency shutdown assessment. Automatic CMMS ticket at highest priority. Area evacuation if concentration exceeds IDLH. Repair within shift or emergency isolation.
Priority ticket generated. Technician dispatched within 2 hours. Leak may not be immediately dangerous but emission rate exceeds regulatory thresholds or creates nuisance.
Steam leaks · N₂ purge losses · Large VOC fugitives · Cooling water spray
Low Emission Rate
Medium — Scheduled Repair
Standard ticket at medium priority. Repair scheduled for next planned maintenance window or turnaround. Monitoring frequency increased until repair. LDAR documentation generated.
Small H₂S weep · Minor NH₃ · Low-concentration VOC fugitive emissions
Low — Monitor and Batch
Ticket generated at low priority. Batched with other minor repairs for next maintenance opportunity. Monitored for progression during subsequent patrols.
Trace VOC at flanges · Minor steam wisps · Instrument air · N₂ blanket seepage
Source Mapping: From Point Detection to Plant-Wide Intelligence
Individual leak detection is valuable. Plant-wide source mapping is transformational. When robotic patrol data accumulates over weeks and months, the CMMS builds a comprehensive leak history map that reveals patterns invisible to point-in-time inspections: chronic leak zones, equipment types with recurring failures, seasonal patterns tied to thermal cycling, and correlation between process conditions and emission events.
Heat Maps
Chronic Leak Zone Identification
Overlay all leak detections on the plant layout over 6–12 months. Zones with recurring leaks across multiple patrols indicate systemic issues: piping material degradation, thermal expansion stress, vibration from adjacent equipment, or design flaws in the original construction. These zones receive targeted capital investment rather than repeated corrective repairs.
Patterns
Equipment Class Failure Analysis
When the same valve type, gasket material, or flange rating appears repeatedly in the leak database, the CMMS identifies the equipment class as a systemic failure source. This triggers procurement changes (better gasket material), design modifications (higher-rated flanges), or PM frequency adjustments — addressing the root cause rather than individual symptoms.
Trends
LDAR Compliance Intelligence
EPA Method 21 and LDAR regulations require documented monitoring of fugitive emission sources. The robotic patrol data auto-generates the monitoring records, leak/no-leak determinations, repair documentation, and first-attempt/final-repair timestamps that LDAR programs require — eliminating the manual data collection that consumes 2–4 FTE at large chemical facilities.
Financial Impact: What Robotic Localization Saves
Annual value — large chemical complex, 300+ acres, 10,000+ potential leak sources
$2.4M
Labor recovery from eliminating false positive investigations and reducing locate time by 90%
$4.8M
Incident prevention from early detection of leaks that would have escalated to process safety events
$1.6M
Product loss prevention from detecting and repairing leaks before cumulative losses compound
$800K
LDAR compliance automation replacing 2–4 FTE of manual monitoring and documentation labor
Total Annual Value
$9.6M
Robot fleet investment: $1.2M–$2.5M · CMMS integration: included · Payback: 3–6 months · ROI: 4–8× year one
Detect. Localize. Document. Ticket. Repair. — All Before the Old System Would Have Found the Source.
iFactory integrates robotic multi-sensor leak data into automated maintenance workflows — generating prioritized repair tickets with GPS coordinates, thermal evidence, gas identity, and visual documentation. The technician arrives at the flange, not the general area.
Implementation: From First Patrol to Full Integration
Wk 1–4
Wk 5–8
Wk 9–12
Wk 13+
Phase 1: Route Mapping and Sensor Calibration
Map patrol routes across all units. Calibrate gas sensors to site-specific compounds. Establish thermal baselines. Connect robot data pipeline to CMMS asset registry.
Which robot platforms support multi-sensor leak localization?
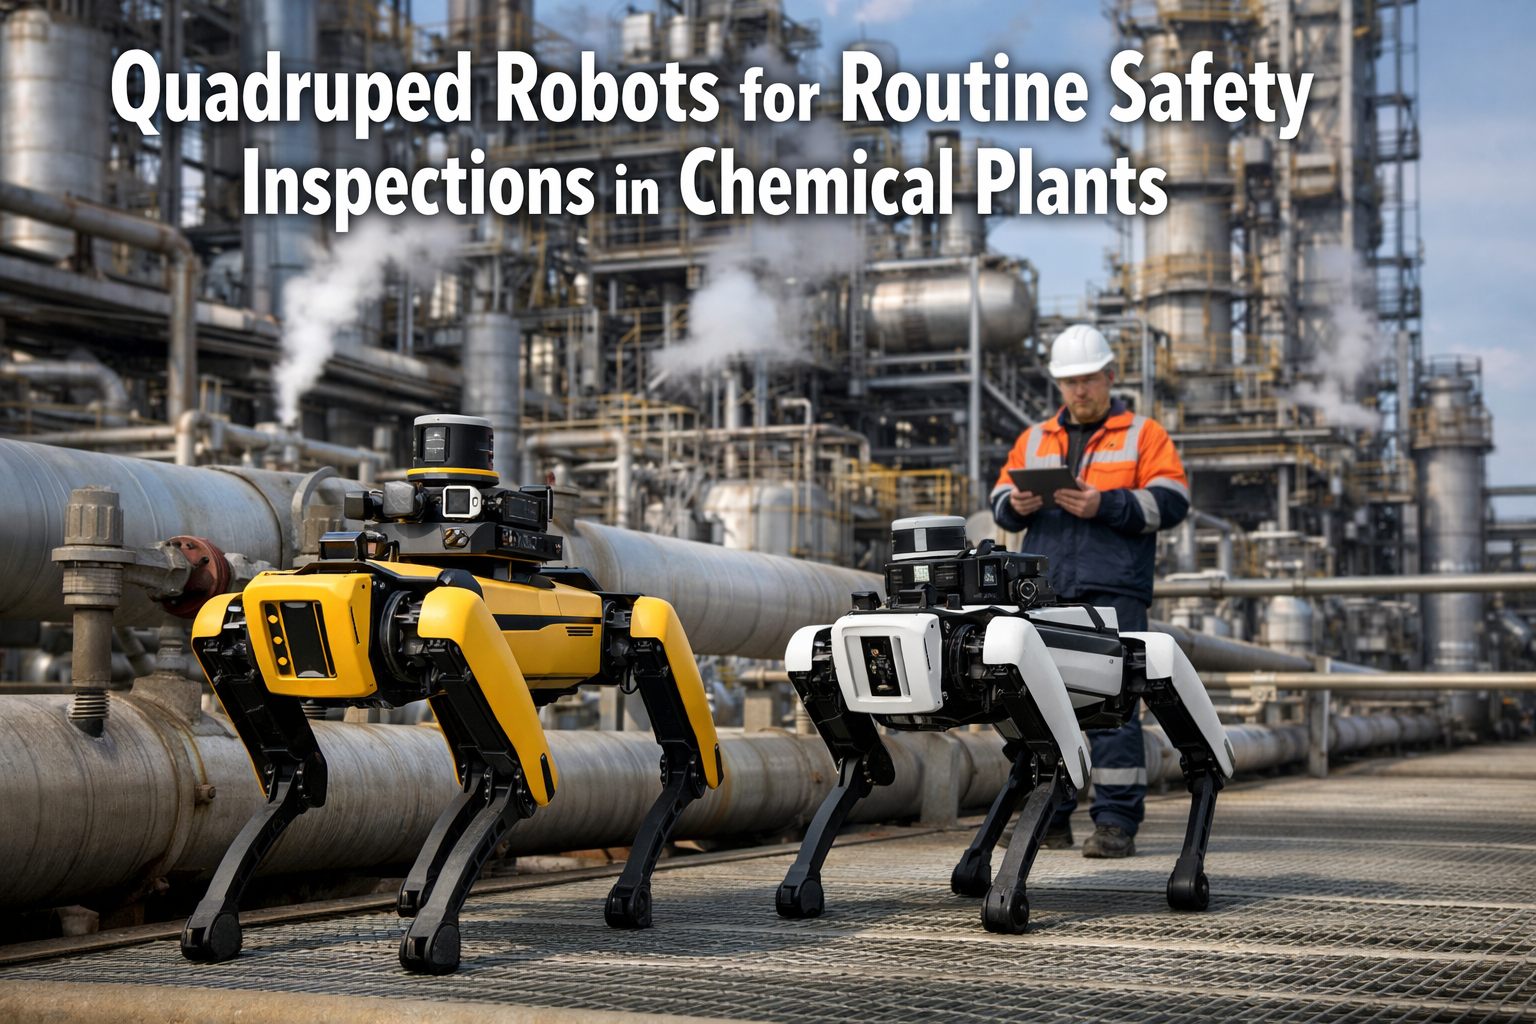
iFactory integrates with major inspection robot platforms including Boston Dynamics Spot, ExRobotics ExR-2, Clearpath Robotics Husky, ANYbotics ANYmal, and custom-built ATEX/IECEx-certified platforms. The CMMS integration layer is robot-agnostic — any platform that outputs gas concentration, thermal imagery, and visual data via standard APIs (ROS, MQTT, REST) can feed the iFactory ticket generation pipeline. The robot choice depends on your site: Ex-rated zones require ATEX-certified platforms, outdoor pipe racks favor wheeled platforms, and congested process areas benefit from legged robots that navigate stairs and obstacles.
How does the system handle wind variability during gas gradient mapping?
The robot carries an onboard ultrasonic anemometer that measures wind speed and direction at 10 Hz during the localization sweep. The correlation engine applies a Gaussian plume dispersion model — adjusted for local turbulence from equipment and structures — to back-calculate the probable source location from the measured concentration field. In moderate wind (2–8 m/s), the gradient mapping is highly effective. In very low wind (under 1 m/s), the plume pools near the source, making localization easier. In very high wind (over 12 m/s), the plume disperses rapidly and localization relies more heavily on thermal confirmation. The fusion algorithm weights each modality based on current conditions.
Can robotic patrols replace LDAR manual monitoring entirely?
In many jurisdictions, EPA Alternative Work Practices (AWP) allow OGI-based monitoring to substitute for Method 21 handheld monitoring on a defined schedule. Robotic OGI patrols can satisfy AWP requirements when the robot carries a compliant MWIR camera and the patrol frequency meets or exceeds the regulatory minimum. However, some components in LDAR programs still require Method 21 quantification for repair verification. The practical approach is robotic patrols for routine monitoring (replacing 80–90% of manual LDAR labor) with targeted Method 21 measurements for repair confirmation and regulatory close-out. Book a demo to see how the CMMS generates LDAR-compliant documentation from robotic patrol data.
What accuracy should we expect from the cross-sensor correlation?
With all three modalities operational and properly calibrated, the system achieves 92–97% true positive rate (confirmed leaks that are actually leaking) and under 5% false positive rate (alerts that turn out not to be leaks). Localization precision is typically within 1–3 meters of the actual source, which is sufficient to identify the specific component (flange, valve, fitting) in most process plant configurations. Accuracy improves over time as the AI learns site-specific patterns: background concentration baselines, normal thermal signatures, and equipment-specific visual markers.
How does the automated ticket integrate with our existing maintenance workflow?
The robot-generated ticket enters the CMMS as a standard work order with additional sensor data fields: GPS coordinates, gas identity and concentration, thermal image, visual photos, confidence score, and severity classification. From that point, it follows the same workflow as any other work order — priority scoring, approval routing (if required by your tier configuration), technician assignment based on skill and location, mobile dispatch, field execution with before/after documentation, and closure with root cause recording. The only difference is that the ticket arrives pre-populated with diagnostic evidence that would normally take a technician 2–3 hours to gather manually.