Warehouse Automation Equipment Reliability The AI analytics Playbook
By Arel Dixon on May 27, 2026
Warehouse automation delivers its promised ROI on exactly one condition: the equipment runs. A cross-belt sorter that achieves 98% uptime generates the throughput projections that justified the capital investment. The same sorter at 91% uptime has already erased the ROI case — and in a high-throughput delivery environment where every percentage point of uptime maps directly to SLA performance and carrier penalty exposure, the difference between 98% and 91% isn't an operational inconvenience. It is a financial crisis that compounds through every peak season. The challenge facing warehouse and delivery operations leaders in 2026 is not a shortage of automation — it is a shortage of intelligence about that automation. High-throughput facilities deploy sorters, conveyors, autonomous mobile robots, goods-to-person systems, and palletizing cells at scale, then manage their reliability with maintenance intervals designed for simpler equipment and manual inspection rounds that cannot keep pace with the failure rate of complex automated systems. AI-driven analytics changes this equation fundamentally: every motor current signature, every vibration trend, every cycle count, and every temperature reading from every automated asset feeds a continuous reliability model that detects degradation weeks before failure, schedules interventions before SLA impact occurs, and builds the asset intelligence database that progressively improves maintenance precision across the entire fleet. iFactory AI's predictive maintenance and analytics platform is built specifically for high-throughput warehouse automation — delivering the reliability intelligence that keeps sorters sorting, conveyors conveying, and robotics producing through every peak window. To see how the playbook applies to your specific automation fleet, Book a Demo with iFactory AI's warehouse reliability engineering team.
Warehouse Automation Equipment Reliability: The AI Analytics Playbook
Automation only delivers ROI when it runs. iFactory AI's analytics platform keeps sorters, conveyors, and robotics at peak reliability in high-throughput warehouse delivery environments — turning sensor data into the maintenance intelligence that prevents the failures that break SLA performance.
Warehouse automation equipment operates under conditions that make calendar-based maintenance intervals structurally inadequate. A cross-belt sorter running 20 hours per day during peak season accumulates component wear at a rate that has no relationship to the calendar month. A conveyor drive motor running peak throughput at 95°C ambient accumulates bearing fatigue at multiples of its nameplate specification. And the autonomous mobile robot fleet that runs 24/7 across a 250,000 sq ft fulfillment center generates failure modes that inspection-interval PM programs simply cannot detect before the failure occurs.
Fixed Intervals Miss Variable Wear Rates
A sorter drive motor accumulates more wear in 4 weeks of peak-season 20-hour operation than in 12 weeks of off-peak 8-hour operation. Calendar-based PM intervals set for average load create two simultaneous problems: over-maintenance during slow periods (unnecessary cost) and under-maintenance during peak periods (unacceptable failure risk). AI analytics adjusts maintenance timing to actual accumulated wear, not elapsed calendar time.
3–4× difference in wear accumulation rate between peak and off-peak operation on the same equipment
Failure Modes Invisible to Inspection Rounds
The failure modes most likely to cause unplanned downtime in warehouse automation — bearing raceway fatigue, winding insulation degradation, belt splice elongation, and gearbox micropitting — are invisible to visual inspection until they are hours away from failure. A technician walking the conveyor at 06:00 cannot see the bearing that will fail at 14:00 during peak sort. Vibration spectral analysis running continuously sees it six weeks earlier.
85% of catastrophic automated equipment failures show no visual warning sign in the 24 hours before failure
No Failure Pattern Learning Across the Fleet
A facility operating 200 conveyor zones and 500 AMRs is generating failure pattern data that could progressively improve maintenance precision across the entire fleet — if it is captured and analyzed. Without analytics infrastructure, each failure is an isolated event. With AI analytics, each failure becomes a training point that improves the prediction model for every equivalent asset in the fleet, progressively reducing MTBF degradation over time.
20% of automated assets typically account for 80% of unplanned downtime — invisible without fleet-wide analytics
Peak Season Risk Concentration
Warehouse automation reliability risk is not distributed evenly across the year — it concentrates in the 8–12 weeks of peak season when throughput is highest, maintenance windows are shortest, and the cost of every downtime hour is multiplied by peak-season SLA penalties. Calendar-based PM programs have no mechanism to increase intervention frequency or sensitivity during this window. AI analytics does — alerting to degradation earlier when operational context indicates peak loading.
60% of annual SLA penalty exposure for U.S. fulfillment operations concentrates in the Q4 peak season window
The Reliability Analytics Principle: Condition, Not Calendar
The fundamental shift in warehouse automation reliability management is from time-based maintenance to condition-based maintenance. Time-based maintenance maintains equipment on a schedule that is correct on average and wrong in every specific case — over-maintaining healthy equipment and under-maintaining degraded equipment simultaneously. Condition-based maintenance, driven by continuous AI analytics on sensor data, maintains equipment when its condition indicates it needs maintenance — not before, and not after. For high-throughput warehouse automation where every unnecessary PM incursion costs throughput and every missed degradation event costs SLA performance, this shift from calendar to condition is the entire playbook.
The AI Analytics Stack for Warehouse Automation Reliability
iFactory AI's reliability analytics platform for warehouse automation delivers six integrated analytical capabilities that together convert raw equipment sensor data into actionable maintenance intelligence. Each capability addresses a specific gap in how high-throughput warehouse operations currently manage automated equipment reliability.
Vibration Spectral Analysis
Continuous FFT analysis on drive motor and gearbox vibration signatures detects bearing defect frequencies (BPFO, BPFI, BSF, FTF) 6–8 weeks before audible symptoms or thermal elevation. The earliest indicator of bearing failure is always in the frequency domain — iFactory AI's analytics engine monitors it continuously on every connected asset.
Predictive Maintenance
Motor Current Signature Analysis (MCSA)
Current waveform analysis on conveyor and sorter drive motors detects rotor bar failures, stator winding degradation, mechanical looseness, and belt load anomalies from the existing motor control panel current signal — no additional sensors required on facilities with accessible MCC panels. MCSA provides earlier warning than temperature monitoring for electrical failure modes.
Analytics Reporting
Thermal Analytics
Infrared temperature monitoring on motor housings, gearboxes, VFD panels, and conveyor drive assemblies provides the confirmatory signature that combines with vibration and current data to increase diagnostic confidence. Thermal runaway in VFDs serving high-cycle conveyor zones is one of the highest-consequence failure modes in automated warehouses — detected weeks earlier through thermal trend analysis.
Predictive Maintenance
Cycle Count & Throughput Wear Modeling
Every automated component has a finite design life measured in cycles, not calendar time. iFactory AI's wear modeling accumulates actual cycle counts from WCS/WMS data and equipment counters, calculates remaining useful life against component design specifications, and generates maintenance recommendations calibrated to actual accumulated wear rather than elapsed calendar time — the correct model for high-throughput automation.
Enterprise Asset Management
Fleet Failure Pattern Recognition
Across a fleet of 200 conveyor zones and 500 AMRs, failure events on any individual asset update the predictive model for every equivalent asset in the fleet. iFactory AI's fleet analytics identifies which asset cohorts are approaching similar failure modes, which maintenance interventions resolved the preceding pattern on equivalent assets, and which parts should be pre-staged for the next intervention wave — progressively improving maintenance precision across the entire fleet.
Analytics Reporting
Operational Context Awareness
iFactory AI's analytics engine ingests throughput data from the WCS and WMS alongside sensor streams, giving the predictive model operational context — so a vibration increase during a 120% throughput peak day is interpreted differently from the same vibration increase during a standard operating day. Alerts are calibrated to context, not to absolute thresholds that generate noise during peak loading and miss genuine degradation during low-throughput periods.
Production Monitoring
Want to see how iFactory AI's reliability analytics applies to your specific sorter, conveyor, and robotics fleet? Book a Demo — we configure demonstrations for your specific equipment classes and failure mode profile.
Equipment-Specific Analytics: The Failure Mode Map for High-Throughput Warehouse Automation
Each category of warehouse automation equipment has a characteristic failure mode profile — the set of failure modes that account for the majority of unplanned downtime events in high-throughput operations. The analytics strategy that maximizes reliability for each equipment class is different, because the failure physics are different. iFactory AI configures analytics per equipment class rather than applying a generic sensor-and-threshold approach that misses the specific failure modes that actually cause downtime in each asset category.
Equipment Class 01
Cross-Belt & Tilt-Tray Sorters
Top 3 Failure Modes
1Carrier drive belt elongation and slip — detectable through cycle time trend analysis and drive motor current increase before belt failure
2Divert mechanism actuator wear — detectable through actuation time trending and sorter throughput accuracy degradation metrics
3Induction motor bearing fatigue — earliest indicator in vibration frequency spectrum at bearing defect frequencies 6–8 weeks before failure
Analytics Approach
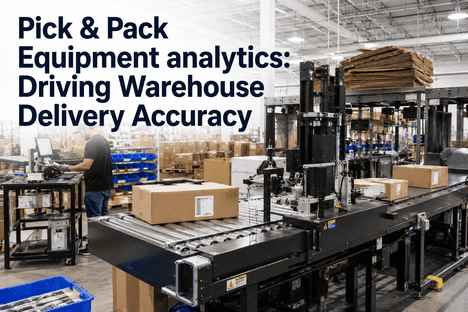
Vibration monitoring on all drive motors plus cycle time analytics from WCS throughput data. Sorter throughput accuracy trends detect divert mechanism degradation before it causes mis-sorts. Drive current trending confirms belt load changes consistent with elongation.
Vibration AnalysisCycle Time TrendingCurrent Monitoring
Equipment Class 02
Conveyor Systems (Belt, Roller, Overhead)
Top 3 Failure Modes
1Drive motor bearing failure — highest-frequency failure mode in conveyor systems, detectable 4–8 weeks early through vibration spectral analysis on bearing defect frequencies
2Belt splice failure — detectable through tension monitoring and belt stretch trending from encoder-based speed comparison across zones
3VFD thermal failure on high-duty zones — detectable through thermal monitoring on drive panels, confirmed by current harmonic analysis
Analytics Approach
Vibration sensors on all drive motor housings feeding continuous FFT analysis. Thermal monitoring on VFD panels for high-duty zones. Zone-by-zone speed comparison through existing encoder data identifies belt elongation trends before splice failure. Current monitoring provides MCSA without additional hardware on facilities with accessible MCC.
FFT VibrationThermal MonitoringMCSA
Equipment Class 03
Autonomous Mobile Robots (AMRs & AGVs)
Top 3 Failure Modes
1Drive wheel and caster wear — detectable through navigation accuracy degradation, drive motor current increase, and floor scan pattern changes in LiDAR data
2Battery degradation below capacity threshold — detectable through cycle capacity trending and charge time elongation in battery management system data
3Lift mechanism hydraulic or actuator wear — detectable through cycle time trending and load cell reading drift on goods-to-person variants
Analytics Approach
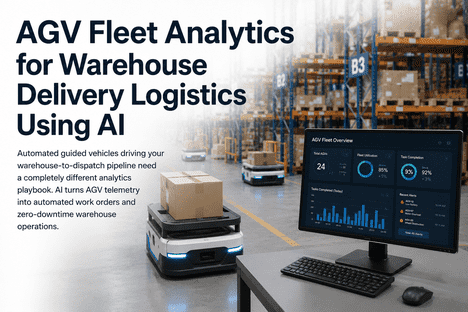
iFactory AI integrates with the AMR fleet management system to extract mission cycle data, battery capacity curves, and navigation error rates. Fleet-wide analytics identifies which units are approaching maintenance thresholds and pre-stages interventions during low-utilization windows rather than waiting for failure during peak sort.
1Shuttle rail and wheel wear — detectable through positioning accuracy drift in AS/RS shuttle encoders and vibration increase during travel cycles
2Hoist motor and brake wear — detectable through hoist cycle time trending, brake application current signature, and positioning overshoot metrics
3Conveyor-to-AS/RS interface jams — detectable through throughput throughput accuracy trends and E-stop frequency analytics on interface zones
Analytics Approach
Primary data source is the AS/RS WCS control system — iFactory AI extracts cycle data, positioning accuracy metrics, and drive current data through OPC-UA or direct controller integration. Supplemental vibration sensors on hoist motors and shuttle drives add the spectral dimension that control system data cannot provide.
1Servo drive and gearbox wear — detectable through joint torque ripple analysis, cycle time elongation, and position error trending in robot controller data
2Gripper and end-effector wear — detectable through pick success rate trending and vacuum pressure decay analysis on suction-cup configurations
3Vision system calibration drift — detectable through pick accuracy trending and calibration check frequency analysis
Analytics Approach
Robot controller data — torque profiles, position errors, cycle times, and pick success rates — is the primary reliability signal for robotic cells. iFactory AI integrates with robot controllers through OPC-UA or direct PLC feeds to extract these signals continuously. Cycle count wear modeling calculates remaining joint service life against manufacturer specifications.
Deploy AI Reliability Analytics Across Your Warehouse Automation Fleet
iFactory AI's reliability engineering team configures analytics deployments for high-throughput warehouse automation across e-commerce fulfillment, 3PL distribution, parcel sortation, cold chain, and retail distribution. We understand the peak-season uptime pressure, the SLA exposure of every downtime hour, and the equipment-specific failure mode profiles that determine what analytics actually prevents failures in each asset class.
The Reliability Analytics Workflow: From Sensor Signal to Maintenance Action
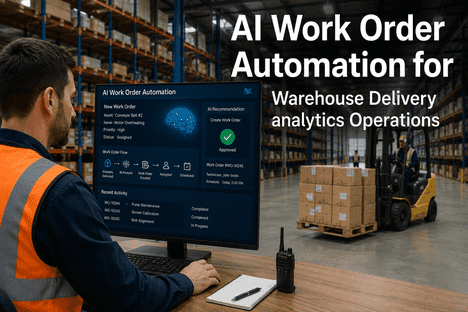
The operational value of AI reliability analytics is not in the alerts — it is in the full workflow from signal to action. An alert that reaches a maintenance team without a parts-ready, technician-assigned, window-scheduled work order produces half the reliability improvement of one that does. iFactory AI's platform closes every step of the workflow from sensor data to completed intervention.
01
Continuous Sensor Monitoring
Vibration, current, temperature, and operational data streams from every automated asset into iFactory AI's edge analytics engine at configurable sampling rates — from 1-second cycle data to 1kHz vibration sampling on critical drive assets.
02
AI Anomaly Detection
Machine learning models trained on equipment-class failure signatures evaluate every data point against learned normal operating patterns. Anomalies trigger confidence-scored alerts classified by failure mode type and estimated time-to-failure based on degradation trajectory.
03
Automated Work Order Generation
Predictive alert triggers automatic work order creation — populated with asset ID, fault classification, sensor evidence, repair history, required parts from the CMMS inventory, and the maintenance window recommendation aligned to WCS throughput forecasts.
04
Planned Intervention & Verification
Technician executes the intervention in the scheduled window with parts pre-staged and complete repair context on the mobile app. Post-intervention sensor confirmation verifies the repair resolved the anomaly — closing the feedback loop that improves future alert accuracy.
Expert Perspective
The assumption that automation solves reliability is one of the most expensive mistakes I see in warehouse operations. Automation changes the reliability problem — it doesn't eliminate it. When you were operating a manual pick operation and someone called in sick, you found a replacement. When your sorter goes down during Black Friday peak, the whole facility stops. The consequence profile is completely different. That asymmetry is why AI reliability analytics has a higher ROI in automated warehouses than almost anywhere else in industrial operations. The cost of an avoided sorter failure during peak is not just the repair bill — it's the SLA penalties, the overtime labor, the carrier fees, and the customer satisfaction impact, all in the same event window. I have seen facilities where a single avoided sorter failure during Q4 paid for three years of analytics platform costs. The math only works if the analytics actually predicts the failure early enough to intervene — which means vibration monitoring starting six to eight weeks out, not a temperature alarm when the motor is already in thermal runaway. Get the sensor depth right, integrate with your WCS so the model has operational context, and connect alerts directly to work orders so the right parts are staged before the technician leaves the maintenance room. That's the playbook. Everything else is just dashboard decoration.
— Director of Automation Engineering, U.S. National Fulfillment Network · 19 Years Warehouse Automation & Maintenance · Former Head of Reliability, Fortune 500 E-Commerce Operations · Certified Reliability Engineer (CRE), ASQ · CMRP
What High-Throughput Warehouse Operations Achieve with iFactory AI Reliability Analytics
70%+
Unplanned Downtime Reduction
AI anomaly detection converts unplanned emergency failures into planned interventions scheduled in low-throughput windows — eliminating the peak-season failure events that drive the largest SLA penalty exposure
30%
Maintenance Cost Reduction
Condition-based maintenance eliminates unnecessary PM incursions on healthy equipment while ensuring degraded equipment is caught earlier — reducing both over-maintenance cost and emergency repair cost simultaneously
6–8 wks
Advance Warning Window
Vibration spectral analysis detects bearing and drive failures 6–8 weeks before failure — sufficient time to order parts, schedule the window, and complete the intervention without disrupting operations
<12 mo
Platform ROI Achieved
SLA penalty avoidance from prevented peak-season failures, maintenance cost reduction, and parts inventory optimization typically return the analytics platform investment within the first year
Conclusion: Automation ROI Requires Reliability Intelligence
Warehouse automation capital investment is justified on uptime assumptions that calendar-based maintenance cannot reliably deliver. The sorter that runs at 98% uptime validates the ROI model. The sorter that fails during Q4 peak at 91% uptime erases it — and the financial consequence of a single multi-hour sorter failure during peak season can exceed the annual cost of the analytics platform that would have prevented it. The AI reliability analytics playbook for high-throughput warehouse automation is not complex in principle: deploy the right sensors for each equipment class, connect them to an analytics engine with models trained on the specific failure modes that cause downtime in warehouse automation, integrate alerts with automated work order creation so the path from detection to intervention is measured in minutes rather than days, and connect the whole system to operational context from the WCS so maintenance decisions are calibrated to actual throughput load rather than abstract thresholds. iFactory AI's platform delivers this playbook as an integrated operational system — not as a sensor project, not as a dashboard initiative, and not as a consulting engagement. It is the reliability infrastructure that makes warehouse automation ROI real rather than projected.
iFactory AI for Warehouse Automation Reliability — The Full Playbook
Vibration spectral analysis. Motor current signature analytics. Thermal monitoring. Cycle count wear modeling. Fleet failure pattern recognition. Automated work orders. Parts pre-staging. iFactory AI delivers the complete AI reliability analytics platform that keeps high-throughput warehouse automation running through every peak window — and makes the automation investment ROI case hold.
Does iFactory AI integrate with our existing WCS, WMS, and sorter control systems?
Yes — WCS and WMS integration is a core capability of iFactory AI's warehouse automation reliability platform. The analytics engine integrates with major warehouse control systems including Honeywell Intelligrated, Dematic, Vanderlande, Knapp, and SSI Schaefer through OPC-UA, OPC-DA, and direct API integrations. WMS integrations cover Manhattan Associates, Blue Yonder (JDA), Oracle WMS Cloud, SAP EWM, and others. The operational context provided by WCS throughput data — actual parcel count per zone, cycle rates, sort accuracy metrics — is what allows iFactory AI's anomaly detection to distinguish genuine degradation signals from normal operating variation during peak loading. This operational context integration is what separates the platform from standalone sensor systems that generate noise during peak operation because they lack throughput context. Book a Demo to discuss the specific integration path for your control systems.
How long does it take for the AI anomaly detection models to become accurate on our specific equipment?
iFactory AI's anomaly detection models use a combination of pre-trained equipment-class models and facility-specific calibration to deliver reliable anomaly detection faster than a pure machine learning approach that requires extensive historical failure data before it can function. Equipment-class models for cross-belt sorters, conveyor systems, AS/RS, and AMR fleets are pre-trained on the characteristic failure mode signatures of each equipment type — so basic anomaly detection is functional from the first week of data collection. Facility-specific calibration, which refines alert thresholds to the specific operating conditions, loading profiles, and environmental context of your installation, typically stabilizes within 30–60 days of continuous operation. After the first actual maintenance intervention that confirms a predicted failure, the model accuracy improves significantly for that asset class. Most facilities reach stable, low-noise anomaly detection with high predictive confidence within the first 60–90 days of deployment.
What sensors are required, and can iFactory AI use data from sensors already installed on our automation equipment?
iFactory AI is designed to maximize the use of sensor data and operational signals already available from existing automation equipment before adding new hardware. Many warehouse automation systems already provide useful reliability signals through their existing controllers: motor current data from MCC panels, positioning error rates from sorter and AS/RS controllers, cycle times from WCS, and battery management data from AMR fleet systems. iFactory AI's analytics engine ingests these existing signals first. New sensor hardware — vibration sensors on drive motor housings, thermal sensors on VFD panels, and supplemental current clamps on motors not covered by existing instrumentation — is added where the highest-consequence failure modes are not covered by existing data. The implementation team conducts a signal inventory during deployment planning to identify what is already available and what additional sensing is required to achieve the target failure mode coverage for your specific equipment fleet.
How does iFactory AI handle peak season — does the analytics platform create more alerts or false alarms during high-throughput periods?
This is one of the most important design requirements for warehouse automation analytics, and it is why operational context integration with the WCS is not optional — it is essential. A vibration increase during a 130% throughput peak day is expected behavior; the same vibration increase during a standard 85% throughput day is a degradation signal. A system that applies static thresholds without operational context will generate significant false-alarm noise during peak loading, training maintenance teams to ignore alerts exactly when they matter most. iFactory AI's anomaly detection normalizes sensor signals against current operational loading before evaluating anomaly status — so alert thresholds scale with throughput context. During peak season, the system is actually more sensitive to genuine degradation signals because it can distinguish load-driven variation from condition-driven variation more clearly with WCS throughput data in the model. Book a Demo to see the operational context architecture in detail.
Can iFactory AI's analytics platform manage both the fixed automation (sorters, conveyors) and the mobile fleet (AMRs, forklifts) in the same system?
Yes — unified fleet management across fixed automation and mobile equipment is a core design goal of iFactory AI's platform, specifically because the maintenance team managing conveyor reliability is often the same team managing the AMR and forklift fleet. Separating these into different systems creates coordination overhead and data silos that reduce maintenance efficiency. iFactory AI's CMMS and analytics modules manage fixed conveyor and sorter assets alongside AMR fleets, electric forklift fleets, and manual handling equipment in a single asset registry with unified work order management, parts inventory, and analytics dashboards. Fleet-wide analytics — which assets are driving disproportionate downtime, which failure modes are recurring, which parts should be pre-staged — are available across all asset classes in the same reporting environment. The analytics models are equipment-class-specific under the hood but visible through a unified operational interface that maintenance managers and operations leaders use to see the full facility reliability picture in one place.