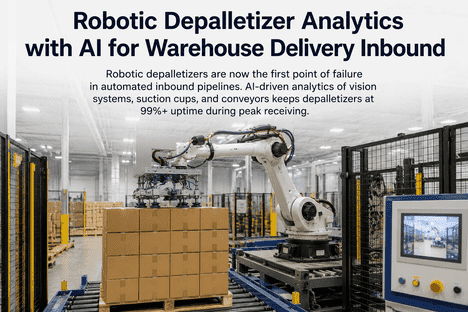
Robotic depalletizers are the first mechanical bottleneck in any automated inbound pipeline. When a vision system miscalibrates, a suction cup degrades, or a conveyor misfeeds during peak receiving, the entire inbound dock stops not just the depalletizer cell. AI-driven analytics changes this from a reactive firefight into a predictable, manageable process. This guide covers how to monitor, maintain, and optimize robotic depalletizer systems using real-time sensor data, AI anomaly detection, and structured maintenance protocols integrated through iFactory's platform.
Robotic Depalletizer Analytics with AI for Warehouse Delivery Inbound
AI-driven monitoring of vision systems, suction cup integrity, conveyor health, and robot arm performance keeps depalletizers at 99%+ uptime during peak receiving windows — without waiting for a failure to tell you something is wrong.
Why Depalletizer Downtime Hits Harder Than Any Other Inbound Failure
A robotic depalletizer sits at the entry point of every automated inbound workflow. It is not a standalone machine — it is the gate that controls whether your receiving dock, sorter, conveyor network, and put-away system all operate at capacity or sit idle. A single unplanned depalletizer stop during a high-volume receiving window creates a cascade: trucks queue at dock doors, sorters starve for input, and labor is scrambled to cover the gap manually usually at three times the normal handling cost per unit.
The failure modes that cause these stops are not random. Suction cup vacuum decay follows a measurable curve. Vision system calibration drift produces increasingly frequent pick errors before full failure. Robot joint wear shows up in cycle time variance weeks before a fault code appears. AI-based analytics running on iFactory's platform detects these precursor signals and triggers corrective action before the depalletizer goes down — during planned maintenance windows, not during a 400-pallet truck arrival.
AI Analytics for Depalletizer Vision System Health
The vision system is the brain of a robotic depalletizer. A 3D camera or structured-light sensor generates the pick coordinates that tell the robot arm exactly where to place the end-of-arm tool for each case, tote, or layer. When the vision system drifts — through lens contamination, thermal shift, or software parameter decay — pick errors increase before any fault code appears. iFactory tracks the following vision system health indicators in real time.
Suction Cup and Vacuum System Analytics
Suction cup degradation is the single most common cause of mid-transfer drops and pick cycle interruptions in robotic depalletizer systems. Cup lip seals crack under UV exposure and thermal cycling. Vacuum pump performance declines as filter elements load and wear accumulates. iFactory monitors the full vacuum circuit — from pump output through manifold to individual cup performance — and predicts replacement intervals based on actual decay rates, not fixed schedules.
Robot Arm Joint and Drive System Analytics
A 4-axis or 6-axis articulated robot arm in a depalletizer application operates within micron-level positional tolerances across thousands of pick cycles per shift. Harmonic drive gear wear, encoder drift, and joint lubrication degradation accumulate invisibly — producing cycle time variance and minor positional error long before any fault code appears. iFactory's integration with robot arm controllers via OPC-UA and standard industrial protocols captures the data streams needed to detect these failure precursors.
Outfeed Conveyor and Inbound Line Analytics
A depalletizer operating at full performance can still create an inbound bottleneck when the outfeed conveyor feeding cases to the sorter or put-away system is running below capacity. iFactory monitors the full conveyor chain — from pallet infeed through case singulation to the sorter induction point — treating it as a single system rather than isolated mechanical components.
iFactory's Robotics AI module connects directly to your depalletizer PLC, robot arm controller, vision system, and conveyor network via OPC-UA, Modbus, and MQTT — capturing all the data streams in this guide without requiring any hardware modification to your existing systems. Book a demo to see a live depalletizer monitoring dashboard built on actual plant data.
Depalletizer Downtime Reason Code Framework
Unplanned depalletizer stops only become actionable reliability data when they are coded with the right level of specificity. The table below provides a structured three-level reason code hierarchy for robotic depalletizer inbound operations, mapped to the system component and the iFactory module that monitors it.
| Category | Subcategory | Example Specific Codes | System Component |
|---|---|---|---|
| Vision | Camera System | Lens contamination, Calibration drift, Point cloud failure, Ambient light interference | AI Vision Camera |
| EOAT | Vacuum System | Suction cup seal failure, Vacuum pump fault, Zone leak, Filter blockage | Predictive Maintenance |
| EOAT | Tool Changer | Incomplete seating, Electrical contact fault, Mechanical lock failure | Predictive Maintenance |
| Robot Arm | Joint Mechanics | Harmonic drive wear, Encoder drift, Gearbox overtemp, Lubrication fault | Robotics AI |
| Robot Arm | Control System | Controller fault, Servo drive trip, Safety zone violation, E-stop activation | Robotics AI |
| Conveyor | Outfeed Belt | Belt slip, Drive motor fault, Belt tracking error, Jam at transfer point | Production Monitoring |
| Conveyor | Pallet Handling | Elevator positioning error, Pallet sensor miss, Infeed jam, Empty pallet reject | Production Monitoring |
| Inbound Product | Pallet Condition | Unstable load, Mixed SKU pallet, Damaged stretch wrap, Non-standard layer pattern | Shift Logbook |
| Planned | Scheduled Maintenance | Suction cup replacement, Vision calibration, Robot lubrication, Conveyor PM | Planned (Excluded) |
Connect iFactory to Your Depalletizer Cell — No Hardware Changes Required
iFactory integrates with your existing robot arm controller, vision system, PLC, and conveyor drives via standard industrial protocols. Your depalletizer analytics dashboard goes live without replacing or modifying any existing infrastructure.
How to Deploy AI Analytics on Your Depalletizer Fleet
Rolling out AI-based depalletizer monitoring requires a structured four-step approach that starts with data access and ends with closed-loop maintenance workflows. Each step is validated in iFactory's platform before advancing to the next.
Establish Data Connectivity
Connect iFactory to the robot arm controller, vision system PC, vacuum system PLC, and conveyor drives via OPC-UA, Modbus, or MQTT. Verify all target data streams — servo currents, vacuum pressure, camera confidence scores, conveyor motor current — are flowing at the required sample rate (minimum 10Hz for servo and vacuum data).
Capture Healthy Baselines
Run the depalletizer for two weeks after connection with all systems in known-good condition. iFactory builds baseline profiles for each monitored parameter — vacuum decay curve, servo current signature, cycle time per path, TCP position accuracy. These baselines are the reference against which AI anomaly detection operates.
Configure Alert Thresholds and Work Order Triggers
Set deviation thresholds for each parameter using iFactory's threshold configuration module. Define which threshold violations auto-generate work orders in iFactory's maintenance module versus which generate operator notifications. Suction cup vacuum decay and vision confidence drift should be configured as auto-work-order triggers given their direct impact on pick success rate.
Close the Loop with Shift Logbook Integration
Connect iFactory's Shift Logbook to the depalletizer cell so that every AI-generated alert, maintenance action, and downtime event is captured in a structured shift record. This creates the data continuity needed to validate that predictive maintenance interventions are reducing actual downtime — and to refine alert thresholds based on real-world outcomes.
What Inbound Operations Teams Get Wrong About Depalletizer Analytics
The most consistent mistake I see when inbound teams start monitoring depalletizers is treating the robot arm as the primary failure risk and the vision system as background infrastructure. In practice, vision system degradation causes more unplanned stops than all mechanical failures combined — because it fails gradually, through calibration drift and lens contamination, in ways that produce increasing pick errors without triggering any fault code until the system is already in failure.
The second mistake is monitoring each subsystem in isolation. A depalletizer that is generating increasing vacuum retry events and increasing vision retry events simultaneously is not experiencing two independent problems — it is telling you that a single root cause, usually a product condition change like a new SKU with a different case surface texture, is stressing both systems. iFactory's cross-correlation engine identifies these multi-system patterns automatically, which is something a single-subsystem monitoring approach can never surface.
The facilities that achieve 99%+ depalletizer availability consistently are the ones that treat the depalletizer, conveyor, and vision system as a single monitored system — and that build the maintenance response workflow into iFactory so that when an alert fires, the technician already has the specific component, the diagnostic procedure, and the replacement part information on their mobile device before they walk into the cell.
iFactory Modules Active in a Depalletizer Analytics Deployment
A complete depalletizer AI analytics deployment in iFactory activates several integrated platform modules working as a connected system — not as standalone tools. The table below maps each module to its specific function in the depalletizer monitoring workflow.
| iFactory Module | Function in Depalletizer Analytics | Key Output |
|---|---|---|
| Robotics AI | Robot arm servo current analysis, joint temperature monitoring, TCP drift detection, harmonic drive wear estimation | Joint-level health scores, predictive replacement intervals, auto-generated inspection work orders |
| AI Vision Camera | Vision system confidence score trending, calibration drift detection, lens contamination index, pick retry rate monitoring | Shift-start calibration alerts, cleaning schedule triggers, vision accuracy trend dashboard |
| Predictive Maintenance | Vacuum pump motor analysis, suction cup decay curve trending, conveyor drive motor health monitoring | Component-level remaining useful life estimates, parts consumption forecasting, PM schedule optimization |
| Production Monitoring | Pallet throughput tracking, conveyor speed monitoring, case presence sensor read rate analytics, accumulation zone fill rates | Real-time inbound throughput dashboard, bottleneck identification, shift performance reports |
| Shift Logbook | Structured shift handover for depalletizer cell, downtime reason code logging, cross-shift issue tracking | Consistent downtime records, shift boundary data continuity, trend-ready reason code database |
| OEE Analytics | Depalletizer availability, performance rate, and quality (pick success rate) tracking as integrated OEE metric | Depalletizer OEE score by shift, line, and product type with drill-down to component-level causes |
Robotic Depalletizer AI Analytics — Common Questions
See iFactory Depalletizer Analytics Running on Live Plant Data
We walk you through a live iFactory instance connected to a real depalletizer cell — showing vision system confidence trending, vacuum decay curves, robot arm health scores, and conveyor throughput analytics updating in real time. No slides. No simulations.