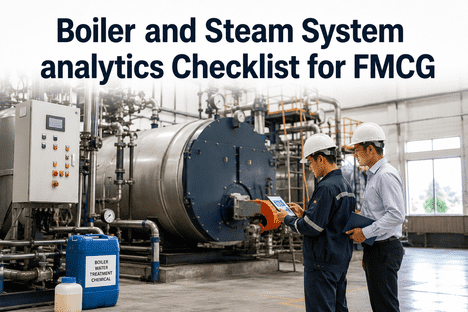
A boiler operating at 82% combustion efficiency today can drop to 68% within six months if steam traps fail, condensate recovery lines degrade, and water chemistry drifts off specification. In FMCG manufacturing where steam powers evaporation, drying, pasteurisation, CIP cleaning, and sterilisation thermal system efficiency is not an energy target; it is a production input.AI analytics transforms boiler and steam system maintenance from a calendar-based inspection routine into a continuously optimised thermal performance programme. Instead of waiting for annual efficiency tests or emergency tube failures, plant teams gain real-time visibility into combustion quality, steam trap health, water chemistry trends, and condensate recovery performance with automated work orders triggered the moment any parameter crosses a threshold that correlates with known failure modes in FMCG thermal systems. This article explains exactly how that works.
Your Boiler Efficiency Data Should Update Every Minute — Not Every Quarter.
iFactory's AI platform continuously monitors combustion efficiency, steam trap performance, water chemistry, and condensate recovery across your FMCG thermal system — delivering live health scores and automated maintenance alerts for every boiler asset.
Of all steam generated is wasted in poorly maintained steam systems — a single failed trap can cost $2,000-$20,000 per year
57%
Of fossil fuel consumption in food processing goes to steam production — making boiler efficiency a direct cost driver for FMCG plants
82%
Of boiler failures are preventable with structured preventive and predictive maintenance — yet most plants still rely on calendar-based inspection cycles
4.8x
Emergency boiler repairs cost 4.8 times more than planned maintenance — AI-driven predictive analytics eliminates the emergency premium
What Boiler and Steam System Analytics Actually Measures
A boiler and steam system analytics platform aggregates continuous sensor data, inspection records, and operational metrics into a composite thermal system health score expressed on a 0–100 scale that maps directly to maintenance priority, energy efficiency, and failure risk. What makes the AI version fundamentally different from conventional boiler logbook monitoring is not the scale it is what feeds into the score, how frequently it updates, and how the weighting between efficiency, safety, and reliability is determined for each boiler asset in your plant.
Conventional Boiler Monitoring vs AI-Driven Thermal Analytics — The Core Differences
How AI Builds the Boiler Health Score: The Six Data Inputs
A meaningful boiler health index is not a single number derived from a single source. AI-generated boiler health scores aggregate six distinct input categories, each contributing a weighted component to the composite index. The weighting between them is not fixed — it is calibrated to the boiler type (fire-tube vs water-tube), fuel used, steam demand profile, and what the historical data shows about which inputs best predict actual failures for that specific boiler asset.
01
Thermal & Temperature
Flue gas temperature, shell surface thermocouples, tube metal sensors, infrared thermography — detecting scale buildup and heat transfer loss
Burner firing rate, air-fuel ratio, runtime hours, blowdown frequency, condensate return temperature — tracking system balance and load patterns
How AI Converts Six Inputs Into One Composite Boiler Health Score
Step 1 — Normalise
Each sensor stream is scaled to a 0–100 range using baseline-normalised scoring. A flue gas temperature of 215°C and a conductivity reading of 3,500 µS/cm become comparable values on the same scale against their optimal operating bands.
Step 2 — Weight
AI assigns dynamic weights based on historical failure data. Combustion parameters may carry 35% weight for a gas-fired fire-tube boiler; water chemistry 30% for a high-pressure water-tube boiler where scaling risk is the dominant failure mode.
Step 3 — Composite
The weighted average produces a composite health score that updates with every new data point — whether that is a temperature reading every 10 seconds or a steam trap survey result every quarter. The score continuously reflects current boiler condition, not last inspection condition.
Live Boiler Health Scoring · Thermal Efficiency Optimisation · Automated CMMS Integration
See a Live Health Score for Every Boiler in Your FMCG Plant — Updated in Real Time.
iFactory aggregates your boiler sensor data, steam trap surveys, water chemistry readings, and SCADA history into a single AI-generated health score per boiler asset — continuously updated and visualised in a dashboard your entire thermal team can read and act on.
Reading the Score: What Each Band Means for Boiler Maintenance Decisions
A boiler health score only creates value if it is translated into clear, actionable maintenance guidance. AI platforms segment the 0–100 scale into condition bands, each mapped to a specific maintenance action — from routine monitoring through to emergency shutdown. The bands are calibrated to reflect both thermal efficiency degradation and mechanical failure risk, using historical failure data from thousands of boiler operating hours across FMCG and process industries.
Score Band
Condition Status
Recommended Action
81 – 100
Excellent
Boiler operating near optimal condition. Combustion efficiency in target range. All parameters within baseline. Steam trap failure rate below 5%.
Continue routine monitoring. Capture trend data for deterioration model refinement.
61 – 80
Good
Minor wear or efficiency drift detected. 1-3% efficiency loss possible. No immediate risk but intervention in this band delivers highest cost-to-benefit ratio.
Schedule inspection in next planned maintenance window. Monitor trend direction.
41 – 60
Fair / Caution
Moderate deterioration confirmed. Efficiency loss 5-10%. Increased monitoring frequency triggered. Steam trap failure rate likely above 10%. Intervention window closing.
Plan intervention within 2-4 weeks. Order spare parts. Prepare detailed diagnostics.
21 – 40
Poor / At Risk
Heavy wear or significant parameter deviations. Efficiency degraded 10-15%+. Failure probability rising sharply. Emergency failure risk elevated.
Schedule intervention within days. Prepare shutdown plan. Escalate to reliability engineering.
0 – 20
Critical / Alarm
Sustained critical deviations. Active fault condition. Continued operation poses safety risk or catastrophic failure risk. Production halt likely.
Immediate shutdown. Emergency maintenance. Capital replacement assessment initiated.
How the Boiler Health Score Communicates to Different Stakeholders
The same underlying boiler health score serves different audiences — and AI platforms present it differently to each. A shift technician needs to know which boiler to inspect today. A maintenance planner needs to know which steam system components will need attention in the next 90 days. A plant engineering manager needs to know where the thermal asset portfolio is heading over the next five years. The boiler health index answers all three questions — from the same data, formatted for the decision each person needs to make.
Audience 01
Shift Technician
Operational — daily decisions
What They See
A ranked list of boiler assets by current health score, with the lowest scores at the top. Each boiler shows its score, rate of recent deterioration, the specific sensor or parameter driving the drop, and an auto-generated work order with the full asset history and recommended corrective action attached.
Outcome: Technicians know exactly which boiler to inspect and what to check — no interpretation required.
Audience 02
Maintenance Planner
Tactical — 30–90 day horizon
What They See
A deterioration trajectory view showing which boilers and steam system components are currently in the Fair band (41–60) and projected to drop below 40 within 60 or 90 days — the intervention window before corrective cost escalates to emergency premium rates. Budget estimates for each intervention are attached.
Outcome: Planners build intervention programmes around assets actually approaching thresholds — not assets due for calendar-based inspection.
Audience 03
Plant Engineering Manager
Strategic — 3–10 year horizon
What They See
A portfolio-level health distribution showing percentage of thermal assets in each condition band today, projected forward 3 and 10 years under current maintenance spend. The AI calculates remaining useful life for each boiler, flags the financial cross-over point where replacement cost beats continued repair, and models the energy cost impact of deferred maintenance.
Outcome: CapEx bids are evidence-based — justified by thermal efficiency ROI data rather than asset age estimates.
"
Steam systems account for 30% of energy use in manufacturing globally, with an estimated 18-20% economic efficiency improvement potential. In food processing specifically, 57% of fossil fuel consumption goes to steam production. Continuous boiler health monitoring through AI-driven analytics is the only scalable way to capture this efficiency gap while simultaneously reducing unplanned downtime.
— U.S. Department of Energy Steam Best Practices; ACEEE / Lawrence Berkeley National Lab Industrial Energy Analysis, 2024
Why the Weighting Logic Is the Most Important Engineering Decision for Boiler Analytics
Two boilers with identical composite scores of 58 can be in completely different actual conditions — if the weighting behind each score is different. A fire-tube boiler scoring 58 where combustion efficiency data carries 40% of the weight is a different risk profile than a water-tube boiler scoring 58 where water chemistry carries 35% of the weight. Getting the weighting right is what separates a useful boiler health index from a number that misleads thermal system planning. AI learns optimal weightings from historical data — specifically from the relationship between input signals and subsequent actual failure events — rather than applying the same formula to every boiler.
Example: How Weighting Differs by Boiler Type and Fuel
Gas-Fired Fire-Tube
Combustion / Flue Gas40%
Water Chemistry20%
Steam Trap Survey20%
Operating Hours / Cycles20%
High-Pressure Water-Tube
Water Chemistry35%
Tube Wall Thickness30%
Thermal / Temperature20%
Vibration / Feed Pump15%
Waste Heat Recovery
Inlet / Outlet Temp Delta45%
Gas Flow Rate25%
Tube Fouling Index20%
Condensate Quality10%
Conclusion
A boiler and steam system health index is only as valuable as the data behind it and the frequency at which it updates. AI-generated boiler health scores replace the quarterly efficiency test and annual steam trap survey with a continuously recalculated composite figure — aggregating thermal data, pressure and flow readings, vibration analysis, water chemistry, acoustic emissions, and SCADA operational data into a single weighted index that is current, auditable, and actionable at every level of an FMCG plant's thermal operations. Shift technicians, maintenance planners, and plant engineering managers all read from the same score — formatted for the decision each needs to make, at the time scale each operates on.
iFactory's AI platform generates live boiler health indices for every thermal asset in your FMCG plant, continuously updated from your existing sensor infrastructure, SCADA systems, and maintenance records. Book a Demo to see a live boiler health score dashboard built on your plant data, or talk to an expert to begin the data onboarding process.
Frequently Asked Questions
For the weighting model to be fully calibrated from your own data, a minimum of 12-24 months of boiler operational data, fuel consumption records, and maintenance history per boiler type is recommended — enough to observe at least one seasonal load cycle and establish baseline operating bands. Where historical data is sparse, iFactory's platform uses pre-trained thermal deterioration models for common boiler types (fire-tube, water-tube, waste heat recovery) as a starting baseline, with the weights transitioning toward your own data as it accumulates. A partially data-calibrated score is still significantly more useful than a quarterly efficiency test snapshot. Book a Demo to assess your boiler data readiness.
Yes. iFactory's platform supports native integration with leading BMS and SCADA systems (Siemens, Rockwell, ABB, Schneider Electric), building management platforms, and CMMS solutions including SAP Plant Maintenance, IBM Maximo, and Infor EAM. Data ingestion can be configured via OPC-UA, Modbus, MQTT, REST APIs, or direct PLC bridge connections. The platform also accepts manual data uploads for plants without existing digital infrastructure. Talk to an Expert to discuss your specific integration environment.
Both. For plants with ultrasonic or acoustic steam trap sensors deployed, the platform ingests continuous trap health data directly — detecting blow-through, blocking, or leakage in real time. For plants relying on periodic steam trap surveys, the platform ingests survey results and uses them as a periodic input that updates the health score at survey frequency. The AI model can also combine both data sources: continuous sensors for high-criticality traps and survey data for the balance of the steam system. This hybrid approach means any FMCG plant can begin steam trap analytics regardless of current sensor infrastructure. Book a Demo to see the steam trap module in action.
Yes. iFactory's boiler health index outputs include a full audit trail for every score — showing which sensor readings, inspection records, and maintenance events contributed, what weights were applied, and when the score was last updated. This audit trail meets documentation requirements for most FMCG regulatory frameworks, including FSSC 22000, BRCGS, and local boiler inspection authorities. Where a specific regulatory framework requires a defined inspection frequency or condition assessment methodology, the platform can be configured to generate compliance-ready reports alongside the AI-generated health index. Talk to an Expert to review compliance documentation for your jurisdiction.
A boiler health score your entire thermal team can read — updated in real time, built from every data source you already have.
iFactory aggregates combustion data, water chemistry readings, steam trap survey results, and SCADA history into live AI-generated health scores for every boiler in your FMCG plant — giving shift teams, maintenance planners, and engineering managers the same accurate picture from one unified platform. Book a Demo or Talk to an Expert to see it on your data.