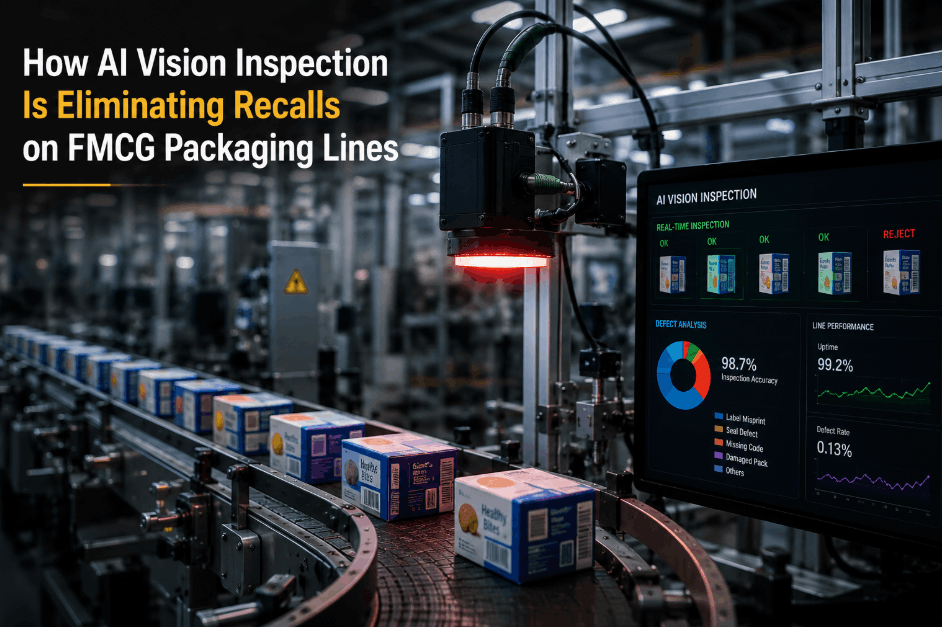
An AI vision inspection system on an FMCG production line evaluates 120 bottles per minute checking fill level, cap placement, label registration, batch code legibility, and seal integrity in a single pass. The system rejects non-conforming units with 99.7% accuracy on the day it is calibrated. Thirty days later, without any maintenance intervention, the same system is rejecting 1.2% of good units as false positives while passing 0.4% of defective units that should have been caught. The reject rate has drifted. The false positive rate has increased. The production team compensates by widening the acceptance threshold, which reduces false positives but increases the number of defective units that reach the distribution center. Nobody detected the performance drift because the vision system was not on a structured inspection and recalibration schedule it was treated as a set-and-forget device rather than a precision instrument that requires regular preventive analytics. This gap between initial accuracy and sustained accuracy is the single largest source of quality escape in FMCG lines that have deployed AI vision inspection, and it is the reason that facilities with mature vision system maintenance programmes structured camera calibration checks, lighting validation routines, AI model drift reviews, and sensor cleaning schedules consistently outperform facilities that calibrate only when the line starts rejecting good product. Book a Demo to see how iFactory AI's Shift Logbook and Inspection Management platform digitises your AI vision system preventive analytics checklist.
The Five Dimensions of AI Vision Inspection System Preventive Analytics
An AI vision inspection system is not a single instrument — it is an integrated system of optical, electronic, and computational components, each with its own degradation modes and maintenance requirements. The camera lens accumulates dust and condensation. The illumination array loses intensity as individual LEDs degrade. The AI model's decision boundary drifts as production conditions change. The encoder that triggers image capture accumulates timing error. The communication link between the camera and the reject mechanism introduces latency that shifts the spatial alignment of detection and rejection. A comprehensive preventive analytics checklist addresses five dimensions of vision system health: optical path integrity, illumination performance, model inference accuracy, mechanical alignment, and data communication reliability.
Complete Preventive Analytics Schedule by Frequency
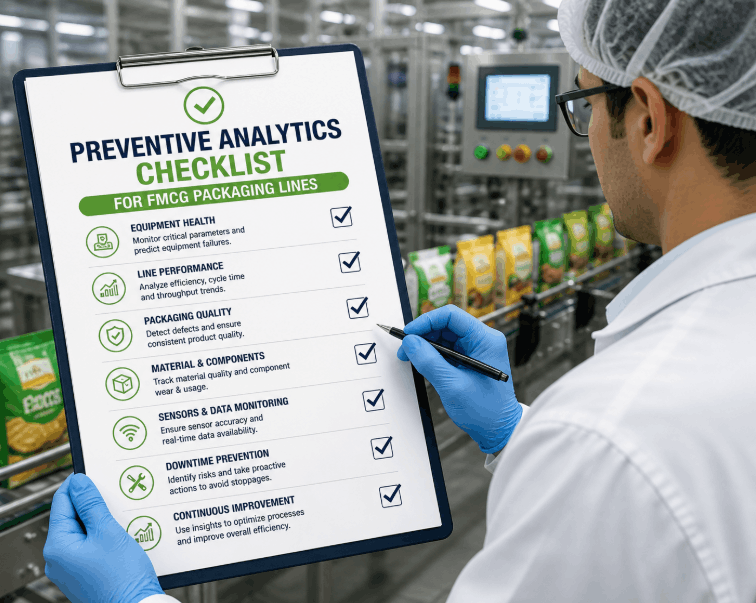
The full AI vision inspection system preventive checklist is organized by maintenance frequency — daily, weekly, monthly, and quarterly — with specific inspection parameters, acceptable ranges, measurement methods, and follow-up actions. Each checklist item maps directly to an iFactory Shift Logbook digital inspection template for immediate deployment.
| Frequency | Inspection Item | Measurement Parameter | Acceptable Range | Follow-Up Action |
|---|---|---|---|---|
| Daily | Lens cleanliness — visual inspection | Surface contamination visible under oblique lighting | No visible dust, condensation, or residue | Lens cleaning with approved solution and lint-free cloth |
| Daily | Illumination quick check | Peak intensity reading at centre of field | Within 10% of baseline calibration value | Clean illumination window; if intensity below 90%, schedule full characterisation |
| Daily | Reject verification test | Known-defective sample passes through system and is ejected | 100% rejection of known-defective sample | Check divertor timing, confirmation sensor, and pneumatic pressure |
| Daily | False positive rate check | Number of false rejects per 1,000 good units | Below facility-specified threshold (typically 0.5-1.0%) | Review model confidence threshold; schedule lighting characterisation if threshold adjustment exceeds 5% |
| Weekly | Illumination intensity mapping | 9-point grid measurement across field of view | All points within 15% of centre intensity; no single point below 80% of baseline | Replace failing LED modules; record intensity map in Shift Logbook for trend analysis |
| Weekly | Camera temperature check | Internal camera housing temperature | Within manufacturer specification (typically 0-50°C) | Check cooling fan, enclosure ventilation, and ambient temperature in camera housing |
| Weekly | AI model confidence distribution review | Mean confidence score and 5th percentile confidence for pass decisions | Mean confidence above 95%; 5th percentile above 80% | Review recent production changes; evaluate need for model retraining or threshold adjustment |
| Weekly | Network latency test | Round-trip image transmission time from camera to inference server | Below line cycle time minus 20% safety margin | Inspect network switches, cables, and server load; escalate if latency exceeds threshold |
| Monthly | Full illumination characterisation | Spectral distribution, uniformity map, and total flux measurement | Spectral shift below 5nm; uniformity above 85%; total flux above 80% of baseline | Replace LED array if spectrum shift or uniformity degradation exceeds limits |
| Monthly | Encoder timing verification | Encoder pulse timing relative to known product position | Timing error below 2% of product pitch | Encoder replacement or coupling tightening if timing error exceeds threshold |
| Monthly | Lens focus and aperture check | MTF (modulation transfer function) at centre and corners | MTF above 50% at Nyquist frequency for the camera sensor | Clean or replace lens; adjust focus if MTF degradation is non-uniform across field |
| Monthly | Data integrity verification | Image storage checksum validation; compression artefact assessment | Zero checksum errors; compression artefacts below visible threshold on test pattern | Replace storage media if checksum errors detected; adjust compression parameters if artefact threshold exceeded |
| Quarterly | Full system recalibration | End-to-end accuracy test with certified reference sample set | Accuracy within 0.5% of manufacturer specification; false positive and false negative rates within acceptance criteria | Full system recalibration by certified technician; update baseline calibration records in iFactory platform |
| Quarterly | Model retraining evaluation | Model accuracy on recent production data versus original validation set | Accuracy within 1% of original validation accuracy | Initiate model retraining if accuracy gap exceeds threshold; update model version in Shift Logbook |
| Quarterly | Mechanical mounting inspection | Bracket torque, vibration amplitude, camera alignment relative to reference mark | Torque within specification; vibration below 0.5g RMS; alignment within 0.5mm of reference | Tighten or replace mounting hardware; shim or realign camera bracket if alignment out of specification |
From Fixed-Interval Calibration to Predictive Analytics — The Data-Driven Maintenance Model
The most significant shift in AI vision inspection system maintenance is the transition from fixed-interval calibration — "calibrate every 90 days because the manufacturer says so" — to condition-based predictive maintenance driven by the preventive analytics data collected during each inspection. When lens cleanliness, illumination intensity, model confidence, encoder timing, and reject verification data are captured digitally in every shift and trended over time, the maintenance team can predict exactly when each component will reach the performance threshold that requires intervention — and schedule that intervention during the next planned changeover rather than reacting to a quality escape.
- Lens cleanliness grade (0-5 scale based on visual inspection with defined criteria per grade)
- Illumination intensity reading at centre and four corners of field of view
- AI model mean confidence score for all pass decisions during the shift
- False positive rate — number of false rejects per 1,000 good units
- Reject verification result — pass/fail for known-defective sample test
- Camera housing temperature at shift start and end
- Network round-trip latency measured at shift midpoint
- Lens cleanliness trend — predicts when cleaning will be required based on contamination accumulation rate
- Illumination degradation curve — forecasts LED replacement date based on intensity decline rate
- Model confidence drift detection — identifies statistical shift in confidence distribution before accuracy declines
- False positive trend correlation — links false positive rate changes to specific camera or lighting changes
- Component lifecycle prediction — estimates remaining useful life for LEDs, encoders, lenses, and filters
- Calibration interval optimisation — recommends optimal recalibration date based on actual drift rate rather than fixed schedule
Implementation Pathway — Deploying AI Vision System Preventive Analytics in 30 Days
Transitioning from reactive vision system maintenance to structured preventive analytics follows a consistent three-phase deployment that requires no changes to the vision system hardware or software. The iFactory Shift Logbook platform operates alongside the existing vision system, capturing inspection data that the vision system itself cannot record — lens cleanliness observations, illumination measurements, environmental conditions, and operator observations.
Our FMCG line deployed three AI vision inspection systems for cap-seal inspection, fill-level verification, and label placement accuracy. The systems passed acceptance testing with 99.5% accuracy and we treated them as commissioned — no structured maintenance schedule beyond the manufacturer's recommended quarterly calibration. By month four, the cap-seal system was rejecting 2.3% of good caps as false positives, and the fill-level system had a 0.7% false negative rate that we only discovered when a customer complaint revealed 48 under-filled bottles had reached distribution. We deployed iFactory's Shift Logbook with the preventive analytics checklist — daily lens inspection, weekly illumination mapping, and weekly model confidence distribution review — and within two weeks we identified that the cap-seal false positives were caused by a 12% illumination drop in the upper-left quadrant of the field of view, and the fill-level false negatives were caused by encoder timing drift that had accumulated 4.2ms over four months. Both issues were corrected during scheduled changeovers. Zero unplanned downtime. Zero quality escapes. Our quarterly calibration interval has been extended to five months because the trend data shows our actual drift rate is 40% slower than the manufacturer's worst-case specification.
Conclusion — From Reactive Recalibration to Preventive Vision Analytics
An AI vision inspection system that is calibrated at commissioning and recalibrated on a fixed quarterly schedule will operate below its design accuracy for a significant portion of its service life. Lens contamination accumulates between shifts. Illumination intensity degrades with every hour of operation. The AI model's decision boundary drifts as production conditions evolve. The encoder timing drifts with mechanical wear. Each of these degradation modes is measurable, predictable, and preventable — but only when the maintenance team captures inspection data at the right frequency, trends it over time, and acts on the predictive signals before the accuracy decline produces a quality escape.
iFactory AI's Shift Logbook and Inspection Management platform provides the structured data capture, automated trend analysis, and predictive Work Order generation that transforms reactive vision system maintenance into preventive analytics. The platform deploys in 30 days, requires no changes to existing vision system hardware or software, and begins generating actionable predictive insights from the first week of inspection data. The FMCG facilities that have deployed this structured preventive analytics approach consistently report false positive rate reductions above 70%, calibration interval extensions approaching 3x, and zero quality escapes attributable to undetected vision system accuracy drift.
Book a Demo to see the complete AI Vision Inspection System Preventive Analytics Checklist configured in the iFactory Shift Logbook, or talk to an expert about a free vision system preventive analytics assessment for your FMCG line — including the digital checklist configuration, baseline data gap analysis, and 30-day deployment roadmap.
Frequently Asked Questions
The complete checklist covers 15 inspection points across six critical dimensions of vision system health — optical path integrity (lens cleanliness, filter condition, viewing window contamination), illumination performance (intensity, uniformity, spectrum stability), AI model inference accuracy (confidence distribution, false positive rate, false negative rate), mechanical alignment (encoder timing, camera bracket stability, reject synchronisation), data communication reliability (network latency, storage integrity), and reject verification (confirmation sensor function, divertor timing). Each inspection point is assigned a frequency — daily, weekly, monthly, or quarterly — with specific measurement parameters, acceptable ranges, and automated follow-up actions when thresholds are exceeded. The checklist is provided as a pre-configured iFactory Shift Logbook inspection template for immediate deployment. Book a Demo to receive the complete checklist configured for your vision system make and model.
AI model drift in vision inspection occurs when the statistical distribution of features in the production images shifts away from the distribution the model was trained on. Common causes include packaging material changes (new bottle resin with different optical properties), label design revisions (colour changes, logo updates, barcode format changes), lighting condition shifts (LED ageing that changes colour temperature), and environmental changes (humidity affecting surface reflectance, temperature affecting camera sensor response). Drift is detected by monitoring the model's confidence score distribution — specifically the mean confidence and the 5th percentile confidence for pass decisions. When the mean confidence drops below 95% or the 5th percentile drops below 80%, the model's decision boundary is approaching the production distribution edge and accuracy degradation is imminent. Weekly confidence distribution review is the standard detection frequency, with automated alerts configured to notify the maintenance and quality teams when the trend line crosses the alert threshold. Talk to an expert to see how iFactory's Shift Logbook tracks AI model confidence trends across vision systems.
Fixed-interval calibration follows the manufacturer's recommended schedule — typically every 90 days — regardless of whether the system needs recalibration. This approach either wastes calibration resources if the system is still performing within specification (over-maintenance) or allows accuracy to degrade below specification before the scheduled calibration arrives (under-maintenance). Condition-based predictive maintenance uses the data captured during daily, weekly, and monthly inspections — lens cleanliness trend, illumination intensity degradation curve, model confidence drift rate, encoder timing trend — to predict exactly when each component will reach the performance threshold that requires intervention. The maintenance team schedules the intervention during the next planned changeover, eliminating both unplanned downtime and unnecessary recalibration cycles. FMCG facilities using structured preventive analytics typically extend their calibration intervals by 2-3x while maintaining or improving inspection accuracy because they intervene based on actual component condition rather than a calendar date. Talk to an expert to see a condition-based maintenance schedule configured for your vision system model.
The deployment follows a 30-day timeline with no changes to the existing vision system hardware or software. Week one converts the existing vision system maintenance tasks into digital Shift Logbook inspection templates and configures measurement parameters, acceptable ranges, and automated Work Order triggers. Weeks two and three operate the digital checklists on 1-2 vision systems as a pilot, collecting baseline data and training operators and maintenance technicians on the new workflow. Week four rolls out the digital checklists to all vision systems across the FMCG line and activates the automated analytics dashboards. The platform operates on standard tablets or mobile devices and connects to the existing facility network. No integration with the vision system itself is required — the Shift Logbook captures the inspection observations and measurements that the vision system cannot record about its own health, such as lens cleanliness, illumination measurements, and environmental conditions. Book a Demo to see a 30-day deployment plan configured for your FMCG line vision systems.
Yes. The iFactory Shift Logbook platform integrates with existing vision system data outputs through standard file-based or API-based interfaces. The platform ingests vision system reject logs, inspection counts, false positive statistics, and model confidence data to populate the analytics dashboard alongside the manual inspection data captured by operators and technicians. For vision systems that support real-time data export, the Shift Logbook can display live reject rate trends, false positive rates, and model confidence distributions alongside the preventive analytics inspection checklist. The platform also accepts manual data entry for vision systems that do not support automated data export, ensuring that every vision system — regardless of manufacturer, model, or data connectivity — benefits from the same structured preventive analytics framework. The integration architecture ensures that the preventive analytics checklist complements the existing vision system data rather than duplicating it. Book a Demo to see the integration architecture for your specific vision system make and model.