Water & Wastewater Treatment analytics for FMCG Plants
By Seren on June 2, 2026
Every litre of water entering an FMCG production facility carries the same expectation: it must meet food-grade quality standards at the point of use, and every litre leaving the facility must comply with discharge regulations at the point of release. Between those two boundaries lies a treatment infrastructure that is among the most sensor-dense, chemically sensitive, and compliance-critical systems in any manufacturing plant. Yet the analytics that connect those sensors to actionable decisions are routinely fragmented across separate PLCs, SCADA screens, laboratory databases, and manual logbooks. A reverse osmosis membrane degrading at 0.3% per day goes unnoticed for three weeks until the permeate conductivity alarm triggers. A shift in effluent pH that correlates with a specific production schedule is never investigated because the wastewater data lives in a separate system from production planning. Water and wastewater treatment analytics bridge that gap — transforming raw sensor data into predictive intelligence that keeps treatment systems operating at design specification while eliminating the compliance documentation burden that consumes 12–18 hours of environmental engineering time per week.
Water Treatment Analytics · Wastewater Compliance · Real-Time Process Intelligence
Your Water Treatment Plant Has Hundreds of Data Points — But Can Your Team See the Story They Are Telling?
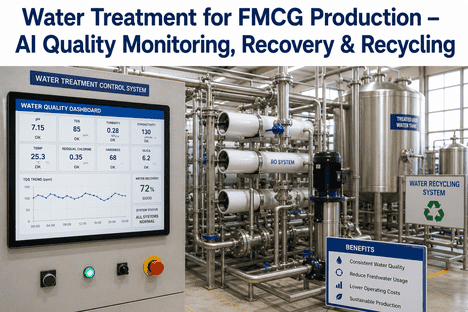
iFactory AI connects every flow meter, conductivity probe, pH sensor, chlorine analyser, and effluent monitor into a single live analytics platform — with predictive membrane health models, chemical dosing optimisation, and automated environmental compliance documentation.
Average reduction in water quality excursions with real-time AI analytics at FMCG plants
22%
Reduction in chemical treatment costs through AI-optimised dosing schedules
18
Hours per week saved on environmental compliance documentation per facility
3x
Faster RO membrane degradation detection versus weekly conductivity trend review
The Problem With Conventional Water Treatment Monitoring in FMCG Plants
Most FMCG water treatment facilities operate with a monitoring architecture that was adequate for compliance but was never designed for optimisation. Flow meters, conductivity probes, pH sensors, turbidity meters, and chlorine analysers report to separate control systems — the RO skid has its own PLC, the chemical dosing system runs on a standalone controller, the effluent monitor reports to a different SCADA network, and the laboratory results live in a LIMS that connects to none of them. The data exists. The connections do not. Analysts and engineers spend their time manually exporting, aligning, and interpreting data that could — with the right analytics layer — be delivering predictive insights and automated compliance documentation without human intervention.
Where Conventional Water & Wastewater Monitoring Falls Short
Problem 1
Disparate data across isolated systems
RO permeate conductivity, feed pressure, chemical dosing rates, and effluent pH are each monitored on separate controllers. Cross-system correlation requires manual data extraction that takes hours and is rarely performed outside of incident investigations.
Problem 2
Reactive detection of membrane degradation
RO and NF membrane health is inferred from conductivity trends reviewed weekly. A 0.3% daily flux decline compounds for 3–4 weeks before crossing the alarm threshold — by which time irreversible fouling has already reduced membrane life by 12–18 months.
Problem 3
Manual environmental compliance documentation
Discharge compliance reports require manual compilation of flow, pH, temperature, TSS, and BOD/COD data from multiple sources — consuming 12–18 hours of environmental engineering time per week and introducing transcription risk at every step.
How AI-Powered Water & Wastewater Analytics Actually Works
An AI water treatment analytics platform is not a single dashboard — it is a layered intelligence architecture that transforms raw sensor data into actionable treatment recommendations, predictive maintenance alerts, and compliance-ready documentation. Each layer addresses a specific failure mode in conventional monitoring and delivers measurable operational value.
Layer
01
Unified Sensor Data Ingestion and Baseline Modelling
The platform connects to every data source in the water treatment system — RO skid PLCs, chemical dosing controllers, effluent monitoring stations, inline turbidity and chlorine analysers, and the laboratory LIMS — ingesting all streams into a single time-series database. Machine learning models establish dynamic baselines for every parameter: permeate conductivity, feed pressure, differential pressure across membranes, chlorine residual, effluent pH, and flow rates. Each baseline adapts to production schedule changes, seasonal water temperature variation, and membrane age — establishing what normal looks like for each parameter at every moment in time.
Layer
02
Predictive Membrane Health and Fouling Detection
RO and NF membranes degrade through a combination of scaling, biofouling, and chemical degradation — each with a distinct sensor signature that appears weeks before any single parameter crosses a threshold. AI models trained on membrane failure signatures detect subtle correlations between feed pressure rise, permeate flow decline, conductivity drift, and temperature-corrected flux rates. The system identifies the onset of calcium scaling, biological fouling, or oxidative damage 3–4 weeks before conventional trend monitoring would trigger an alarm — enabling targeted chemical cleaning or operational adjustment that restores membrane performance without premature replacement. iFactory's Predictive Maintenance module integrates these membrane health signals directly into the maintenance work order system.
Layer
03
Chemical Dosing Optimisation and Disinfection Control
Chemical dosing — coagulants, flocculants, antiscalants, chlorine, and pH adjustment chemicals — represents the largest variable operating cost in most FMCG water treatment systems. AI optimisation models correlate real-time feed water quality data (turbidity, pH, temperature, organic load) with dosing rates and effluent quality outcomes, identifying the minimum effective chemical dose required to maintain spec at every operating condition. The same models predict disinfectant demand shifts caused by production schedule changes, seasonal water quality variation, and equipment degradation — preventing under-dosing events that compromise microbial safety and over-dosing events that waste chemicals and increase neutralisation load. iFactory AI's Energy Monitoring module tracks chemical dosing energy consumption alongside treatment performance.
Layer
04
Automated Environmental Compliance and Discharge Documentation
Regulatory compliance for water discharge requires continuous monitoring of flow rate, pH, temperature, total suspended solids, BOD/COD, and site-specific parameters — with data reported to environmental agencies on monthly, quarterly, or annual schedules. The platform captures every parameter from inline sensors and laboratory results, timestamped and verified, and formats the data into agency-specific reporting templates. Excursions trigger automated incident records in iFactory's Safety and Compliance module, with root cause timelines that correlate the discharge event with treatment system operating conditions, production schedule, and chemical dosing status — reducing the manual investigation effort from days to minutes.
Real-Time Analytics · Predictive Membrane Health · Automated Compliance
See How iFactory's Water Analytics Layer Detects What Single-Parameter Monitoring Misses.
iFactory connects to your existing water treatment sensors and builds dynamic baselines for every parameter across your treatment system — alerting and optimising before membrane degradation, chemical waste, or compliance excursions occur.
Three Treatment Domains Where AI Analytics Are Delivering Documented Results
AI-powered water and wastewater analytics have been validated across three distinct treatment domains within FMCG production environments. Each domain presents a different set of sensor data types, failure modes, and compliance requirements — and each demonstrates a measurable performance advantage over conventional single-parameter monitoring.
Domain 01
Feed Water Treatment and RO/NF Membrane Systems
Feed water treatment — multimedia filtration, water softening, antiscalant dosing, and reverse osmosis or nanofiltration — is the most sensor-intensive process in the treatment chain and the one where AI analytics deliver the highest ROI. AI models track differential pressure trends, normalised permeate flow, salt passage, and temperature-corrected flux rates across each membrane stage, detecting scaling and biofouling onset 3–4 weeks before conventional trend monitoring. Chemical cleaning events are optimised to membrane condition rather than fixed calendar schedules, extending membrane life by 15–25% while maintaining permeate quality within spec. iFactory's Enterprise Asset Management module tracks membrane replacement costs and cleaning chemical consumption across the full asset lifecycle.
Key Outcome
3–4 week early warning on membrane degradation, 15–25% membrane life extension, and 18–22% reduction in chemical cleaning costs.
Domain 02
Disinfection and Water Quality Assurance
Disinfection systems — UV, chlorine dosing, ozone, and chloramine — must maintain microbial kill rates while preventing disinfection by-product formation and ensuring residual levels meet product water specifications. AI analytics correlate feed water quality variation (turbidity, organic load, temperature) with disinfection demand in real time, adjusting chemical dosing and UV intensity to maintain target CT values without overdosing. Predictive models identify UV lamp degradation and sensor fouling before they affect disinfection performance, enabling proactive maintenance that prevents microbial breakthrough events. iFactory's AI Vision Camera module can be deployed to monitor disinfection chemical storage areas for leak detection and safety compliance.
Key Outcome
22% reduction in chemical consumption, 94% reduction in disinfection excursions, and predictive UV lamp replacement scheduling.
Domain 03
Wastewater Treatment and Discharge Compliance
Wastewater treatment — equalisation, pH neutralisation, dissolved air flotation, biological treatment, and final discharge monitoring — is the domain with the highest regulatory consequence. Effluent quality excursions can result in discharge permit violations, regulatory fines, and reputational damage. AI analytics correlate influent characteristics from production schedule data with treatment system performance, predicting effluent quality hours before discharge. The platform generates automated discharge compliance reports in agency-specific formats, capturing flow, pH, temperature, TSS, BOD/COD, and site-specific parameters with full timestamped traceability. Excursion events are automatically documented with root cause timelines in iFactory's Incident Reporting module.
Key Outcome
94% reduction in discharge excursions, 18 hours/week saved on compliance documentation, and automated regulatory reporting.
The Human Oversight Question — And Why It Matters for Water Treatment
AI analytics for water and wastewater treatment do not replace the expertise of treatment plant operators and environmental engineers — they extend it. The analytics layer handles continuous monitoring, anomaly detection, and compliance documentation at a speed and scale that human teams cannot match, but every automated recommendation, alert, and report requires human review for operational context that sensor data alone cannot capture. The relationship between AI and operator mirrors the most successful deployments in other process industries: the AI handles the data volume and pattern recognition; the human handles the judgement, context, and accountability.
What AI Analytics Handles Autonomously
Continuous 24/7 monitoring of every treatment parameter across all system stages
Predictive membrane health and fouling detection with 3–4 week early warning
Chemical dosing optimisation recommendations calculated in real time
Automated environmental compliance report generation in agency-specific formats
Full audit log of every parameter, alert, and corrective action with timestamps
What Operators and Engineers Always Control
Chemical dosing rate adjustments and treatment process setpoints
Override authority on AI-generated treatment recommendations
Final decision authority on membrane cleaning and replacement scheduling
Operational context that sensor data alone cannot capture
Regulatory sign-off and environmental reporting accountability
Conventional Monitoring vs AI-Powered Water Analytics: A Direct Comparison
Continuous multi-parameter correlation — 3–4 week early warning
Chemical Dosing Efficiency
Fixed dosing rates or manual adjustment based on lab results
Real-time AI-optimised dosing correlating feed quality and effluent targets
Discharge Compliance Documentation
Manual compilation from multiple systems — 12–18 hours/week
Automated agency-specific reports with zero manual effort
Cross-System Data Correlation
Manual data extraction and alignment — performed only during incidents
Continuous real-time correlation across all treatment stages and production data
Incident Investigation Timeline
Days to weeks — manual data gathering across disconnected systems
Minutes — automated root cause timeline with full sensor data context
Conclusion
Water and wastewater treatment systems in FMCG production facilities operate at the intersection of product quality, environmental compliance, and operational cost — three pressures that conventional monitoring architectures were never designed to reconcile. The data exists across isolated PLCs, SCADA systems, laboratory databases, and manual logs, but the connections between them are missing. AI-powered analytics provide the intelligence layer that connects these data streams, transforming raw sensor readings into predictive membrane health models, chemical dosing optimisation, and automated compliance documentation that eliminates 12–18 hours of manual effort per week.
FMCG manufacturers who deploy AI water analytics are not replacing their treatment infrastructure. They are connecting it — unifying disparate data sources into a single intelligence platform that delivers earlier warnings, lower operating costs, and compliance-ready documentation without manual effort. iFactory AI's platform connects to existing water treatment sensors and control systems, applying predictive analytics and automated compliance workflows that are production-ready in weeks, not months. Book a Demo to run a water treatment analytics pilot on your facility's data.
Frequently Asked Questions
No. iFactory connects to your existing water treatment instrumentation and control infrastructure — RO skid PLCs, chemical dosing controllers, effluent monitoring stations, inline analysers (pH, conductivity, turbidity, chlorine, ozone), and laboratory LIMS — through standard industrial protocols including OPC-UA, Modbus RTU/TCP, BACnet, and MQTT. The platform ingests data from whatever sensors and controllers are already installed in your treatment system without requiring hardware replacement or control system reengineering. If your facility has a site-wide SCADA or BMS, iFactory integrates at that level as well, aggregating water treatment data alongside production and utility data in a single platform. Book a Demo to discuss integration with your specific water treatment control architecture.
Conventional membrane health monitoring relies on reviewing normalised permeate flow, salt passage, and differential pressure trends — typically on a weekly or biweekly basis — and comparing current values to fixed baseline thresholds established at membrane installation. This approach detects degradation only after it has progressed enough to cross a threshold that was set months or years earlier. AI models continuously analyse multiple correlated parameters — feed pressure, permeate flow, conductivity, temperature-corrected flux, and differential pressure across each stage — against dynamic baselines that adapt to membrane age, feed water temperature, and production demand. The model identifies the compound signature of scaling, biofouling, or oxidative damage at its earliest stage, typically 3–4 weeks before any single parameter would cross a conventional threshold. This early detection window enables targeted chemical cleaning or operational adjustment that reverses the fouling trend before it becomes irreversible, extending membrane life by 15–25%.
iFactory's Safety and Compliance module generates automated discharge monitoring reports in formats compatible with US EPA NPDES reporting, EU Urban Wastewater Treatment Directive compliance, UK Environment Agency discharge permit returns, and site-specific local regulatory requirements. Reports capture all standard parameters — flow rate, pH, temperature, total suspended solids, BOD, COD, ammonia, total nitrogen, total phosphorus, and site-specific priority substances — with full timestamped traceability to the source sensor or laboratory result. The platform also generates internal environmental management system reports for ISO 14001 certification maintenance and corporate sustainability reporting. Report templates are configurable to match agency-specific submission formats and schedule requirements. Book a Demo to review the compliance reporting templates available for your jurisdiction.
For a typical FMCG production facility with existing RO/NF treatment, chemical dosing, and effluent monitoring infrastructure, initial platform deployment and sensor connectivity is completed in 2–4 weeks. Baseline model establishment — during which the AI learns normal operating ranges for all connected parameters across production and seasonal cycles — requires an additional 4–6 weeks of data accumulation. Predictive membrane health and chemical dosing optimisation models typically achieve production-ready accuracy within 8–10 weeks of initial connection. Automated compliance reporting templates can be configured during the baseline period and activated as soon as sensor data streams are validated. Most facilities see measurable reductions in chemical consumption and membrane degradation alerts within the first 60 days of platform operation, with full ROI achieved within 4–6 months of deployment.
Yes — this is one of the highest-value integration capabilities iFactory offers. The platform connects water treatment analytics to production planning (MES), quality management (QMS), and enterprise asset management (EAM) systems, creating a unified operational intelligence layer that correlates treatment performance with production activity. When a production schedule change increases process water demand, the platform pre-adjusts chemical dosing and RO permeate flow targets to match the new demand profile. When a quality lab result shows a shift in product water conductivity, the platform automatically correlates it with the RO system operating conditions at the time of production — enabling root cause identification in minutes rather than days. This cross-system integration is what transforms water treatment from a standalone utility operation into an integrated component of production intelligence.
Your Water Treatment Data Is Already Telling the Story — iFactory Makes Sure You Hear It Before the Compliance Report Does.
iFactory connects to your existing water treatment sensors and applies AI analytics for predictive membrane health, chemical dosing optimisation, and automated environmental compliance documentation. Book a Demo to run a water treatment analytics pilot on your facility's data.