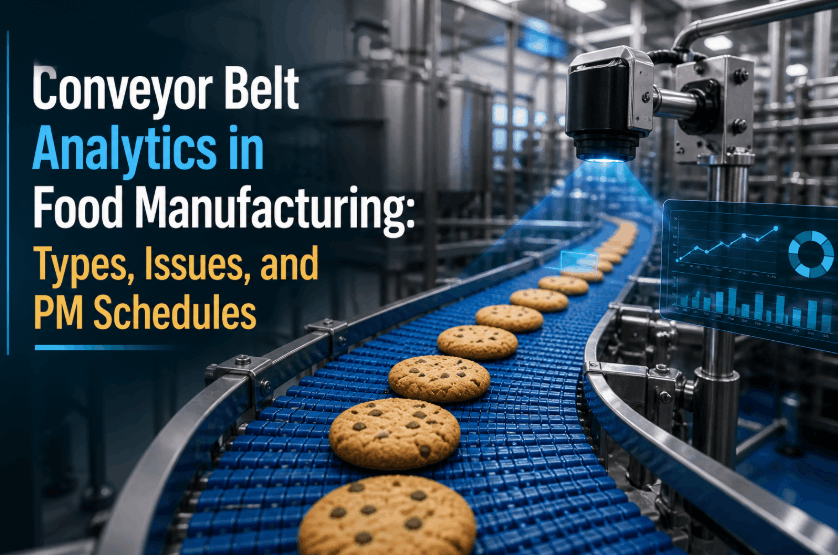
Conveyor belt analytics in food manufacturing has become one of the most critical — and most overlooked — pillars of plant reliability strategy. Whether your facility runs modular plastic belts through a poultry line, flat wire belts in a baking operation, or stainless steel mesh conveyors in a seafood processing environment, the financial and compliance consequences of belt failure are immediate and significant. This guide covers every major belt type used in food-grade conveyor systems, the failure modes that drive the highest downtime costs, and the preventive maintenance schedules that world-class food plants are now running in 2026. If you want to see how AI-driven conveyor analytics can connect your belt health data directly to production uptime and margin outcomes, Book a Demo with the iFactory manufacturing intelligence team.
Why Conveyor Belt Analytics Matters in Food Processing Plants
The Hidden Cost of Belt Failures in Food Manufacturing
A single unplanned conveyor belt failure in a food processing facility does not just stop a line — it triggers a cascade of compliance, sanitation, and production cost events that traditional maintenance tracking systems rarely capture in full. Product on the belt at the time of failure may require disposal. The line must be sanitized before restart. If the failure occurs during a high-throughput shift, the downstream buffer may be exhausted before a replacement belt is sourced. In cold-chain environments, temperature excursions during extended stoppage can compromise an entire production batch.
Modern food conveyor analytics frameworks are designed to quantify exactly this exposure — converting belt condition data into revenue risk scores before a failure occurs, not after. The shift from reactive belt replacement to condition-based and predictive conveyor maintenance is the single highest-ROI opportunity available to most food plant maintenance teams in 2026. For plants running multiple belt types across heterogeneous lines, Book a Demo to see how a unified analytics layer manages belt PM schedules, condition signals, and failure risk across the entire facility in a single dashboard.
Food-Grade Conveyor Belt Types: A Complete Analytics Guide
Understanding Belt Materials and Their Analytics Requirements
Effective food conveyor analytics begins with understanding the mechanical and material behavior of each belt type in your facility. Different belt constructions degrade through fundamentally different failure pathways — and a PM schedule optimized for a modular plastic belt will miss the early failure signals of a flat wire or fabric belt on a parallel line. The four primary belt types in food manufacturing each require a distinct monitoring and maintenance architecture.
Conveyor Belt Failure Modes in Food Processing: A Technical Breakdown
The Six Most Costly Conveyor Belt Failure Patterns in Food Plants
Understanding failure mode distribution is the foundation of an effective food conveyor analytics strategy. Each failure pathway requires different sensor inputs, different AI model training data, and different PM intervention logic. The failure modes below represent the highest-frequency, highest-cost patterns documented across food manufacturing conveyor analytics deployments. Plants evaluating their current failure rate profile can Book a Demo to benchmark their conveyor downtime data against industry performance ranges for their production category.
Food Conveyor Belt PM Schedules: Building a Frequency Framework That Works
Preventive Maintenance Schedules Aligned to Belt Type, Load, and Sanitation Exposure
Belt conveyor PM in food manufacturing cannot be managed effectively on fixed calendar intervals alone. The actual wear rate on any given belt section is determined by the interaction of three variables: mechanical load intensity, sanitation chemical exposure frequency, and cumulative operating hours since last service. A modular plastic belt on a high-volume poultry line running two CIP cycles per day ages at a fundamentally different rate than the same belt type on a dry bakery ingredient line running weekly sanitation. Facilities seeking to move from calendar-based to condition-based belt PM scheduling can Book a Demo to see how iFactory's conveyor analytics platform automates PM frequency adjustment based on real-time operating conditions.
| Belt Type | Daily Inspection | Weekly PM Tasks | Monthly PM Tasks | Replacement Trigger |
|---|---|---|---|---|
| Modular Plastic | Tracking alignment, module surface cracks, hinge pin visibility | Sprocket tooth engagement, module wear depth measurement, belt tension check | Full module integrity audit, drive shaft bearing lubrication, take-up position log | Module fracture rate >2%, hinge elongation >3mm, tracking deviation >15mm |
| Flat Wire / Wire Mesh | Edge wire condition, visible wire breaks, drive chain tension | Cross-wire wear measurement at high-contact zones, drive sprocket tooth profile | Full wire count per cross-section, corrosion mapping, belt stretch measurement | Wire break density >3 per meter, edge wire loss >20%, belt stretch at take-up limit |
| Fabric / Synthetic | Splice joint visual inspection, surface crack scan, belt sag assessment | Splice tension test, surface coating integrity check, take-up position measurement | Full-length delamination audit, stretch accumulation record, chemical exposure log review | Splice separation >2mm, surface delamination >10% belt area, elongation at take-up limit |
| Stainless Steel | Joint weld visual inspection, belt registration check, drive chain slack | Stress corrosion scan at CIP exposure zones, tension consistency measurement | Full weld integrity NDT inspection, corrosion pit depth measurement, drive component wear audit | Weld crack propagation detected, corrosion pit depth >0.5mm, tension variance >12% |
Conveyor Sanitation Analytics: Connecting Food Safety Compliance to Belt Condition
Why Sanitation Exposure Data Is the Missing Variable in Most Conveyor PM Programs
The most common gap in food conveyor analytics programs is the absence of sanitation exposure data in belt condition models. Most food plants track sanitation as a compliance event — recording that a CIP cycle was completed at a specific time — without integrating chemical concentration, contact time, temperature, and pressure data into the belt degradation model. This omission creates systematic errors in PM scheduling: belts in high-sanitation-frequency zones are routinely under-inspected on a calendar basis while belts in low-exposure areas accumulate unnecessary inspection labor.
Modern conveyor sanitation analytics platforms integrate directly with CIP control systems and chemical dosing records to calculate a cumulative chemical exposure index for each belt section. This index is combined with mechanical load hours and operating temperature data to generate a composite belt health score that drives dynamic PM interval adjustment — shortening inspection cycles when exposure accumulation accelerates belt aging and extending intervals where measured belt condition remains within healthy parameters. Food plants implementing this approach consistently reduce total belt replacement costs by 18 to 27% while simultaneously improving food safety compliance documentation quality. To see this approach configured for your specific sanitation protocols and belt types, Book a Demo with the iFactory team.
AI-Driven Conveyor Belt Analytics vs. Traditional Maintenance Approaches
Comparing Capability Across Maintenance Maturity Models
The table below maps the key capability differences between reactive, calendar-based, and AI-driven predictive conveyor analytics programs in food manufacturing environments.
| Maintenance Capability | Reactive Maintenance | Calendar-Based PM | AI-Driven Conveyor Analytics |
|---|---|---|---|
| Failure Detection Timing | After Failure | Fixed Interval Only | 2–24 Hours Pre-Failure |
| Belt Condition Visibility | Visual Inspection Only | Scheduled Inspection Points | Continuous Sensor-Based Monitoring |
| Sanitation Exposure Integration | Not Available | Not Available | Chemical Exposure Index Per Belt |
| PM Schedule Optimization | No Schedule | Fixed Calendar | Dynamic Condition-Based Intervals |
| Replacement Life Prediction | Not Available | Experience-Based Estimate | Data-Driven Remaining Life Calculation |
| Downtime Financial Impact Tracking | Not Available | Not Available | Real-Time Revenue Exposure Scoring |
| Multi-Line Belt Inventory Optimization | Manual | Periodic Review | Automated Replenishment Triggers |
Building a Conveyor Belt Analytics Program: Four Implementation Steps
From Reactive Replacement to Predictive Belt Health Management
Deploying effective conveyor belt analytics in a food manufacturing environment does not require replacing existing conveyor infrastructure or taking lines offline for extended sensor installation. Purpose-built food processing conveyor analytics platforms are designed to layer monitoring capability onto existing belt systems using non-invasive sensor configurations — motor current analyzers, vibration transducers, belt tracking sensors, and vision systems — that integrate with existing SCADA and MES infrastructure through standard protocols.
Frequently Asked Questions
What is conveyor belt analytics in food manufacturing?
Conveyor belt analytics is the continuous monitoring and predictive failure detection of belt systems using sensor data and machine learning models. It provides real-time belt health visibility and early failure detection — typically 2 to 24 hours before a failure — enabling planned maintenance instead of emergency stoppages.
Which conveyor belt types require the most intensive analytics monitoring in food plants?
Stainless steel belts in high-temperature environments and flat wire belts in baking and frying applications require the most intensive monitoring due to high replacement costs and severe failure consequences. Modular plastic belts in high-throughput lines also need frequent module-level condition tracking.
How does food sanitation frequency affect conveyor belt PM schedules?
Belts exposed to daily CIP cycles with high-pH or chlorine-based chemicals degrade two to four times faster than those in low-sanitation environments. Effective PM programs incorporate a chemical exposure index to dynamically adjust inspection intervals based on actual sanitation load.
Can AI-driven conveyor analytics integrate with existing CMMS and MES systems?
Yes. Purpose-built conveyor analytics platforms connect to CMMS platforms like IBM Maximo, SAP PM, and Infor EAM via standard API connections and industrial protocols including OPC-UA and MQTT. Most integrations complete without modifying existing validated system configurations.
What ROI can food manufacturers expect from conveyor belt analytics programs?
Documented deployments show conveyor downtime reductions of 35 to 55% within the first year, and belt replacement cost savings of 18 to 27% over calendar-based programs. Most mid-to-large food plant deployments achieve full payback within six to twelve months.
Does deploying conveyor analytics require production line shutdowns for installation?
No. Non-invasive sensor installation is typically completed during scheduled sanitation windows or shift changeovers — most deployments finish within two to five days per line with zero production interruption. The software layer integrates with existing systems through standard network connections.