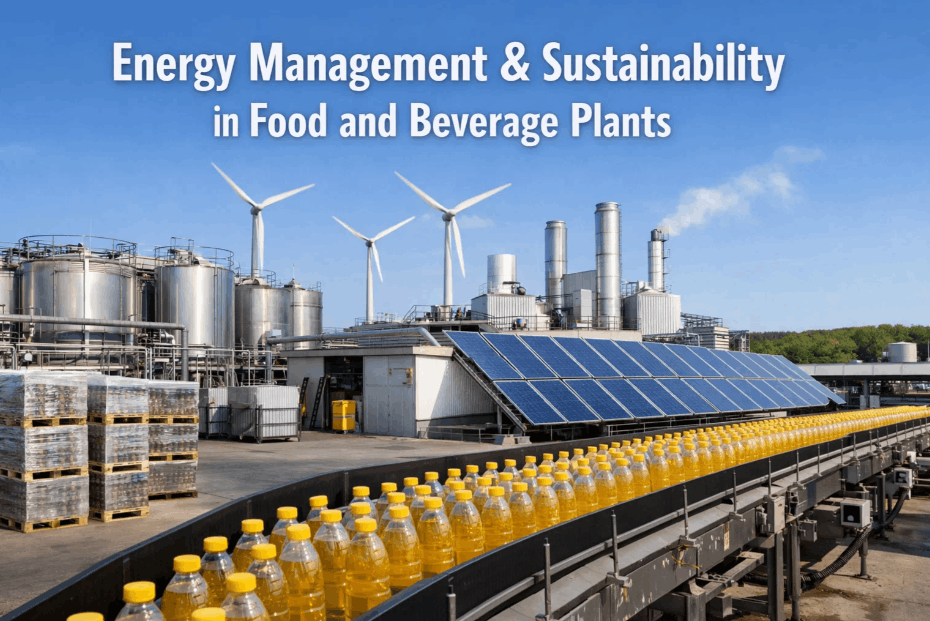
Energy management in food and beverage plants has become a mission-critical priority as manufacturers face escalating utility costs, tightening ESG mandates, and increasing regulatory scrutiny. A single inefficient steam loop or an oversized refrigeration compressor running at partial load can silently drain significant operating margins every month. In food manufacturing, where energy accounts for 15–30% of total production cost, the difference between a reactive energy audit and a real-time AI-driven energy management system is the difference between compliance and competitive advantage. iFactory's Energy & ESG Reporting module gives food plant managers continuous visibility into every kilowatt, every steam unit, and every carbon gram—by production line, by shift, and by SKU. Book a Demo to see how leading F&B manufacturers are cutting energy waste by up to 28% in under 12 months.
AI-Powered Energy Management for Food & Beverage Plants
iFactory helps food manufacturers automate energy tracking, ESG compliance reporting, steam and refrigeration optimization — all from a single AI-driven platform built for F&B operations leadership.
Why Energy Management in Food Plants Is a Strategic Imperative in 2025
The food and beverage manufacturing sector globally consumes over 200 TWh of electricity annually, yet most plants still rely on monthly utility bills and annual energy audits to guide decisions. Global energy price volatility, mandatory ESG disclosures required by institutional buyers, and binding regulatory frameworks like India's PAT scheme and the EU's Energy Efficiency Directive are all converging to make real-time AI-driven energy monitoring a non-negotiable capability for competitive food manufacturers. Book a Demo to understand how iFactory maps directly to these compliance frameworks.
The Hidden Energy Drains in Food and Beverage Manufacturing
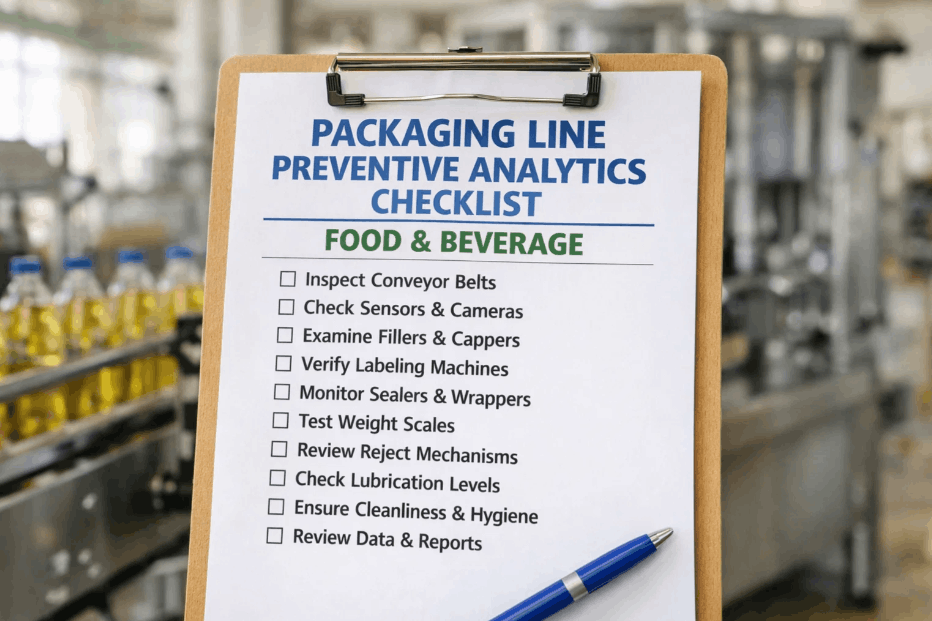
Up to 40% of energy losses in F&B plants occur in systems that have never been formally monitored. These are the six highest-impact targets for any food factory energy audit.
Steam Generation & Distribution
Steam trap failures, insulation degradation, and condensate return losses account for 30–50% of total plant energy. iFactory monitors trap performance and recovery rates continuously.
Industrial Refrigeration Systems
Partial-load compressors, condenser fouling, and time-based defrost cycles silently inflate electricity bills in cold chain and dairy operations.
Compressed Air Networks
Leakage rates of 20–35% are common in unmonitored compressed air networks. iFactory's pressure tracking identifies waste zones before they inflate peak demand charges.
Process Heating & Cooking Tunnels
Burner efficiency degradation in tunnel ovens, fryers, and pasteurizers compounds over time. Continuous thermal profiling keeps assets at designed efficiency curves.
HVAC & Cleanroom Conditioning
Demand-controlled ventilation and occupancy-correlated conditioning schedules reduce HVAC energy consumption in food plants by 12–20% with no compliance impact.
Lighting & Auxiliary Systems
Auxiliary pump motors and conveyors running during non-production hours, combined with unscheduled lighting, create significant recoverable waste across large processing floors.
AI-Driven Energy Monitoring: How iFactory Tracks Consumption by Production Line
Traditional food plant energy monitoring assigns consumption to cost centers—a building, a department, a shift. iFactory goes three levels deeper: tracking energy at the individual production line level, correlating it with actual output (units produced, kg processed), and calculating real-time energy intensity metrics (kWh per tonne, kcal per unit). This enables managers to instantly identify which SKU, shift, or line is driving avoidable energy cost—a capability you can see live when you Book a Demo.
Sub-Meter Data Ingestion
iFactory integrates with existing energy sub-meters, smart PDUs, and utility gateways via Modbus, BACnet, or direct IoT sensors. Data streams at 1-second resolution with no infrastructure replacement required.
Production Correlation Engine
Energy data is automatically matched to production orders from your ERP or MES. iFactory calculates energy intensity per batch, per SKU, and per shift—without manual data entry.
Anomaly Detection & Alerting
AI baselines are built for each production mode. When a line's energy consumption deviates from its learned efficiency curve, iFactory alerts the energy manager in under 60 seconds—not at month-end.
Automated ESG & Compliance Reporting
iFactory automatically generates Scope 1, Scope 2, and energy intensity reports aligned to GRI 302, CDP, and BRSR frameworks. Audit-ready ESG reports are generated in under 15 seconds.
Steam & Refrigeration Optimization: The Highest-ROI Opportunity in F&B Energy Management
For most food and beverage manufacturers, steam and refrigeration systems together represent 60–70% of total plant energy expenditure. Optimizing these two systems delivers the fastest and largest return on any food plant sustainability investment—yet both remain chronically under-monitored in traditional F&B operations. Book a Demo to see our specific optimization maps.
Steam Energy Optimization for Food Manufacturing
A steam system operating at 85% efficiency wastes significant fuel costs annually. iFactory's steam optimization module addresses five primary loss mechanisms: steam trap failures, distribution pipe heat losses, flash steam recovery gaps, condensate return inefficiencies, and boiler combustion degradation. iFactory clients routinely recover 12–18% of steam system energy within the first 90 days.
| Energy System | Traditional Approach | iFactory AI Approach | Typical Savings |
|---|---|---|---|
| Steam Distribution | Annual trap surveys, monthly meter reads | Continuous trap monitoring, real-time loss alerts | 12–18% |
| Refrigeration Compressors | Fixed scheduling, manual COP checks quarterly | AI compressor staging, real-time COP tracking | 15–25% |
| Compressed Air | Monthly pressure logs, manual leak detection | Continuous pressure differential, automated leak alerts | 20–35% |
| Process Ovens & Fryers | Quarterly burner service, manual temperature logs | Continuous thermal profiling, predictive burner alerts | 15–22% |
| HVAC & Ventilation | Fixed schedules, manual filter checks | Demand-controlled ventilation, occupancy-based control | 12–20% |
ESG Reporting for Food Manufacturers: Carbon Footprint and Compliance
Sustainability reporting has evolved from a voluntary exercise to a mandatory regulatory obligation. Food plant sustainability managers face a specific ESG challenge: emissions and energy data are fragmented across utility bills, manual logs, and ERP systems never designed for disclosure. iFactory eliminates this entirely by capturing every energy measurement automatically. Book a Demo to see our one-click reporting engine.
Energy Consumption
Automatic tracking of total energy consumed by source type (electricity, fuel, steam, cooling), aligned to GRI 302-3 intensity metrics.
Scope 1 & 2 Emissions
Real-time Scope 1 and Scope 2 carbon calculations using market-based and location-based methods, with automatic emission updates.
India BRSR Compliance
Pre-mapped data fields for BRSR Section A and B energy indicators. Audit-ready export generated in under 15 seconds.
CDP Climate Disclosure
Structured data exports aligned to CDP Climate Change modules C4 and C8 for faster annual submissions.
The Food Plant Energy Maturity Journey
Most food manufacturers exist somewhere on a maturity curve from purely reactive energy management to fully autonomous AI-driven optimization. Understanding your current position is the first step to a practical sustainability roadmap. Book a Demo to benchmark your plant.
Building the Business Case for F&B Energy Management Investment
The most common barrier to energy management investment in food plants is an inability to quantify the ROI clearly. iFactory's platform makes this business case straightforward through four measurable pathways. Book a Demo to see our ROI calculator.
Direct Energy Cost Reduction
The most immediate return comes from eliminating identified waste—steam losses, refrigeration inefficiencies, and compressed air leaks. A typical plant sees measurable savings within the first billing cycle.
Regulatory Compliance & Penalty Avoidance
Under India's PAT scheme, designated food plants face financial penalties for missing intensity targets. iFactory’s real-time PAT dashboard ensures managers always stay on track versus their annual targets.
Frequently Asked Questions: Energy Management in Food Plants
How does iFactory integrate with existing energy meters?
iFactory integrates via Modbus RTU/TCP, BACnet, and OPC-UA. For legacy analog meters, we provide pulse-output adapters that digitize consumption data without infrastructure replacement.
Can iFactory track energy consumption by SKU?
Yes. The platform associates energy consumption with production orders from your connected ERP, enabling precise kWh-per-batch and kWh-per-SKU calculations automatically.
How long does it take to see measurable energy savings?
Most food plants identify actionable waste within 2 weeks of deployment. Measurable utility bill reductions typically appear within the first 30-day billing cycle.
Does it support carbon footprint reporting for ESG?
Yes. iFactory calculates Scope 1 and Scope 2 greenhouse gas emissions using updated regional factors, aligned to GRI, CDP, and BRSR disclosure requirements.
What is the typical deployment timeline?
A typical multi-line food manufacturing facility is fully connected within 14–21 days. AI baselines are established within 3 weeks, after which ESG reporting is fully active.
How does iFactory help with PAT compliance?
iFactory provide a dedicated dashboard tracking Specific Energy Consumption (SEC) against targets. Automated annual reports are generated exactly in the format required by the BEE.
Stop Losing Revenue to Invisible Energy Waste
Join the world's most energy-efficient food manufacturers. We'll show you exactly how much energy your plant is wasting with iFactory's AI-driven Energy platform.


-in-food-warehouses-implementation-and-ai-driven-integration.png)