Food plant analytics budgeting is no longer optional for food and beverage manufacturers competing on margins. With raw material volatility, energy cost spikes, and tightening compliance mandates, plant finance teams need a structured framework to justify every analytics dollar spent—from sensor infrastructure to AI-driven reporting dashboards. This guide walks you through cost per unit produced, CapEx forecasting, and how AI-powered platforms like iFactory (Book a Demo) are reshaping how food manufacturers plan, measure, and maximize analytics investments.
Ready to Build a Smarter Analytics Budget?
See how iFactory helps you track cost per unit, forecast CapEx, and turn deferred analytics into measurable ROI.
Understanding Food Plant Analytics Cost Per Unit Produced
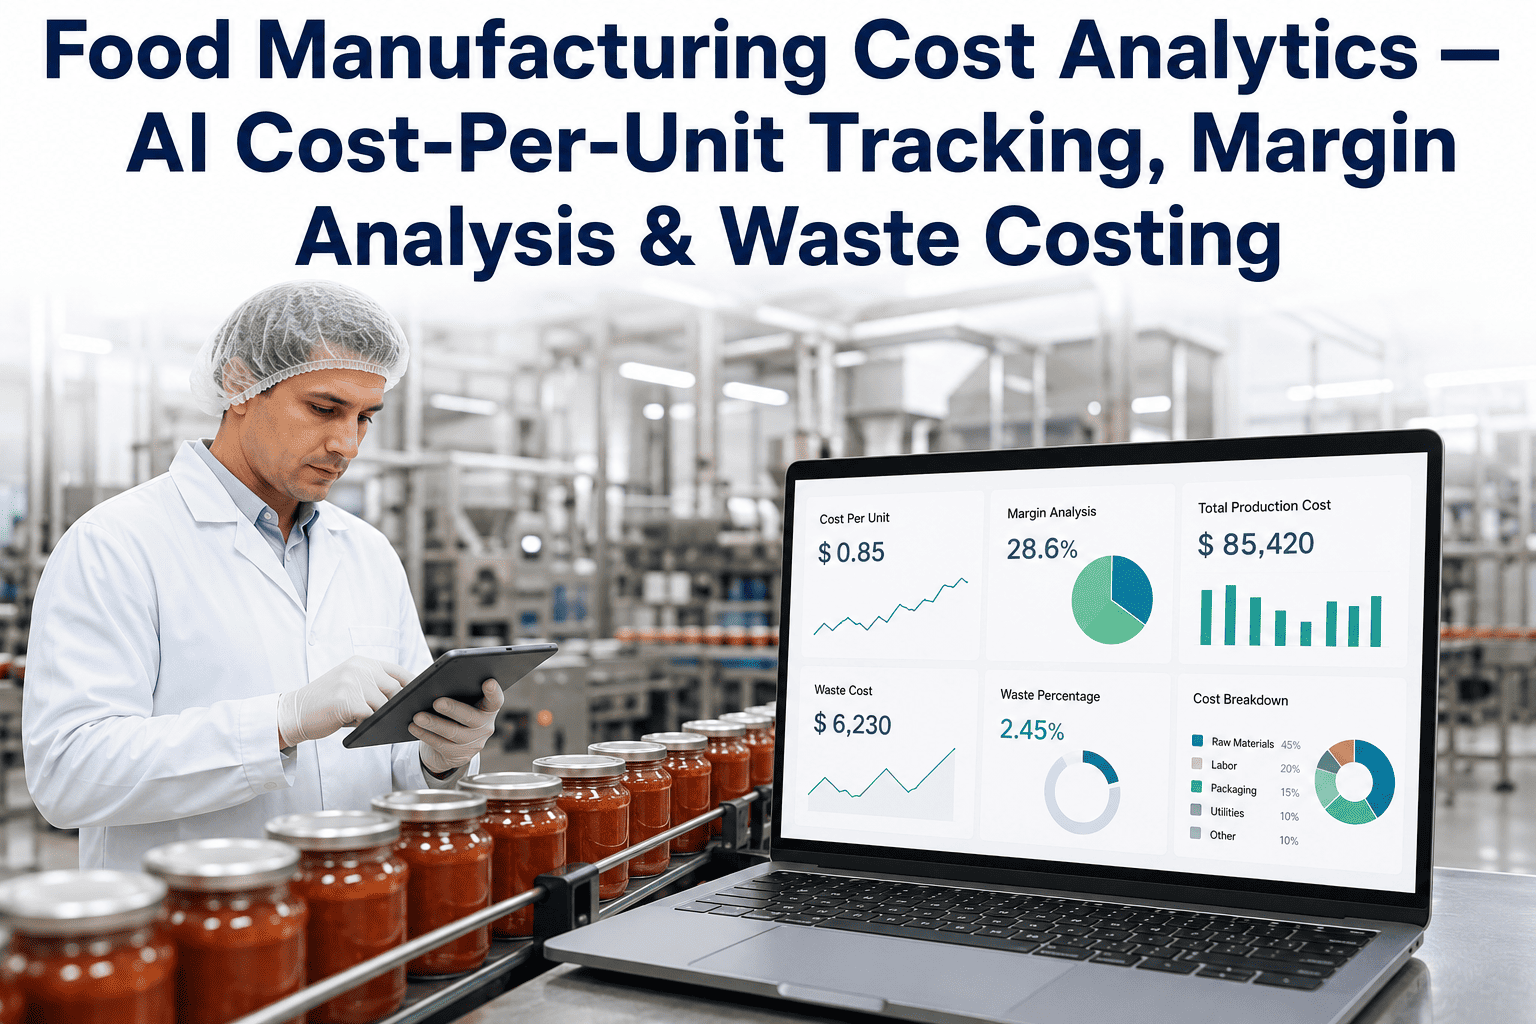
The most meaningful analytics budget metric for any F&B operation is cost per unit produced—the total analytics spend divided by units manufactured in a given period. This single figure anchors every budgeting conversation in operational reality rather than abstract IT spend. A beverage plant producing 12 million units annually with a $480,000 analytics stack runs at $0.04 per unit. When that same investment reduces giveaway by 1.2% and prevents two recall events, the ROI becomes self-evident.
Calculating this figure requires capturing four cost layers: platform licensing fees, sensor hardware and integration costs, internal labor for data operations, and third-party calibration or validation services. Most food plants Book a Demo after realizing they have been tracking only the first layer—dramatically underestimating true analytics spend and therefore misallocating CapEx in subsequent planning cycles.
Platform Licensing
SaaS analytics platforms for food manufacturing typically range from $18,000 to $120,000 annually depending on line count, user seats, and AI module depth. Always negotiate per-line pricing to control scaling costs.
Sensor & Integration CapEx
Hardware instrumentation—load cells, inline checkweighers, vision sensors—represents a one-time capital outlay typically spanning $60,000 to $250,000 for a mid-size plant. Integration to MES or ERP adds 20–35% on top.
Internal Data Labor
Data analysts and quality engineers who manage reporting pipelines represent a recurring OpEx line. Plants without automation spend 14–22 hours per week on manual data collation alone—labor that AI-driven analytics eliminates.
Validation & Audit Services
Third-party metrology validation, FDA audit documentation, and GFSI compliance certification services add $8,000 to $30,000 per year—costs that automated compliance platforms reduce by up to 70%.
Food Manufacturing CapEx Planning for Analytics Infrastructure
Effective food plant CapEx planning for analytics separates investments into three horizons: foundation infrastructure (Years 1–2), intelligence layer (Years 2–3), and autonomous optimization (Year 3+). Plants that skip the foundation layer—rushing to AI dashboards without reliable sensor data—consistently report poor ROI and elevated data quality issues that undermine trust in the entire system. Book a Demo to explore the multi-year roadmap.
The foundation layer is the highest-risk CapEx commitment because it involves physical hardware with 7–10 year depreciation cycles. A poorly specified load cell network or incorrectly positioned vision system is expensive to remediate. AI-driven platforms like iFactory conduct pre-deployment sensor audits to right-size hardware investment—preventing the common pitfall of over-specifying on high-volume lines while under-equipping batching areas. You can Book a Demo to see how iFactory maps sensor requirements to your specific production layout before any capital is committed.
| Investment Horizon | Primary CapEx Focus | Typical Cost Range | Expected ROI Trigger | Depreciation Period |
|---|---|---|---|---|
| Year 1–2 Foundation | Sensor hardware, PLC integration, data historian | $80k – $220k | Month 8–14 | 7–10 years |
| Year 2–3 Intelligence | AI platform licensing, cloud infrastructure, dashboards | $35k – $95k/yr | Month 4–8 | 3–5 years (SaaS) |
| Year 3+ Autonomy | Closed-loop control, predictive maintenance modules | $20k – $60k/yr | Month 3–6 | Ongoing OpEx |
Forecast Your Analytics CapEx with Confidence
iFactory eliminates investment guesswork with live scenario modeling and sensor-level ROI projections for your specific plant floor.
Quantifying Deferred Analytics: The Hidden Cost of Not Investing
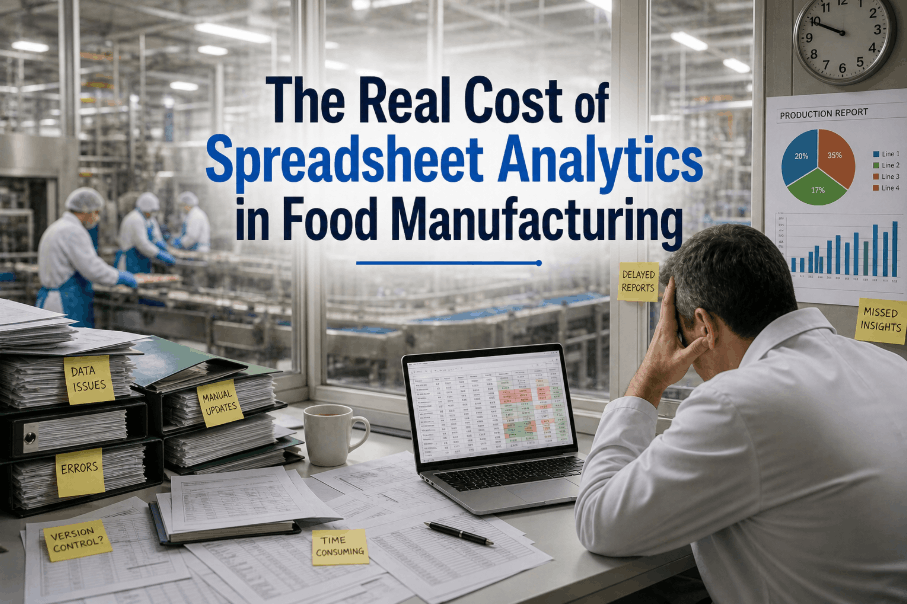
The most overlooked number in any food plant financial planning exercise is the cost of deferred analytics—the compounding financial damage caused by operating without adequate measurement and reporting infrastructure. Unlike capital expenditures that appear in financial statements, deferred analytics costs accumulate invisibly across four domains: product giveaway, undetected batch failures, compliance remediation, and reactive maintenance.
Industry data consistently shows that food plants without real-time analytics spend 340% more on post-production quality remediation than plants with live reporting systems. A single underfill recall event costs an average of $8M–$12M in direct costs—FDA response, product destruction, legal fees, and brand rehabilitation. When viewed through this lens, a $150,000 analytics investment is not an expense; it is insurance with a measurable premium. Plants that have adopted AI-driven analytics report that the book a demo conversation with iFactory is most often triggered by a near-miss recall event that quantified deferred risk for the first time.
How AI-Driven Analytics Reshapes F&B Investment Prioritization
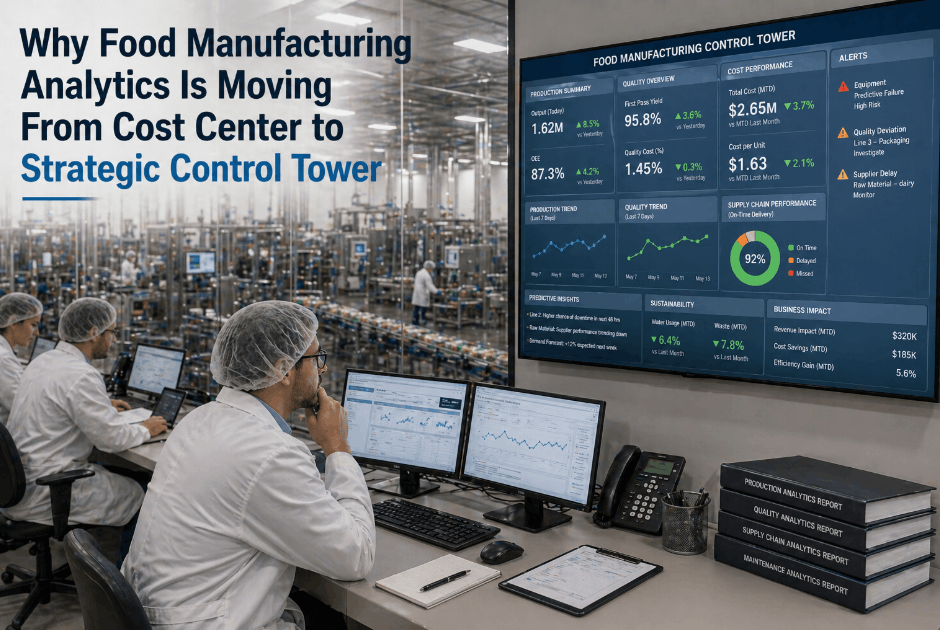
Traditional food plant financial planning relies on annual budget cycles, static ROI models, and gut-feel prioritization from operations directors. AI-driven analytics budgeting inverts this model: the platform continuously scores every potential investment against live production data, surfacing the highest-yield opportunities dynamically rather than at year-end reviews.
iFactory's analytics engine, for example, correlates calibration drift frequency with throughput loss, then ranks capital reinvestment opportunities by projected yield recovery per dollar spent. This evidence-based investment model consistently reduces analytics budget approval cycles from 4–6 months to under 3 weeks. The ability to book a demo and walk finance leadership through live ROI projections is one of the most common iFactory use cases for plant operations teams.
OEE Performance Roadmap: From Baseline to Autonomous Optimization
Building an Evidence-Based F&B Analytics ROI Model
Every food manufacturing analytics investment should be evaluated across three ROI dimensions: direct yield recovery (measurable within 90 days), risk avoidance value (probabilistic but quantifiable), and operational efficiency gains (labor and throughput improvements). Plants that model all three consistently justify higher analytics spend—and realize it faster—than those relying solely on yield calculations. Book a Demo to access our ROI modeling tool.
Direct Yield Recovery Calculation
Start with your current average giveaway rate. Industry benchmarks put this at 0.8%–1.4% for beverage plants and 1.0%–1.8% for portioned protein lines. Multiply your annual production volume by your raw material cost per unit, then apply the expected giveaway reduction from AI-driven checkweigher calibration (typically 15%–22%). A plant producing 10 million 500g units at $0.85 raw material cost per unit with a 1.2% giveaway rate is losing $102,000 annually. A 20% reduction recovers $20,400 per year—before accounting for any other ROI dimension. Book a Demo to see your yield recovery forecast.
Risk Avoidance Value Modeling
Recall risk is actuarial: the probability of an underfill-triggered recall multiplied by the average event cost. For a plant with 65% of calibration failures occurring between scheduled checks (a common industry figure), the annualized risk exposure is substantial. AI-driven analytics that detect drift in real time don't eliminate this risk to zero, but they measurably compress the exposure window from hours to minutes—translating to a statistically defensible reduction in expected loss value that belongs in every CapEx proposal. Book a Demo to model your recall risk exposure.
Operational Efficiency Gains
The third ROI dimension—often undervalued—is the labor hour recovery from eliminating manual data workflows. When a quality engineer spends 18 hours per week compiling compliance reports that an AI platform generates in seconds, the economic cost is not just the labor rate; it is the opportunity cost of a skilled professional not conducting root-cause analysis, supplier quality reviews, or process optimization work. Platforms like iFactory quantify this dimension precisely, showing finance teams the fully-loaded cost of every manual workflow displaced by automation. This framing consistently accelerates budget approval—and you can see the calculation live by requesting a demo session tailored to your plant's specific line configuration and current quality staff headcount.
Food Plant Analytics Budgeting — Frequently Asked Questions
How do I calculate an accurate analytics cost per unit for my food plant?
Divide your total annual analytics spend—platform fees, hardware depreciation, integration labor, and validation services—by total units produced. Track this monthly to identify cost creep early. AI-driven platforms surface this metric automatically, removing manual calculation overhead.
What is a typical CapEx budget for analytics in a mid-size food manufacturing plant?
A mid-size plant (2–6 production lines, $50M–$200M revenue) typically budgets $80,000–$350,000 in initial analytics CapEx, with $35,000–$95,000 in annual OpEx for platform and support. ROI is typically realized within 8–14 months when checkweigher calibration and giveaway reduction are primary use cases.
How do deferred analytics costs appear in financial statements?
They typically don't—which is the core problem. Giveaway shows up as yield variance, rework appears as labor cost, and recall risk remains off-balance-sheet until an event occurs. AI analytics platforms help translate these hidden costs into budget-visible line items, making the investment case concrete for CFOs and plant controllers.
Can AI-driven analytics platforms integrate with existing ERP and MES systems?
Yes. Modern food plant analytics platforms provide API connectors for SAP, Oracle, and most major MES vendors. iFactory specifically supports bidirectional data exchange with production scheduling systems, allowing analytics insights to feed directly into capacity planning and procurement forecasting workflows.
What is the average payback period for food plant analytics investment?
Most plants achieve full payback in 4–14 months, depending on baseline giveaway rate, compliance cost structure, and the degree to which manual workflows are automated. Lines with high throughput and historically loose calibration tolerances tend to see payback in under 6 months.
How should analytics spending be split between CapEx and OpEx in food manufacturing?
Industry best practice suggests 60–70% CapEx (hardware and integration) in Year 1, shifting to 70–80% OpEx (platform, support, and expansion) by Year 3. AI platforms with SaaS pricing allow this transition naturally, converting large upfront hardware-dominated CapEx into predictable monthly operating costs as the sensor infrastructure matures.
Build Your Food Plant Analytics Budget With Real Data
iFactory delivers live cost-per-unit tracking, CapEx scenario modeling, and deferred risk quantification — purpose-built for F&B operations teams.