Predictive analytics ROI for food manufacturing is no longer a theoretical boardroom concept — it is the measurable difference between a plant that leads its category and one that quietly bleeds margin through avoidable downtime, costly recalls, and uncaptured yield. In an industry where a single unplanned line stoppage can cost $50,000 per hour and a Class I recall can wipe out $10 million overnight, the business case for AI-driven analytics investment has never been clearer or more urgent. Book a Demo to see exactly how iFactory's AI-Powered Analytics platform translates sensor data into bottom-line savings your CFO will approve.
Build Your Predictive Analytics Business Case in 30 Minutes
Custom ROI model built around your line configuration, product mix, and compliance risk profile.
Why the ROI of Predictive Analytics in Food Plants Is Underestimated
Most food manufacturers calculate analytics ROI too narrowly — counting only software cost against a single metric. The actual food manufacturing analytics ROI spans five value streams: downtime prevention, recall avoidance, yield optimization, labor reallocation, and compliance automation. Modeled together, payback compresses from the assumed 18–24 months to fewer than 5 months.
Traditional finance teams treat predictive analytics as an IT cost center rather than a production asset. The shift happens when quality directors bring hard benchmark data to the investment conversation. This article provides exactly that framework.
The Five Value Streams: How Food Plant AI-Driven ROI Is Built
A rigorous food plant technology ROI model must account for every lever predictive analytics touches. Below is the framework iFactory uses when building leadership investment cases.
Unplanned Downtime Elimination
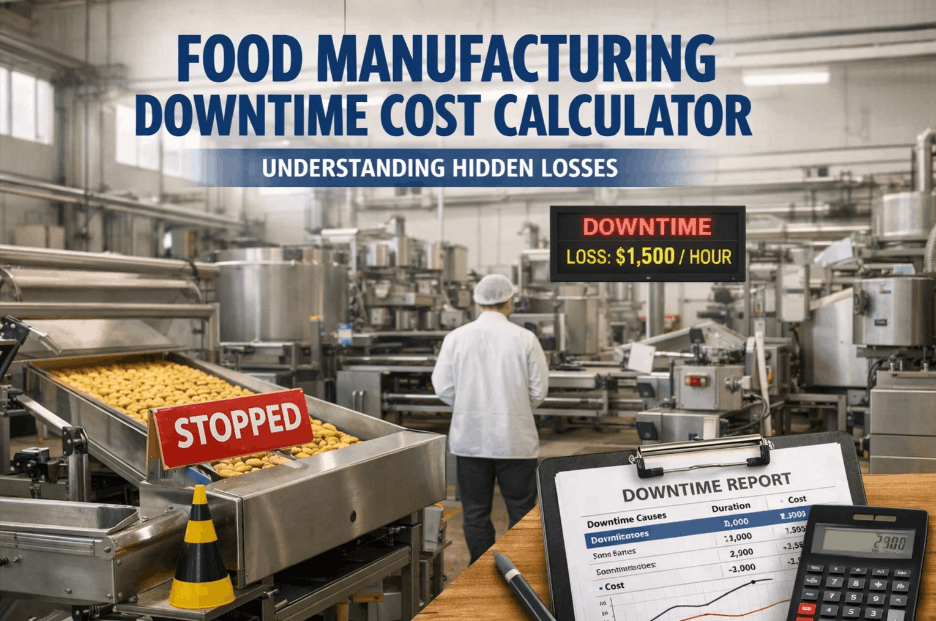
Downtime costs $30K–$70K per hour in lost throughput and perishable waste. Predictive analytics catches degradation 4–6 hours early — turning 8-hour reactive shutdowns into 20-minute planned stops. Book a Demo to model your specific downtime cost profile.
Food Safety Recall Prevention
A single Class I recall averages $10M in direct costs — before brand equity damage. AI flags critical control point deviations in seconds, not hours, closing the detection window before product ships.
OEE Improvement & Yield Optimization
Plants using AI analytics improve OEE by 6–11 points in 12 months — adding $15M+ in production capacity at zero capex. Real-time parameter tuning also recovers 1.5–2.1% of raw material value annually.
Labour & Maintenance Cost Reallocation
Reactive maintenance uses 25–35% more technician hours than predictive. Condition-based work orders cut maintenance labour 18–22% and extend MTBF by 30–40% — saving $360K–$440K on a $2M maintenance budget.
Compliance Automation & Audit Savings
GFSI and FDA audit prep consumes 400–800 labour hours per plant annually. Auto-generated, audit-ready records cut that burden by 60–75%, freeing quality staff for higher-value inspection work.
Predictive Analytics Savings Benchmarks by Food Segment
Food plant technology ROI varies by segment due to perishability, regulatory exposure, and throughput velocity. The table below provides industry-validated benchmarks across four major categories.
| Segment | Primary ROI Driver | Downtime Cost/hr | Recall Risk | Payback | Year-1 ROI |
|---|---|---|---|---|---|
| Beverage & Dairy | Yield + OEE | $45K–$65K | High (allergen) | 3–5 months | 4.8× |
| Poultry & Meat | Recall prevention | $50K–$80K | Very High (pathogen) | 2–4 months | 6.2× |
| Bakery & Confectionery | OEE + waste reduction | $25K–$45K | Medium (allergen) | 5–7 months | 3.4× |
| Snack & Dry Foods | Yield + compliance | $20K–$40K | Medium (labelling) | 6–9 months | 2.9× |
Even in the most conservative segment, predictive analytics ROI exceeds 2.9× in year one. For protein processing, the AI analytics business case is virtually irrefutable.
Building the Leadership Presentation: A 5-Slide Business Case Framework
Analytics investment stalls not because ROI is weak, but because the case is built in technical language instead of financial language. Here is the proven five-slide framework iFactory uses to help QA directors secure CFO approval.
Common Objections to Food Analytics Investment — and How to Answer Them
Even strong business cases face predictable pushback. Here are the five most common objections and the data-backed responses that move leadership forward. Book a Demo to get a customised objection-handling guide built around your specific plant.
"Our data quality is too poor for this to work."
iFactory's ingestion layer handles missing sensor readings, inconsistent timestamps, and multi-vendor PLC formats automatically. Data quality improves as the system runs — not before. Plants with imperfect data still capture 70–80% of available ROI in year one.
"We don't have the IT resources to implement this."
iFactory deploys as a managed SaaS service. The OT integration team handles the full implementation — connecting edge hardware to existing SCADA and MES systems — with no internal coding required.
"The ROI projections seem too optimistic."
Discount every value stream by 50% — ROI remains strongly positive in year one for plants with more than two lines. iFactory also offers a 90-day pilot with measured baseline vs. outcome reporting so ROI is demonstrated before full commitment.
"We already have ERP and MES — isn't that enough?"
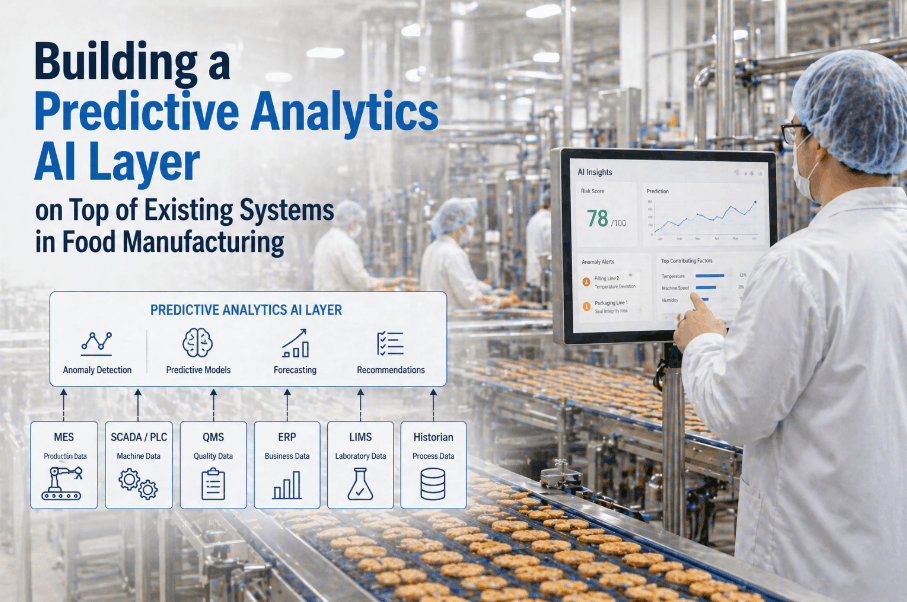
ERP and MES record what happened. Predictive analytics determines what is about to happen. iFactory ingests data from existing systems to enrich its models — amplifying the current investment, not replacing it.
"How do we measure success after go-live?"
iFactory's ROI dashboard tracks all five value streams in real time against the pre-implementation baseline — downtime events, yield improvements, and compliance hours — with a formal monthly report delivered to leadership.
The Predictive Analytics Maturity Curve for Food Manufacturing
Food plant technology ROI scales with maturity. Early-stage plants capture 30–40% of available value; fully AI-driven plants capture 85–100%. Book a Demo to receive a maturity assessment for your specific line configuration.
| Maturity Level | Capability | ROI Capture | Typical Plant Profile |
|---|---|---|---|
| Level 1 — Reactive | Manual data, spreadsheets | 0–10% | Single-site, <$50M revenue |
| Level 2 — Descriptive | Historian data, basic dashboards | 15–30% | Multi-line, MES deployed |
| Level 3 — Diagnostic | Root cause tooling, connected OT/IT | 35–55% | Multi-site, ERP+MES integrated |
| Level 4 — Predictive | ML failure prediction, real-time alerts | 65–80% | Enterprise, AI-analytics active |
| Level 5 — Prescriptive AI | Autonomous optimisation, closed-loop | 85–100% | Category leader, full AI-driven ops |
From Business Case to Go-Live: iFactory's 90-Day ROI Sprint
The fear of long, disruptive implementation cycles is one of the biggest barriers to analytics investment. iFactory's 90-Day ROI Sprint delivers measurable savings before the end of the first financial quarter.
Edge hardware connects to priority lines. Historical OEE, downtime, and quality data is ingested and a 30-day performance baseline is set for every KPI — no production disruption, no internal IT resources needed.
AI models train on live plant data, learning failure signatures and thermal drift patterns. Predictive alerts go live for the top-5 failure modes with mobile notifications and automated work order generation.
Every prevented stoppage and yield gain is logged against the baseline. A formal ROI report at day 90 shows documented savings vs. investment. Confirmed plants proceed to full deployment with terms already agreed.
See Measurable ROI Before You Fully Commit
iFactory's pilot program delivers a documented ROI report in 90 days — no long contracts, no production disruption required.
Frequently Asked Questions
Still evaluating whether iFactory is right for your plant? Here are the questions our engineering team hears most often from food and beverage operations leaders.
What types of food plant equipment does iFactory support?
iFactory connects to checkweighers, multi-head weighers, fillers, pasteurisers, retorts, conveyors, and cold-room HVAC systems via OPC-UA, Modbus, and direct PLC API integration — covering 98% of equipment found in modern food and beverage plants.
How long does it take to see the first predictive alert?
Most plants receive their first live predictive alert within 7–10 days of edge hardware installation. The AI model refines accuracy over 30 days as it learns equipment-specific degradation patterns unique to your line.
Is iFactory compliant with FDA 21 CFR Part 11?
Yes. Every calibration event, process deviation, and corrective action is recorded with a secure hash, digital signature, and timestamp — meeting all 21 CFR Part 11 requirements for electronic record integrity and accountability.
Can iFactory integrate with our existing SQF or GFSI audit portals?
Yes. iFactory provides a direct API for SQF and GFSI-compliant logbooks, pushing time-stamped, uneditable quality records directly into your audit data lake in real time — eliminating manual data entry entirely.
What is the typical contract structure?
iFactory offers a 90-day pilot with no long-term commitment. Plants that validate ROI during the pilot move to an annual subscription. Multi-site enterprise agreements are available with volume pricing and dedicated customer success support.
Get a Custom ROI Model Built for Your Plant
iFactory engineers model your downtime costs, recall exposure, OEE gap, and yield opportunity — and show you the payback month in your first conversation.