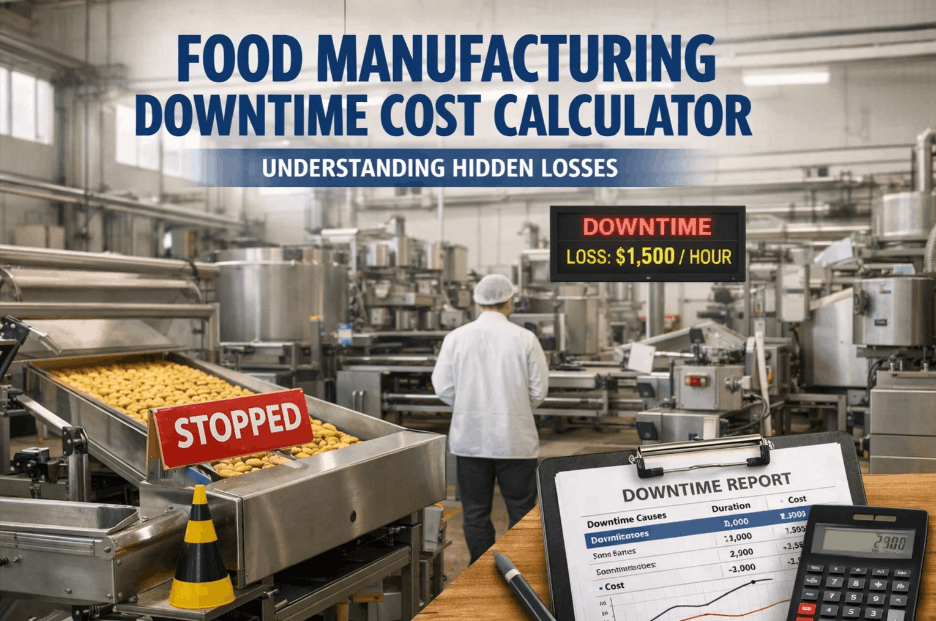
Food manufacturing downtime is one of the most costly and underestimated threats facing production facilities today. Whether caused by equipment failure, unplanned maintenance, allergen changeovers, or supply chain disruptions, every minute of unplanned stoppage translates directly into measurable financial loss — yet most food plants still lack a systematic way to calculate, track, and reduce these hidden costs. A food manufacturing downtime cost calculator gives operations managers and plant directors the data clarity they need to quantify production losses, prioritize capital investments, and build the business case for AI-driven analytics platforms. In this guide, we break down how to accurately measure the true cost of downtime, identify the hidden loss categories most manufacturers overlook, and explain how modern analytics ROI software transforms raw stoppage data into actionable cost reduction strategies. Book a demo to see how iFactory's downtime analytics platform works in real food manufacturing environments.
Stop Estimating Downtime Losses — Get Real-Time Production Cost Visibility
iFactory's AI-driven production analytics platform gives food plants real-time visibility into every stoppage event, root cause, and cost impact — turning hidden losses into recoverable revenue across your entire facility.
What Is Food Manufacturing Downtime and Why Does It Cost More Than You Think?
In food manufacturing, downtime refers to any period during which a production line, piece of equipment, or entire facility is not operating at its planned capacity. This includes both unplanned downtime — sudden equipment failures, contamination events, and emergency shutdowns — and planned downtime such as sanitation windows, CIP (clean-in-place) cycles, and scheduled maintenance. Industry research consistently shows that food and beverage manufacturers lose between 5% and 20% of total production capacity to unplanned stoppages annually, with the average mid-sized food plant experiencing losses exceeding $250,000 per month when all cost categories are properly accounted for.
The fundamental problem is that most facilities only measure the obvious — the direct labor and material costs associated with a production stop. The deeper, hidden cost layers — including spoiled perishable inventory, regulatory re-inspection requirements, customer penalty clauses, and downstream schedule disruptions — remain invisible without a structured production loss calculator methodology. Understanding the full cost architecture of downtime is the first step toward building a compelling ROI case for analytics investment. You can book a demo with iFactory to walk through a cost model scoped to your specific facility and product category.
The 6 Hidden Cost Layers in Food Plant Downtime Cost Analysis
Most downtime cost analyses capture only 30–40% of the true financial impact. Here are the six cost layers that the best food plant downtime cost calculators must account for.
Direct Production Loss
The most visible cost: units not produced multiplied by the net margin per unit. For high-throughput lines producing 50,000+ units per hour, even a 30-minute unplanned stop can eliminate an entire day's profit margin.
Perishable Inventory Waste
When a line stops unexpectedly, in-process batches may exceed safe holding windows, triggering mandatory disposal. A single contamination-related shutdown can write off $15,000–$80,000 in perishable raw material value in hours.
Labor Inefficiency Costs
Idle staff, overtime for catch-up shifts, and supervisor time on incident documentation accumulate rapidly. For three-shift facilities, unplanned stoppages trigger cascading labor cost multipliers that dwarf the initial production loss figure.
Regulatory and Compliance Costs
Under FSMA 21 CFR Part 117, CCP-linked equipment failures require documented corrective actions and product holds. The administrative cost of managing a compliance event frequently exceeds $20,000 per incident for mid-sized manufacturers.
Customer Penalty and SLA Costs
Major retailers embed delivery penalties into supplier contracts. Missing fill rate commitments triggers financial penalties of 1%–5% of affected order value — plus the longer-term risk of losing preferred supplier status entirely.
Maintenance and Repair Escalation
Emergency maintenance callouts cost 3–5× more than planned preventive work for the same repair scope. Predictive analytics platforms reduce emergency maintenance frequency by up to 40% by identifying equipment degradation before failure.
How to Build a Food Manufacturing Downtime Cost Calculator
An accurate production stoppage cost analysis requires a structured formula that captures all six cost layers described above. The core calculation begins with your facility's hourly production value — total annual revenue divided by planned production hours — and builds upward through each cost category. For most food manufacturers, the resulting figure is significantly higher than leadership initially estimates, which is why booking a demo with an analytics specialist to build a facility-specific model is one of the highest-ROI activities a plant director can undertake.
Step-by-Step Downtime Cost Calculation Process
Building a defensible downtime cost model requires five steps: establish your baseline hourly production value using actual revenue and shift data; categorize all downtime events from the past 12 months; apply category-specific cost multipliers based on product type, customer contract terms, and regulatory exposure; aggregate hidden costs using actual labor records and maintenance invoices; and finally benchmark your results against the food industry average of $1,800–$4,200 per hour of unplanned downtime. AI-driven analytics ROI software compresses this entire workflow into a real-time dashboard. Book a demo to see how iFactory automates downtime cost tracking for food manufacturing facilities of all sizes.
Food Industry Downtime Cost Benchmarks by Category
How does your facility compare to industry benchmarks? The table below shows average unplanned downtime costs by food manufacturing category, including all six hidden cost layers.
| Food Manufacturing Category | Avg. Unplanned Downtime/Month | Direct Cost/Hour | True Cost/Hour (All Layers) | Annual Hidden Loss |
|---|---|---|---|---|
| Ready-to-Eat / Deli | 18–26 hrs | $1,200 | $3,100 – $4,800 | $670K – $1.5M |
| Dairy Processing | 12–20 hrs | $1,800 | $3,800 – $5,400 | $548K – $1.3M |
| Meat & Poultry | 20–32 hrs | $2,100 | $4,200 – $6,800 | $1.0M – $2.6M |
| Bakery & Snack Foods | 10–16 hrs | $800 | $1,800 – $2,900 | $216K – $557K |
| Beverage Manufacturing | 8–14 hrs | $1,400 | $2,600 – $4,100 | $250K – $689K |
| Seafood Processing | 16–24 hrs | $1,600 | $3,400 – $5,200 | $653K – $1.5M |
Source: Industry composite data from food manufacturing operations analytics. True cost figures include all six hidden cost layers. Individual facility results vary based on product mix, customer contract terms, and regulatory profile.
How AI-Driven Analytics ROI Software Reduces Food Plant Downtime Costs
Understanding your downtime cost is only the first half of the equation. The second half is deploying analytics infrastructure that actively reduces both the frequency and duration of production stoppages. Modern manufacturing loss calculator platforms use machine learning models trained on equipment sensor data, maintenance history, and production parameters to predict failures before they occur, recommend optimal maintenance windows, and automatically generate FSMA-compliant documentation. Facilities that deploy predictive analytics platforms typically see unplanned downtime reduction of 25–45% within the first 12 months. Book a demo to receive a custom ROI projection for your specific facility profile.
Real-Time OEE Tracking and Production Loss Attribution
Overall Equipment Effectiveness (OEE) is the primary KPI connecting downtime events to financial outcomes. An advanced analytics platform continuously calculates OEE across all production lines, automatically attributes losses to availability, performance, or quality categories, and surfaces the highest-priority improvement opportunities in a ranked cost-impact view — eliminating 8–15 hours of manual engineering reporting per week.
Predictive Maintenance Scheduling for Food Processing Equipment
Equipment failure accounts for 38–52% of all unplanned stoppage events in food manufacturing. Predictive maintenance algorithms analyze vibration, temperature, motor current, and cycle time data to identify degradation patterns weeks before failure — enabling maintenance teams to schedule interventions during planned windows rather than responding reactively to costly line stoppages.
Changeover and Sanitation Time Optimization
Allergen changeovers, CIP sanitation cycles, and product format changes often consume as much total line time as unplanned stoppages. Analytics platforms that track actual changeover performance against targets and benchmark results across shifts can reduce planned downtime by 15–30% without any capital equipment investment.
Analytics ROI Calculator: What Food Plants Typically Recover
The following ROI framework is based on actual outcomes from food manufacturing facilities deploying AI-driven production analytics platforms.
Achieved within the first 12 months of deploying predictive analytics and real-time OEE monitoring across production lines.
Based on downtime cost reduction alone, before accounting for quality improvement, compliance cost reduction, and labor efficiency gains.
Predictive maintenance shifts reactive repair costs to planned maintenance, eliminating emergency callout premiums and parts expediting fees.
For every dollar invested in analytics software and deployment, food manufacturers recover an average of $3.20 in documented downtime cost reduction within 12 months.
Building the Business Case: Presenting Downtime ROI to Food Plant Leadership
One of the most common challenges facing operations managers is translating downtime cost data into a capital investment decision that resonates with plant leadership and corporate finance teams. The key is presenting downtime not as an operational problem, but as a quantified revenue leakage issue with a documented, achievable recovery pathway. A well-constructed downtime ROI presentation should lead with the total hidden cost figure, followed by a benchmarked comparison showing where the facility stands relative to industry peers.
Using a 25% downtime reduction assumption applied to the documented annual downtime cost, most mid-sized food plants can demonstrate a sub-12-month payback period — a hurdle rate that meets most corporate capital approval thresholds. Book a demo with iFactory's team, and we will help you build a customized, finance-ready ROI model using your facility's actual production and maintenance data.
Key Metrics to Include in Your Downtime Cost Business Case
A credible downtime cost business case should include total annual unplanned downtime hours segmented by root cause, total cost per hour (including all six hidden layers), current OEE baseline versus industry benchmark, projected OEE improvement from analytics deployment, and the resulting annual cost recovery in dollars. Supporting data from maintenance records, production logs, and customer penalty invoices strengthens the model significantly and accelerates leadership approval timelines.
Food Manufacturing Downtime Cost: Frequently Asked Questions
Implementing a Downtime Cost Tracking Program in Your Food Plant
The journey from manual downtime logging to AI-driven production loss analytics is a structured process most food plants can execute in 6–10 weeks without disrupting active production. The foundation is establishing consistent downtime event capture at the line level — every stoppage coded by duration, category, equipment, and shift — feeding a centralized data model that powers real-time dashboards and retrospective trend analysis. This data infrastructure also serves as the backbone of FSMA corrective action documentation, creating dual value for both production efficiency and regulatory compliance programs.
Phase two involves layering predictive analytics capabilities onto the data foundation — connecting equipment sensor feeds, maintenance records, and quality data to machine learning models trained to identify failure precursors for your specific equipment fleet. Most food plants achieve their target ROI milestone during or immediately following this phase. To start the process for your facility, book a demo and receive a deployment roadmap scoped to your plant size and current analytics maturity level.
Your Downtime Is Costing More Than You Know. Let's Quantify It.
iFactory calculates the true cost of every stoppage event in your food plant — including all six hidden cost layers — and delivers the predictive insights needed to reduce unplanned downtime by 25–45% in the first year.