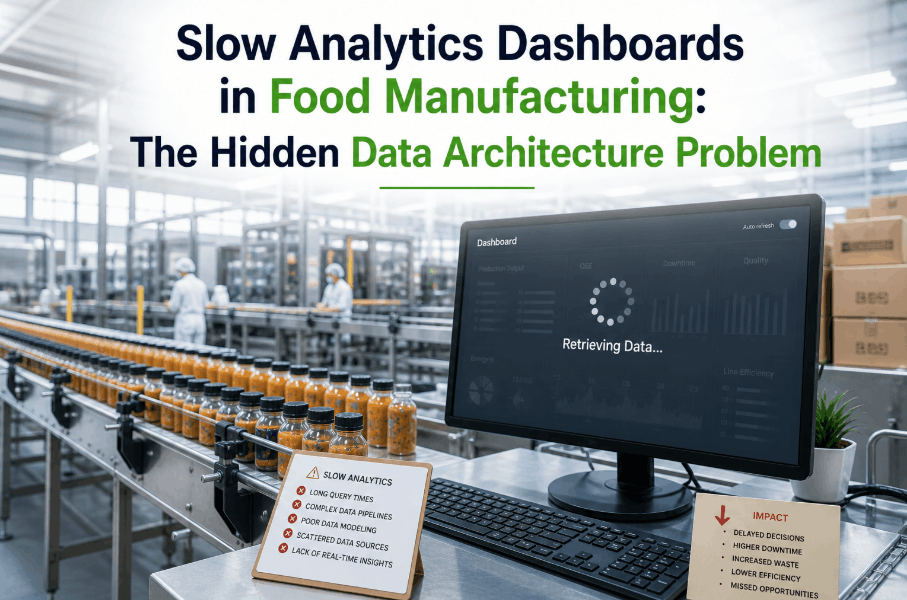
Food manufacturing plants generate millions of data points every shift — yet most analytics platforms fail to turn that data into decisions fast enough to matter. The root issue is not your dashboard software or your reporting tool. It is the AI-powered analytics data layer — or the absence of one — sitting beneath your entire production intelligence stack. In 2026, food manufacturers who have deployed an intelligent analytics infrastructure are outpacing competitors on yield, quality, and uptime not because they have better sensors, but because their data processing engine actually works in real time. If your analytics platform still shows production events from 90 minutes ago, the architecture underneath it needs to change — not the visualization layer on top. To see how an AI-driven analytics data platform eliminates these gaps in live food manufacturing environments, Book a Demo with the iFactory team today.
What Is an AI-Powered Analytics Data Layer in Food Manufacturing?
Defining the Intelligence Infrastructure Between Your Production Systems and Your Dashboards
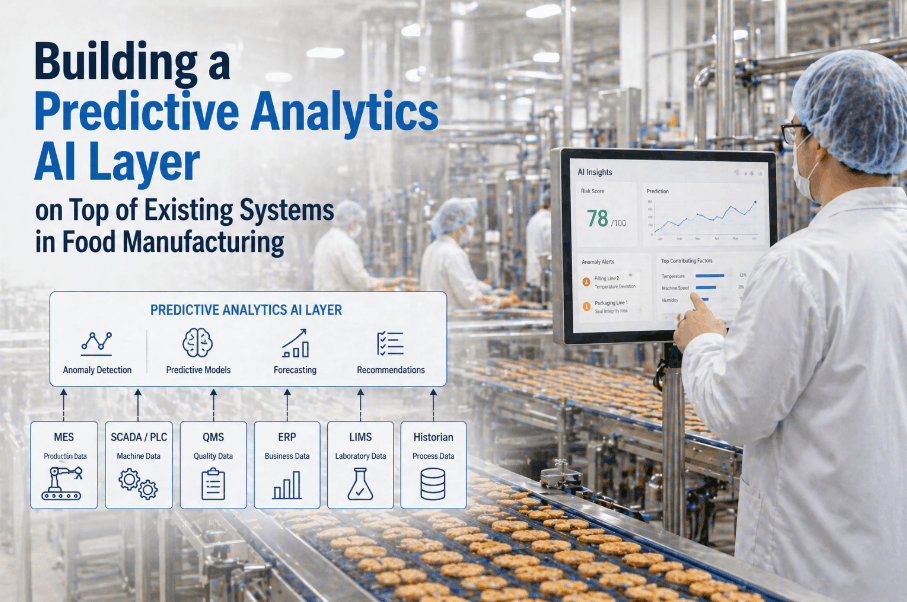
An AI-powered analytics data layer is the infrastructure tier that sits between raw production data sources and the analytics interfaces that operators, quality managers, and plant directors rely on. It is not a dashboard. It is not a historian. It is the intelligent data processing engine that ingests, transforms, enriches, and serves production data at the speed and granularity that real-time manufacturing analytics demands. In food manufacturing environments, this layer must handle OPC-UA signals from packaging lines, batch records from ERP systems, quality inspection results from inline vision systems, environmental sensor streams from cold storage zones, and MES event logs — all simultaneously, all with sub-second ingestion latency, and all normalized into a unified data model that analytics and AI applications can query without delay. Without this layer, every analytics tool you deploy — regardless of how advanced its AI features appear — is querying fragmented, stale, or inconsistently formatted data. The result is the slow dashboards, missed alerts, and unreliable KPIs that food manufacturing teams have accepted as normal for far too long. Manufacturers ready to eliminate these failures can Book a Demo and see the platform architecture running in a live plant environment.
Why Legacy Analytics Pipelines Fail Food Manufacturing Operations
The Structural Gaps That Prevent Traditional Data Pipelines From Delivering Real-Time Intelligence
Most food manufacturing analytics platforms were built on batch-oriented data pipelines designed for reporting — not for real-time operational intelligence. These architectures pull data from production systems on scheduled intervals, transform it in sequential ETL jobs, and load it into data warehouses configured for historical analysis. The gap between what happens on the production floor and what your analytics platform displays is structural, not incidental. When a CIP cycle deviates from its validated parameters, your food safety team needs to know within seconds — not the next time the hourly ETL job completes. When a filling line drops below target weight tolerance, your production manager needs an alert before the batch completes — not after a compliance report runs overnight. Legacy analytics pipelines also force all workloads — real-time operational monitoring, shift summary reporting, and multi-year compliance archives — through the same query infrastructure. This architectural mismatch produces chronic performance failures across every analytics use case simultaneously. The only path forward is replacing the pipeline itself with an intelligent analytics data processing engine designed specifically for food manufacturing production environments. Manufacturers experiencing these failures can Book a Demo for a root-cause infrastructure assessment.
Core Components of an AI-Driven Analytics Data Processing Engine
The Five Infrastructure Layers That Power Intelligent Food Manufacturing Analytics
A production-grade AI analytics data platform for food manufacturing is not a single tool — it is a layered infrastructure architecture where each tier performs a specific function within the production data lifecycle. Manufacturers planning an intelligent analytics infrastructure upgrade can Book a Demo to walk through how each component maps to their existing production systems. The five layers below are the building blocks of every high-performance analytics deployment iFactory has delivered in food manufacturing environments.
AI-Powered Predictive Analytics Pipeline: Beyond Real-Time Reporting
How Intelligent Data Infrastructure Enables Forecasting in Food Manufacturing Environments
Real-time visibility is the baseline capability of a modern food manufacturing analytics platform — but the most competitive manufacturers have moved beyond displaying what is happening now to predicting what will happen next. A predictive analytics pipeline built on an AI-powered data layer enables food plant operators to receive alerts about equipment degradation before failure occurs, yield deviation warnings before batch completion, and quality non-conformance forecasts before product reaches hold status. This capability is not achievable by adding a machine learning module to a reporting-optimized data warehouse. It requires a dedicated feature store architecture, a streaming inference engine, and a data quality layer that ensures ML models receive clean, contextualized input from every production data source. The performance difference between batch-scored predictive systems and real-time inference pipelines is measured in hours versus seconds — a gap that directly translates into product waste, unplanned downtime, and compliance exposure in food manufacturing operations. Food manufacturers ready to extend their analytics platform to include predictive capabilities can Book a Demo to review iFactory's feature store architecture in a live deployment.
Performance Benchmarks: Legacy Analytics Pipeline vs. AI-Driven Data Layer
Quantified Improvements Delivered by Intelligent Analytics Infrastructure in Food Manufacturing
The impact of replacing a legacy analytics pipeline with an AI-driven data processing engine is measurable across every dimension of production analytics performance. The benchmarks below reflect observed outcomes across food manufacturing deployments that migrated from traditional batch-ETL architectures to iFactory's AI-powered analytics data platform.
| Analytics Performance Metric | Legacy Analytics Pipeline | AI-Powered Data Layer | Improvement Factor |
|---|---|---|---|
| Production Data Freshness | 60–120 minutes (batch) | <5 seconds (streaming) | 720–1440× more current |
| Dashboard Query Response | 18–42 seconds | 0.8–2.1 seconds | 10–15× faster |
| Quality Alert Detection Latency | 45–90 minutes post-event | 6–20 seconds post-event | 250–500× faster |
| Predictive Model Inference | 30–60 minute scoring cycles | 2–7 seconds per prediction | Real-time vs. batch |
| Concurrent Analytics Users | 4–10 users before degradation | 60–250 users stable | 15–25× higher concurrency |
| Historical Query (12-month range) | 6–15 minutes | 10–28 seconds | 30–50× faster |
| Cross-System KPI Consistency | Manual reconciliation required | Automated semantic alignment | Eliminated reconciliation |
AI Infrastructure Design Principles for Food Manufacturing Analytics
What Separates a Production-Grade Data Layer From a Proof-of-Concept Analytics Architecture
Many food manufacturers have attempted AI analytics initiatives that delivered impressive pilot results but failed to scale to full production deployment. The failure point is almost always architectural — not algorithmic. A predictive analytics pilot running against a curated sample dataset performs well because the data is clean, the query scope is narrow, and concurrency is low. Production deployment exposes every architectural compromise that the pilot environment obscured. Production-grade AI infrastructure design for food manufacturing analytics requires five non-negotiable principles: fault-tolerant streaming ingestion that maintains data continuity during network interruptions; schema versioning that handles production system upgrades without breaking downstream analytics; multi-tenant query isolation that prevents compliance archive workloads from degrading operational dashboard performance; data lineage tracking that enables root-cause investigation of KPI anomalies back to specific production events; and a semantic data governance layer that ensures analytics outputs remain interpretable across shift rotations, system updates, and team changes. Manufacturers evaluating AI infrastructure design approaches for their analytics upgrade can Book a Demo to review how iFactory implements each of these principles in food plant environments.
Implementation Roadmap: Deploying an AI Analytics Data Layer in Food Manufacturing
A Phased Migration Plan That Delivers Analytics Performance Improvements Without Production Disruption
Deploying an AI-powered analytics data layer in a food manufacturing environment does not require a full production cutover or a greenfield infrastructure build. The phased approach below reflects the migration sequence that iFactory uses to transition food manufacturers from legacy analytics pipelines to intelligent data infrastructure — delivering measurable analytics performance improvements at each stage while maintaining continuity of existing production monitoring systems throughout the migration.
Frequently Asked Questions
What is an AI-powered analytics data layer in food manufacturing?
It is the intelligent infrastructure tier between your production systems and analytics dashboards — handling real-time ingestion, semantic transformation, tiered storage, and ML feature computation so every analytics workload receives clean, contextualized, and current production data.
How does a predictive analytics pipeline differ from a reporting pipeline in food plants?
Reporting pipelines aggregate historical records on demand. Predictive pipelines maintain live ML feature stores and run inference models against streaming production data within seconds — enabling failure forecasting before events occur rather than analysis after they do.
Can an AI analytics data layer integrate with existing historians and MES systems?
Yes. A production-grade data layer includes native connectors for OSIsoft PI, Ignition, WonderWare, SAP, and major MES platforms — ingesting data in real time without requiring modifications to existing production systems or historian configurations.
How long does it take to deploy an AI-driven analytics data platform in a food manufacturing plant?
Initial streaming pipeline deployment and dashboard performance improvements are typically achieved within 60–90 days. Full predictive analytics activation, including ML feature store and inference pipeline deployment, follows a 6–10 month phased roadmap.
What is a semantic data model and why does food manufacturing analytics require one?
A semantic data model maps raw production signals to business context — asset hierarchy, recipe, shift, quality event — so analytics queries return production-aware results without requiring complex joins. It eliminates the cross-system data reconciliation that makes legacy analytics outputs unreliable.
How does hot/cold storage tier separation improve analytics performance in food plants?
Separating the last 30–90 days of operational data into a fast hot tier means production dashboards never compete with compliance archive queries — reducing dashboard load times by 10–15× and eliminating query timeout failures during peak shift-change access periods.
Will migrating to an AI analytics data layer require replacing existing dashboards?
No. Existing dashboards built on Grafana, Power BI, Tableau, or purpose-built manufacturing BI tools continue to operate — they simply connect to the optimized data layer instead of legacy source systems, immediately benefiting from improved query performance and data freshness without frontend redesign.