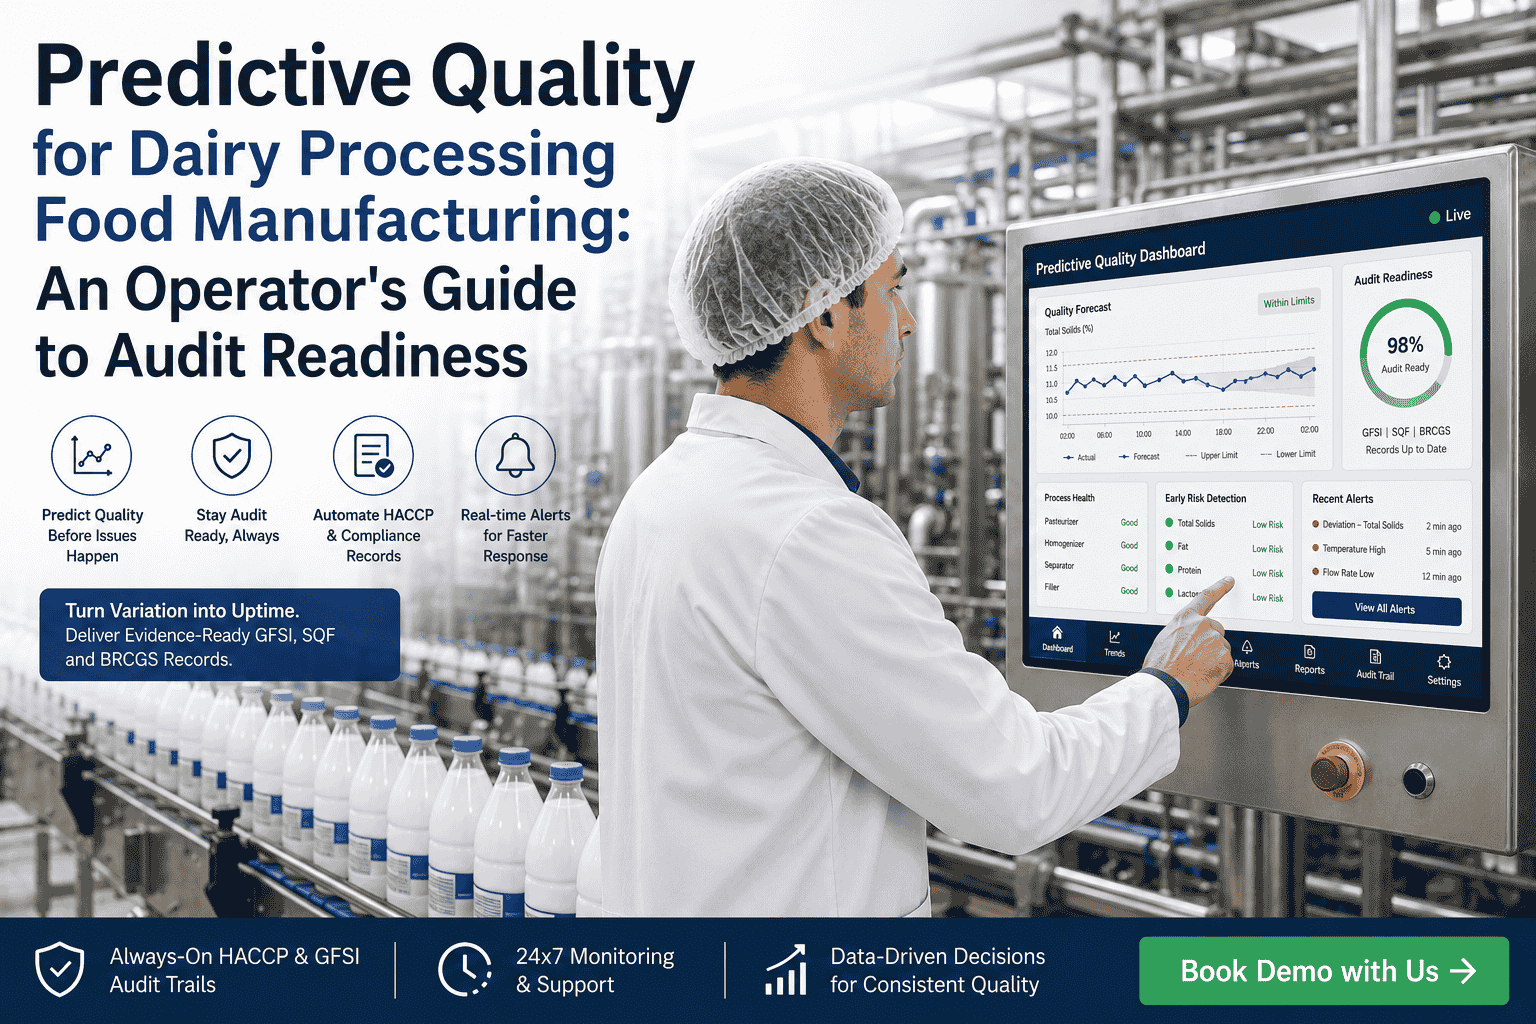
If you run a dairy line and your job includes the words "consistency" or "Cpk," you already know the problem. Two batches of yogurt come off the line on the same day, same starter culture, same ingredients — and one is firm and the other slightly runny. Two pallets of cottage cheese from consecutive vats, both within spec on the chemistry sheet, but the texture is different enough that one customer flags it and the other doesn't. The QA lab catches some of it after the fact; the customer-complaints database catches the rest. The root cause is almost never a single parameter out of spec — it's the way the four or five interacting variables drifted together across a long run, in a pattern no single SPC chart was tuned to detect. Predictive quality analytics handles this. AI models trained on your historical batch records combine in-process measurements continuously — temperature curves, hold times, pH profiles, agitator speeds, ingredient batch IDs — to forecast the final quality outcome before the batch is finished. You see the predicted firmness, predicted moisture, predicted Cpk, and the recommended in-process adjustment to land each batch on target. Across a 12-month deployment, batch-to-batch variation tightens by 30–60%, customer complaints drop, and "this batch is different" stops appearing on the daily handover. iFactory delivers this on a turnkey on-premise NVIDIA appliance or fully managed cloud — same predictive quality stack, your deployment choice.
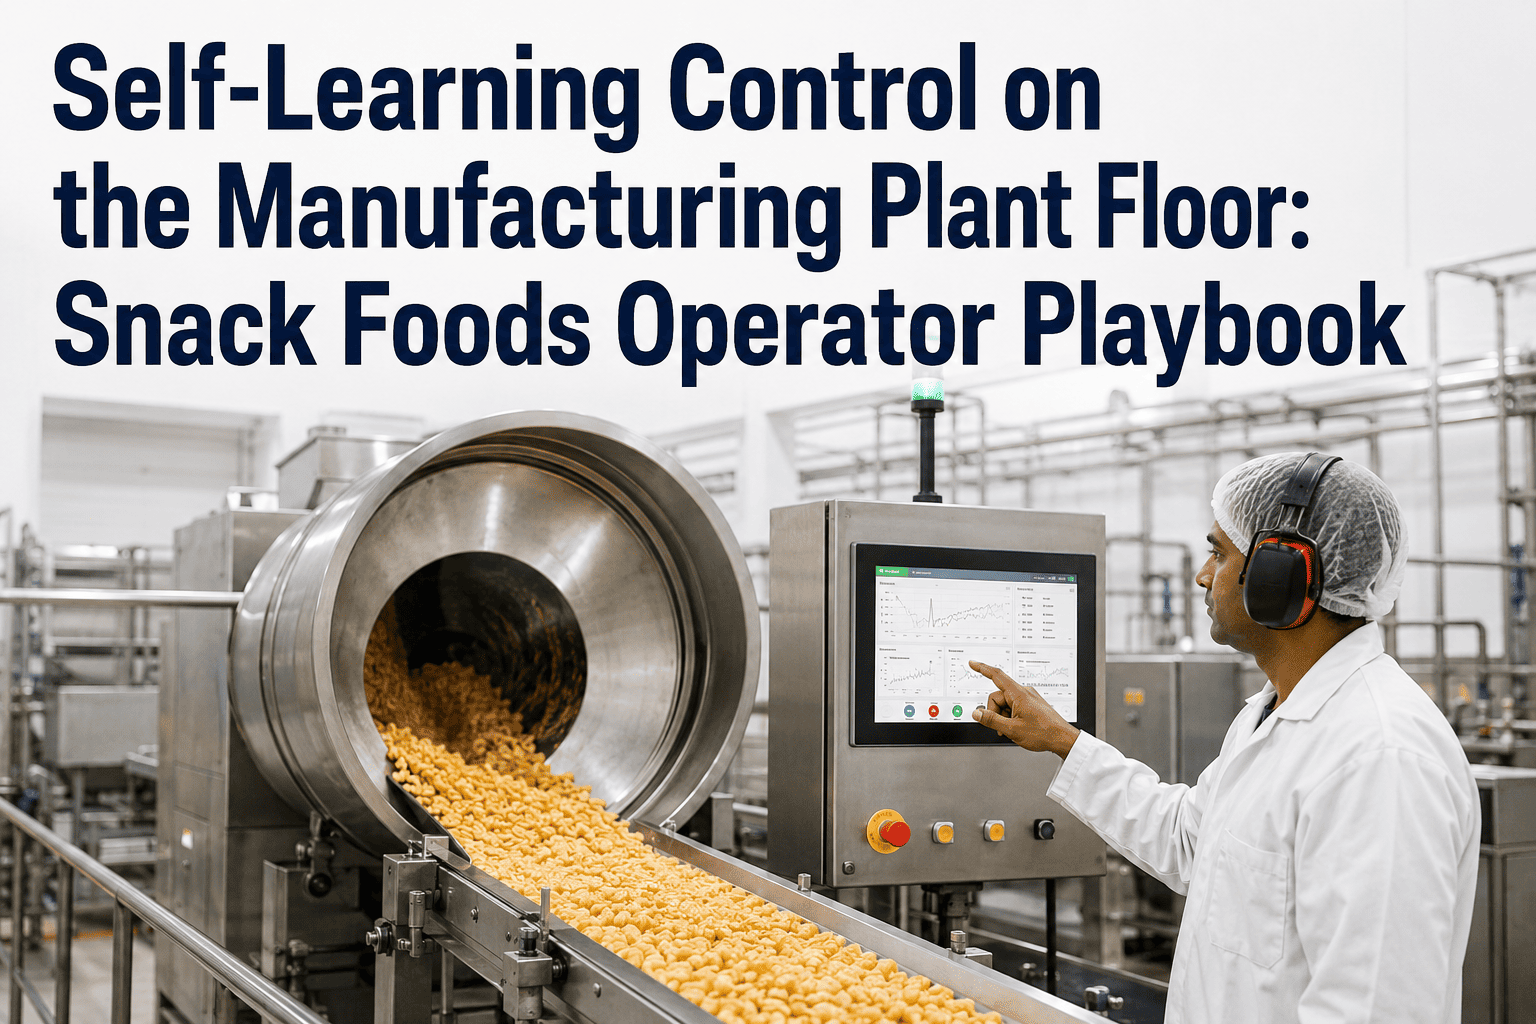
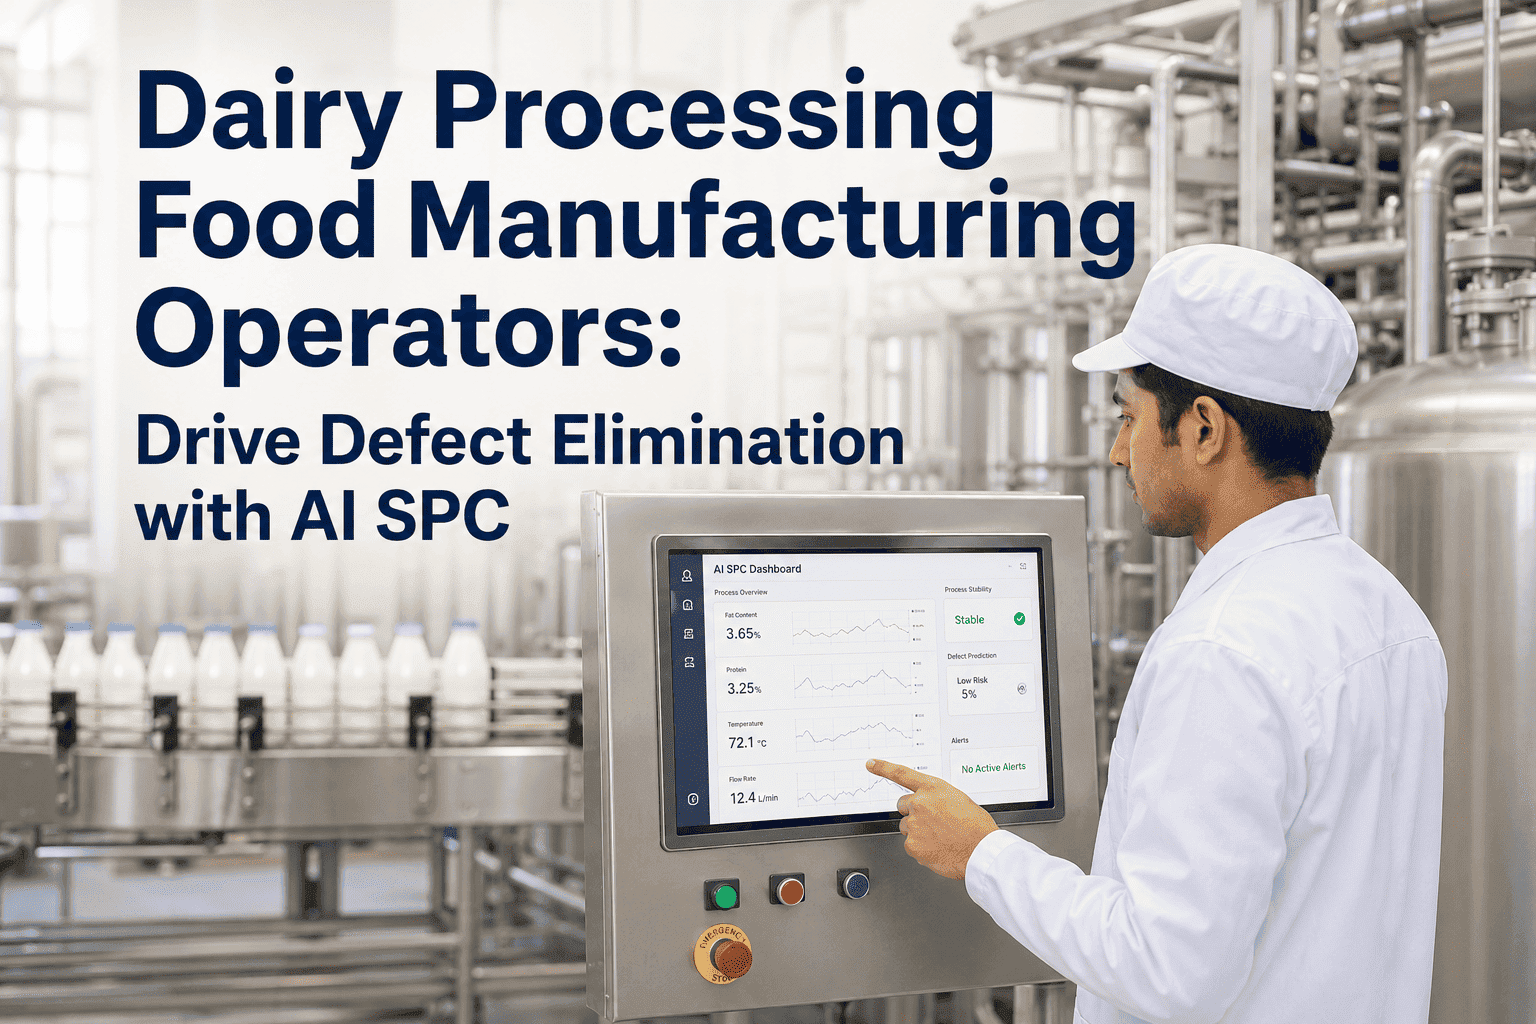
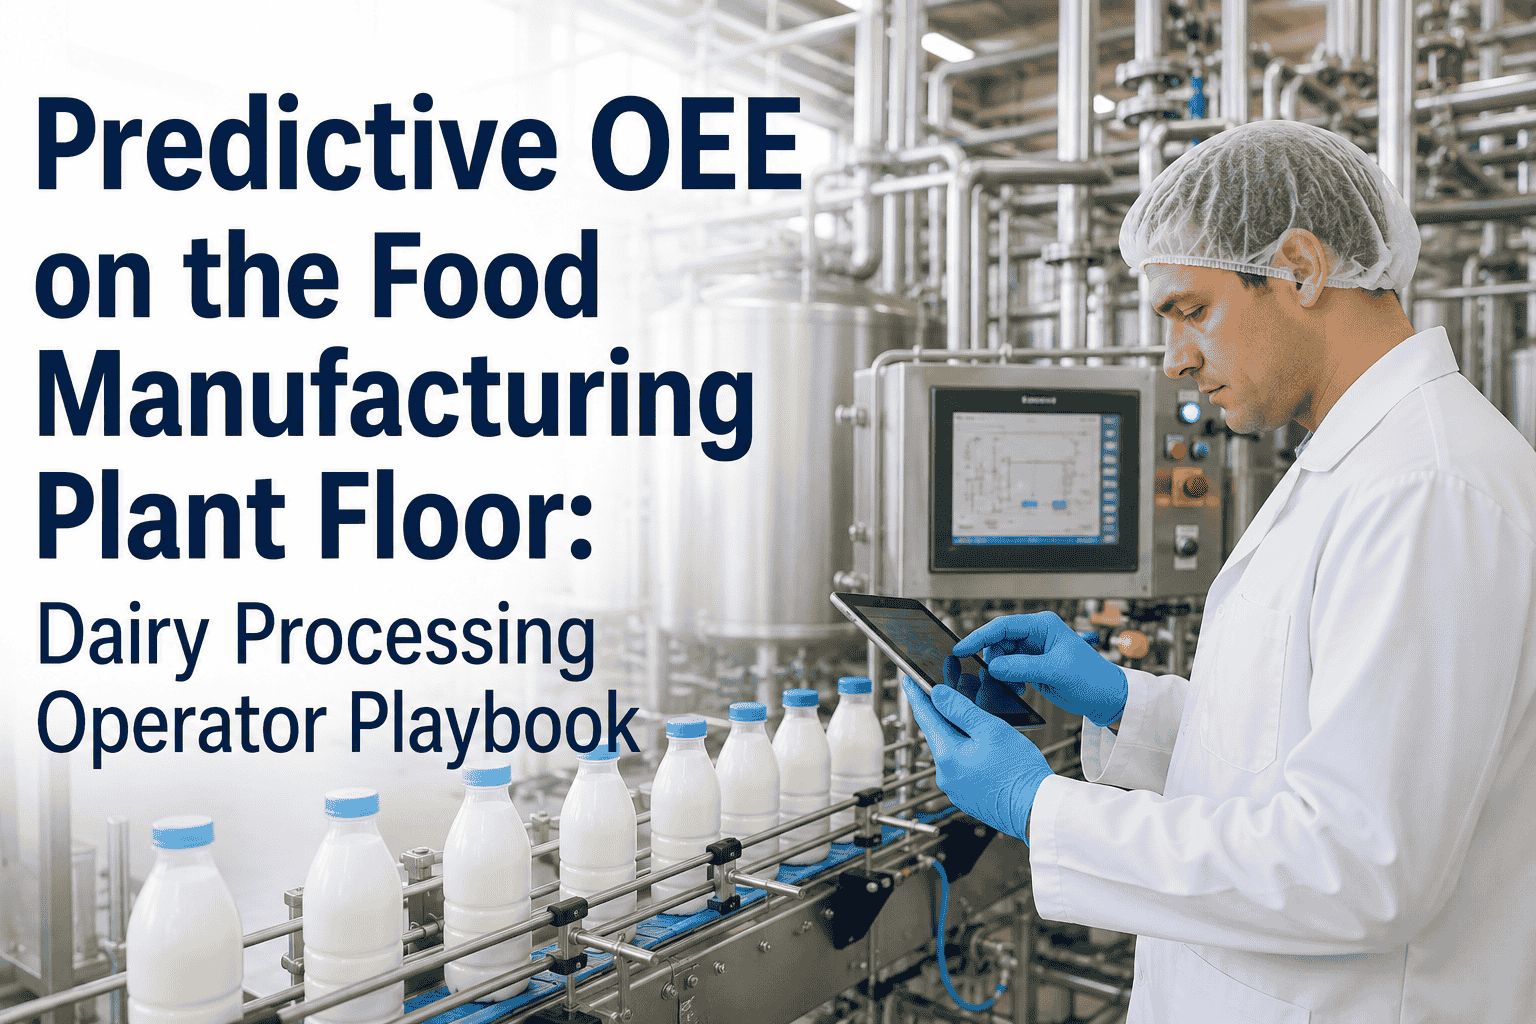
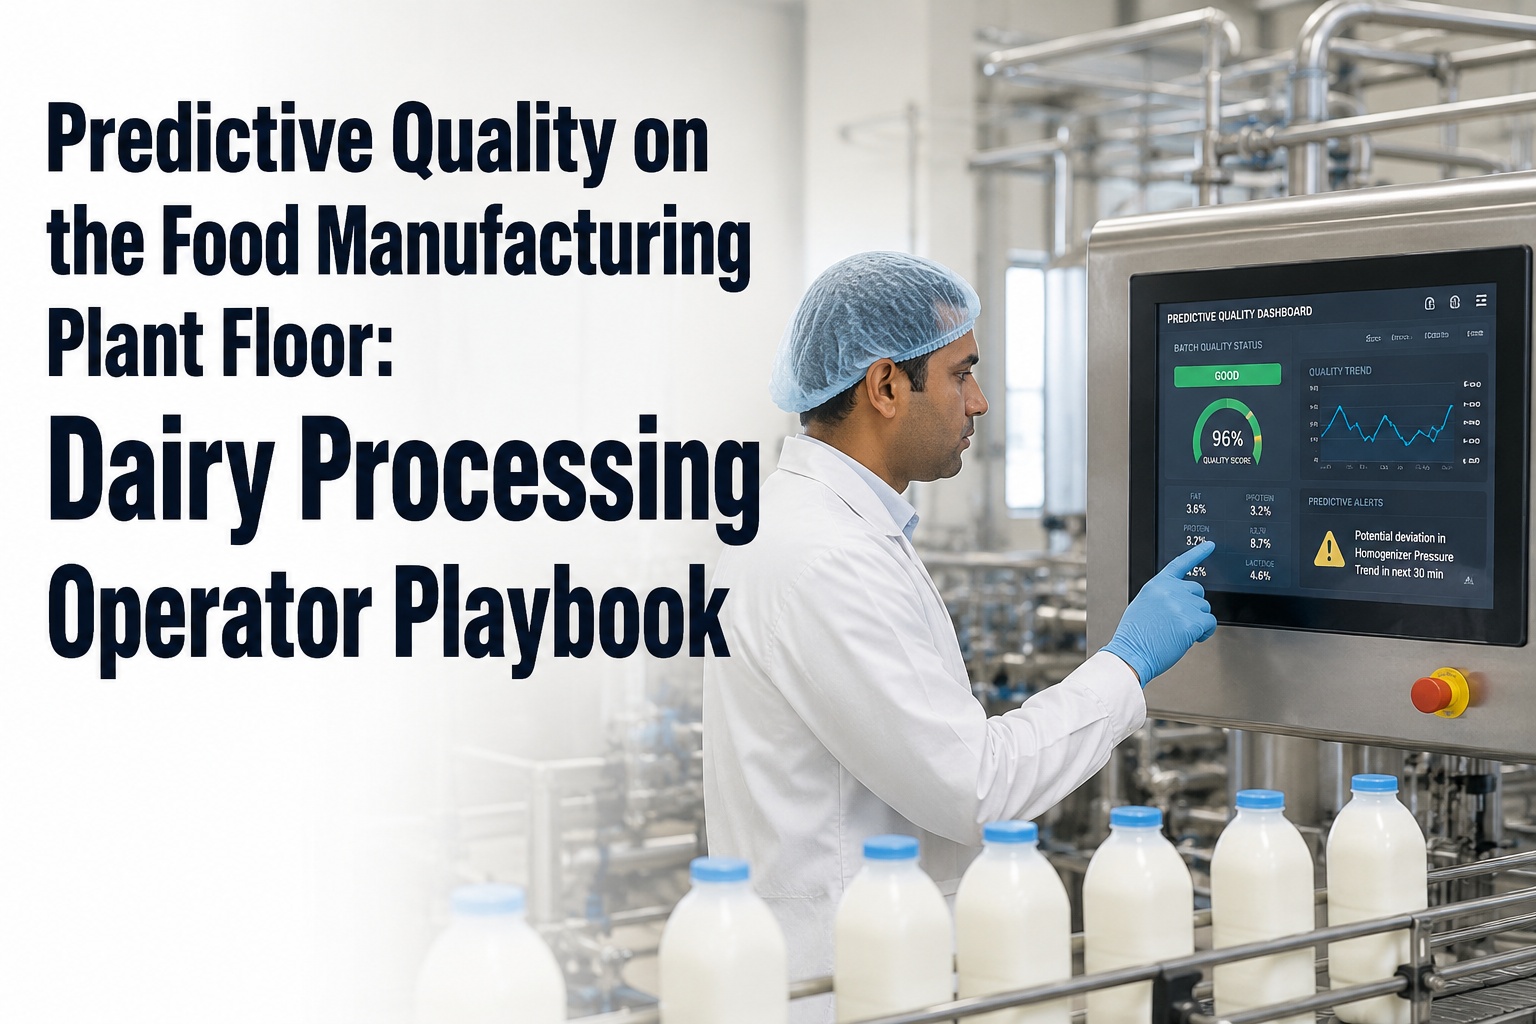
Predictive Quality on the Food Manufacturing Plant Floor: Dairy Processing Operator Playbook
How dairy line operators use predictive quality analytics to tighten batch-to-batch variation — quality outcome forecasting from in-process data, in-flight batch adjustments, Cpk consistency improvement, and audit-finding prevention before they happen.
The Batch-to-Batch Consistency Problem in Dairy
Single-parameter SPC charts catch one kind of problem — a parameter going out of its individual control limits. They don't catch the kind of variation that drives 70% of dairy quality complaints. That variation is multivariate. The pH endpoint drifted by 0.08, the cooling rate was 6 minutes faster than the previous batch, the agitator ran 3% lower RPM, and the starter culture activity was at the upper end of normal. Each parameter individually was perfectly in spec. The combination produced a batch that's measurably different from the one before it — and the customer noticed before the operator did.
Predictive quality analytics solves this by changing what's being predicted. Instead of forecasting whether a single parameter will breach a limit, the AI forecasts the final batch quality outcome — the firmness, moisture, texture score, viscosity, or composition that the QA lab will measure when the batch is complete. That forecast appears continuously, updated as new in-process data arrives, with the recommended adjustment to keep the predicted outcome on target.
Curious what your batch-to-batch distribution looks like for your top quality characteristics? Request a Cpk audit from iFactory support — we'll analyze 90 days of your batch records and return a Cpk-by-characteristic baseline with projected improvement after predictive quality coverage, typically within 5 business days.
How Predictive Quality Analytics Forecasts the Batch Outcome
The mechanism is conceptually simple. AI models trained on your historical batch records learn the multivariate relationship between in-process variables and final QA results. The model has seen thousands of batches and knows what combination of process trajectories produces a 3.2% moisture cheese versus a 3.6% moisture cheese, or a yogurt that gels firmly versus one that ends slightly looser. When a new batch starts, the model watches the in-process variables and continuously updates its forecast of the final quality outcome. The operator sees the prediction long before the QA lab tests the finished product.
Six Dairy Quality Outcomes Predictive Analytics Forecasts
These are the six highest-value dairy quality outcomes where predictive forecasting moves the needle on consistency, customer satisfaction, and audit readiness. Each maps to a specific dairy product family with measurable batch-to-batch variation challenges.
Yogurt Firmness & Texture
LSTM model forecasts gel strength from pH trajectory, temperature curve, starter culture activity, and milk solids — operator sees predicted firmness 1–2 hours before fermentation endpoint.
Cheese Moisture / Fat / Protein
Multivariate model predicts cheese block composition from upstream milk standardization, coagulant timing, cook temperature, and curd-cutting parameters.
Cottage Cheese Curd Quality
AI forecasts curd characteristics from acidification rate, cutting time, and cook temperature ramp. Catches batches drifting toward soft or grainy texture early.
Cream Viscosity & Stability
Predicts cream final viscosity and shelf stability from homogenizer pressure profile, pasteurization timing, and cooling rate. Catches drift before downstream complaints.
Milk Powder Solubility
Forecasts powder quality from concentrate composition, evaporator conditions, and spray-dryer parameters. Catches batches trending toward low solubility before drying completes.
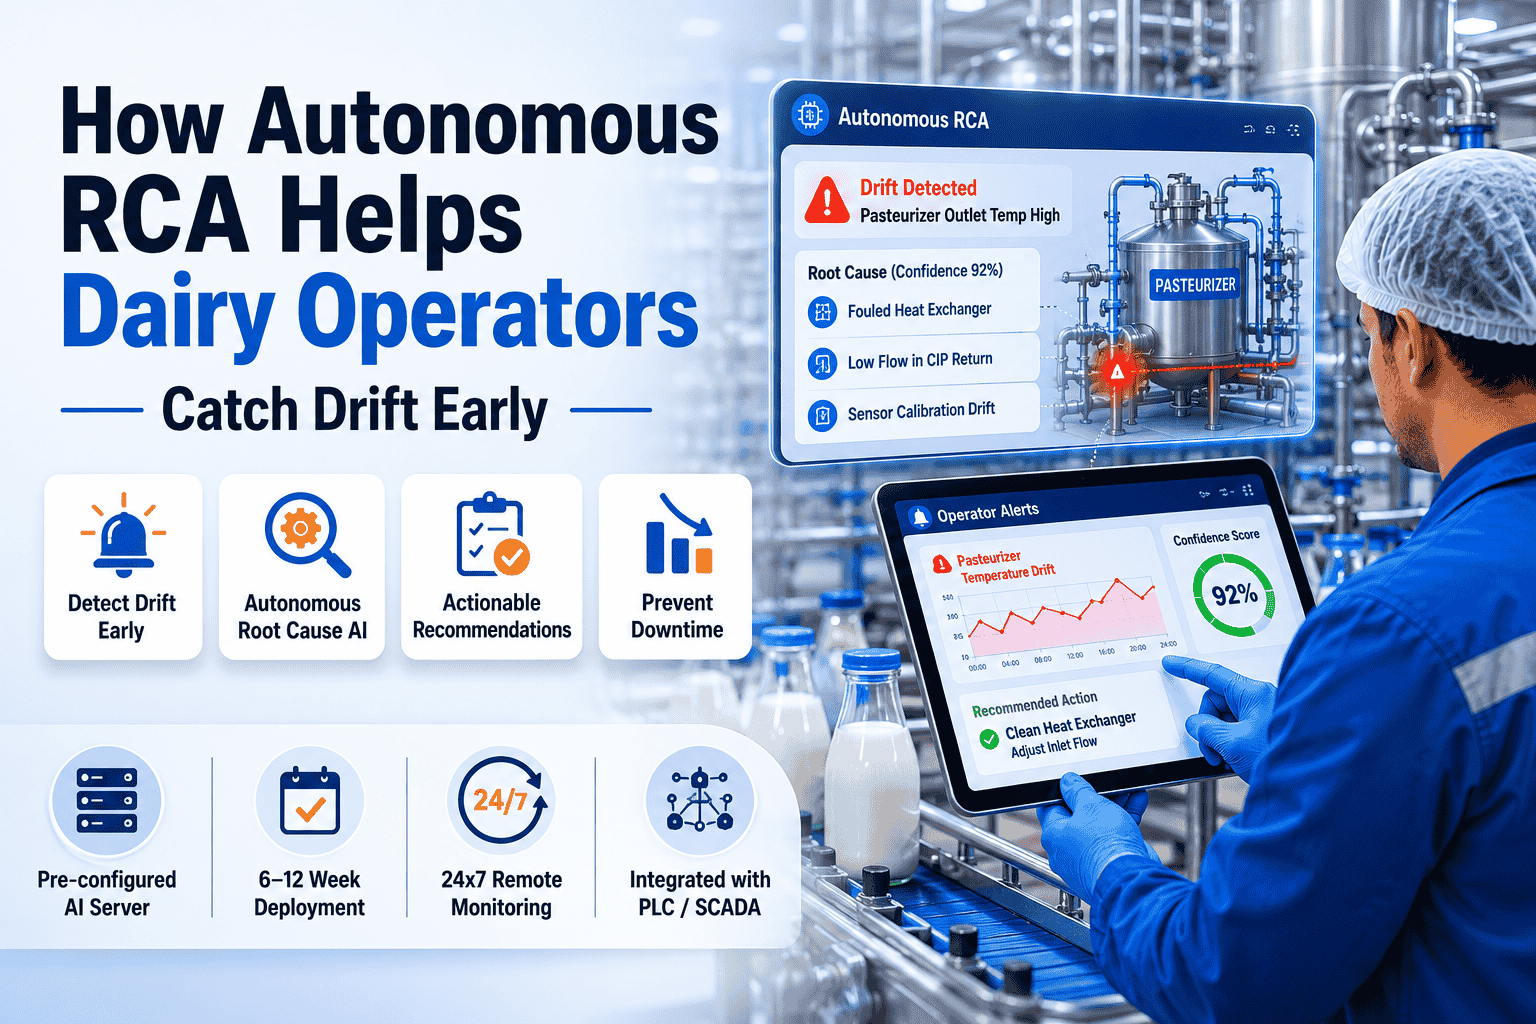
Pasteurizer Drift Detection
Catches gradual pasteurizer drift patterns that would produce audit findings — not catastrophic enough to trip the diverter, but trending toward inspection concerns over multiple shifts.
Want to see which of these six outcomes would deliver the biggest Cpk improvement on your specific dairy line? Book a Demo with Us — bring your top quality characteristics and historical batch data, and the iFactory dairy team will show projected forecast accuracy and Cpk improvement per outcome category. Sessions available this week.
How the Operator's Decisions Change with Predictive Quality
The biggest operator-level change is when decisions get made. Today, most batch-quality decisions happen reactively — after the QA lab measures the finished batch. With predictive quality, decisions happen during the batch, while there's still time to adjust.
Reactive batch decisions
- Operator runs batch following standard recipe
- Batch completes after standard fermentation / cook time
- QA lab samples and tests the finished product
- Results come back 2–6 hours after batch is finished
- If out of spec — quarantine, investigate, rework or scrap
- Root cause analysis after the fact, hoping to prevent next batch
In-flight batch adjustments
- Operator runs batch following standard recipe
- AI continuously forecasts predicted final quality outcome
- Mid-batch, AI flags trajectory: "predicted firmness 32 g — below target"
- AI recommends adjustment: "extend cooling by 8 min · adjust cooling-water inlet temp"
- Operator adjusts, AI re-forecasts, prediction lands back on target
- Batch finishes within spec; QA lab confirms; no quarantine needed
Want to see what an in-flight batch adjustment actually looks like on a dairy line? Book Demo with Us — iFactory's dairy team will walk through a representative batch with the predictive forecast updating in real time, showing exactly where the operator decision point appears. Sessions available this week.
Audit Findings Prevention — The Quiet Compliance Benefit
What predictive quality catches before it becomes an inspection observation
- Gradual pasteurizer drift (not diversion-triggering, but trending)
- Trend patterns that would draw inspection attention
- Cpk degradation on regulated characteristics
- CCP records showing parameter creep over multiple shifts
- Composition trends approaching but not crossing spec limits
- Process variation that suggests inadequate process control
- Documentation gaps that auditors typically flag
- Trending data that supports continuous improvement evidence
Audit findings in dairy don't usually come from catastrophic failures — those generate immediate corrective action records. They come from quiet patterns auditors notice in the data that suggests inadequate process control. Predictive quality analytics catches those patterns before they become a finding, gives operators the information to adjust, and builds the evidence trail showing continuous monitoring and proactive intervention.
Two Real Dairy Plant Consistency Outcomes
National yogurt brand with chronic firmness inconsistency driving retailer flags
A national yogurt processor with eight fermentation tanks running parallel batches. Firmness varied batch-to-batch by ±15–20 g — within the broad spec but enough to drive consistency complaints from major retailers. QA lab caught the variation after batches were complete; root cause was the combined effect of small drifts in pH endpoint timing, cooling rate, and starter culture activity.
Fresh cheese producer with chronic curd texture variability across vats
A mid-size cottage cheese plant running six 18,000-litre vats. Curd texture varied between vats and across shifts — sometimes soft and creamy, sometimes firm and dry. The chemistry sheet showed all batches in spec; the customer-facing texture told a different story. Operators couldn't pin down a single root cause because no single parameter was drifting.
Neither scenario matches your specific dairy operation? Send your top consistency challenges to iFactory support and the dairy team will return a customised projection — predictive coverage map, Cpk improvement estimate per characteristic, and 12-month deployment roadmap — typically within 3 business days, no obligation.
iFactory's Dairy Deployment — On-Premise or Cloud
Same predictive quality stack on either deployment model. Same multivariate forecasting, same operator dashboards, same audit-ready evidence. The choice depends on your IT strategy, data residency rules, and multi-plant approach.
iFactory On-Premise Appliance Default for single-plant dairy operations
- Pre-configured NVIDIA AI server — racked, software-loaded, ready to plug in.
- 24×7 monitoring — continuous AI coverage across all batches.
- Integrated with PLC and SCADA — uses the data your equipment already produces.
- Works during WAN outages — predictive coverage continues uninterrupted.
iFactory Cloud For multi-plant dairy operations and central QA teams
- Fully managed — no rack, no facility requirements.
- Same predictive quality stack — multivariate LSTM, Cpk analytics.
- Cross-plant consistency benchmarking across all dairy plants in one tenant.
- Fastest deployment — first plant live in 2–4 weeks.
"This batch is different" doesn't have to appear on the handover anymore.
Predictive quality analytics gives every operator a real-time forecast of the final batch outcome — firmness, moisture, texture, viscosity — long before the QA lab tests it. Adjust in-flight, land on target, document the audit-ready evidence automatically. iFactory's dairy demo shows the forecast running on representative batches with your part numbers and your KPIs. Sessions available this week, on-premise NVIDIA appliance or fully managed cloud.
Frequently Asked Questions
How is this different from predictive maintenance for dairy equipment?
Predictive maintenance forecasts when equipment will fail — homogenizer seals, separator bearings, plate heat exchanger fouling. Predictive quality analytics forecasts what the final batch outcome will be — yogurt firmness, cheese moisture, cream viscosity. Different prediction targets, different data inputs, complementary value streams. Most dairy plants benefit from both running together; iFactory delivers them on the same platform.
How accurate is the in-flight quality forecast?
For mature deployments (60+ days of training data on your specific products), forecast accuracy typically runs 85–94% within product spec. Accuracy improves over time as the model learns from new batches. Forecasts arrive with confidence scores so operators can weight their response — high-confidence predictions warrant immediate adjustment, lower-confidence flags route to QA for sample-based verification.
Do I need to change our QA lab procedures?
No. The QA lab continues testing per your established sampling plan. The predictive forecast doesn't replace the lab measurement — it complements it. The lab confirms the AI prediction and provides the regulatory-required test record. Most plants see lab samples remain unchanged in volume but find that fewer come back with surprise results.
Will operators trust the in-flight predictions?
Trust builds with consistent verification. The first 30–60 days of deployment, operators verify predictions against actual lab results — and the system shows the comparison continuously. As they see predicted firmness match actual firmness, predicted moisture match actual moisture, batch after batch, operators move from "let me verify" to "let me act on the recommendation." Confidence scoring helps — high-confidence predictions earn quick trust.
Do I have to buy NVIDIA servers separately?
No. iFactory's on-premise appliance ships fully loaded — pre-configured NVIDIA AI server, software pre-installed, network gear, cabling, edge devices. You provide rack space, line power, Ethernet, and PLC/SCADA integration points. The deployment team handles installation and configuration during the 6–12 week deployment. For cloud, no hardware investment at all.
How does this help with FDA / GFSI audit findings?
Two ways. First, the continuous Cpk tracking and process trend visibility makes it easier for auditors to see consistent control — exactly what they're looking for. Second, predictive flags catch the gradual drifts that would otherwise show up as audit findings — pasteurizer trends, composition creep, Cpk degradation — and document the proactive operator adjustments that prevented them. Audit findings drop because the conditions that produce them get caught earlier.
Can we start with just yogurt or just cheese before expanding?
Yes — that's the recommended approach. Start with the product family where consistency variation is most painful — usually the one driving customer complaints or retailer scorecards. Validate the AI accuracy, prove the Cpk improvement, build operator confidence. Then expand to additional product families in 2–4 week waves. Full coverage across all dairy product families typically completes in 3–4 months.
From reactive lab results to in-flight quality decisions.
Predictive quality analytics changes when batch decisions happen — from after the QA lab measures the finished product to during the batch when the operator can still adjust. Cpk improves, batch-to-batch variation tightens, customer complaints drop, audit-finding patterns disappear. iFactory's dairy demo shows it running on representative batches — on-premise NVIDIA appliance or fully managed cloud.