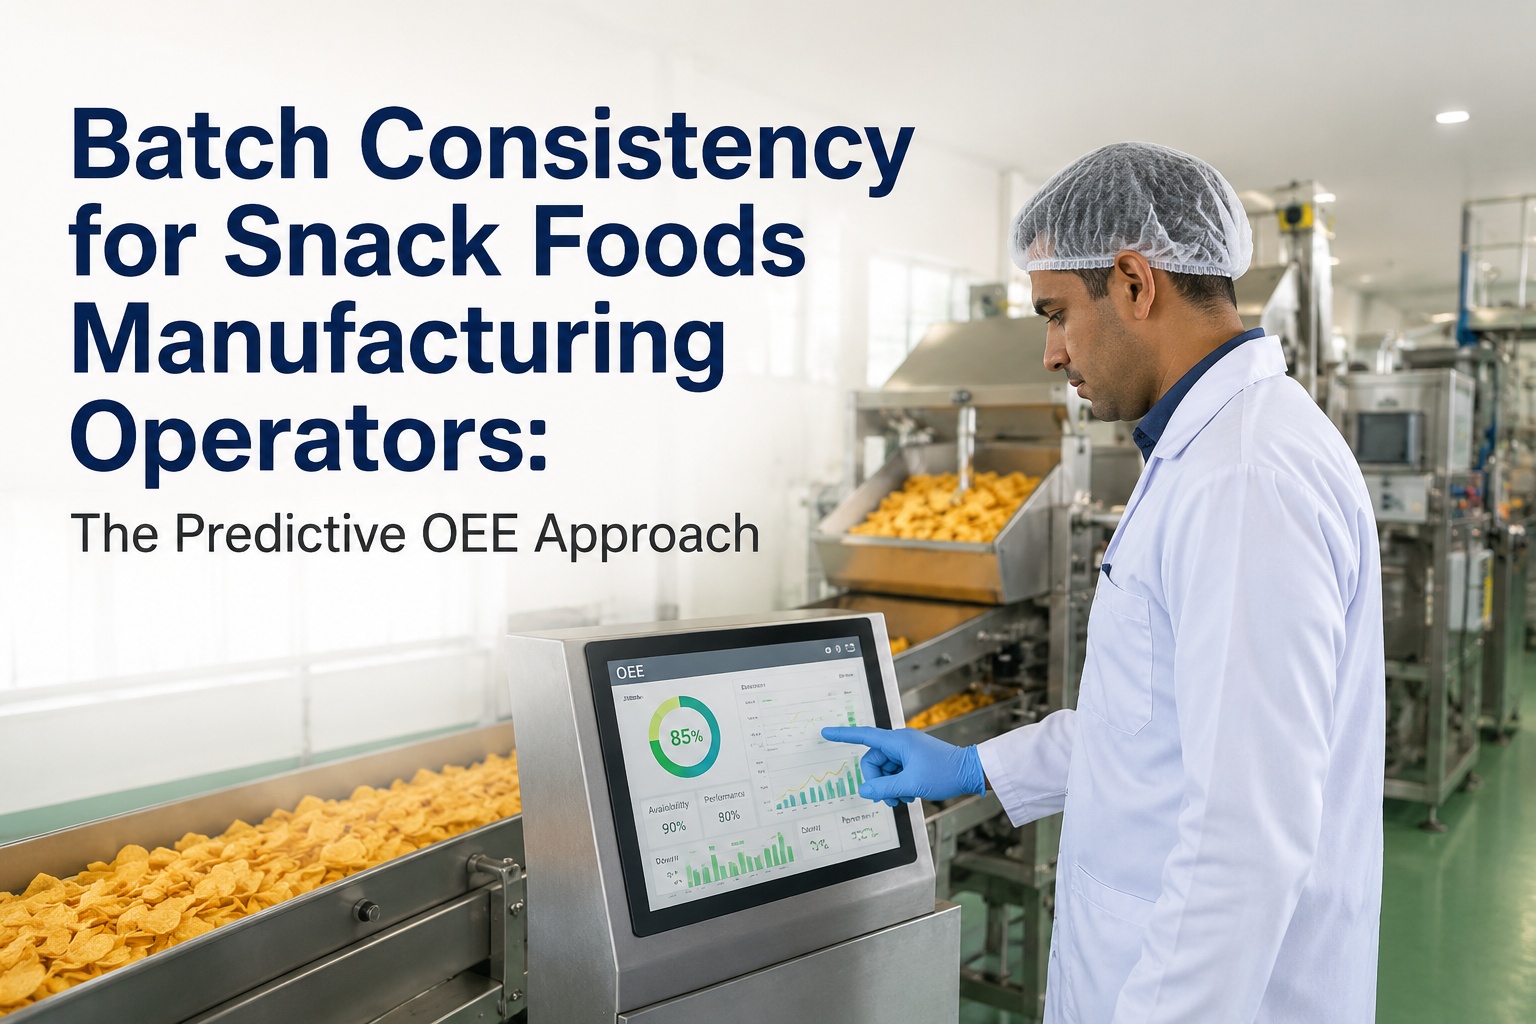
Every food and beverage manufacturer running SAP MII, SAP xMII, or any legacy SPC platform for batch quality control faces the same Cpk frustration. The chemistry sheet says every batch is in spec; the customer scorecard says the batches aren't consistent. Cpk on critical quality attributes — Brix, pH, viscosity, color, fill weight, density, alcohol content, moisture — sits at 1.0 to 1.2 when the customer specification or internal target wants 1.33 or higher. Traditional SPC charts can't move the number because they catch problems after the parameter crosses a limit; cloud SPC platforms struggle with sub-second latency for in-process intervention and create real data-sovereignty issues for plants with proprietary recipes. AI-native predictive SPC solves the Cpk problem differently. Adaptive control limits that tune to product and shift, multivariate models that catch drift across correlated parameters, in-flight quality forecasting that lets operators adjust during the batch instead of after — all running locally on an on-prem NVIDIA appliance so recipe IP stays inside the plant and inference latency stays under 50 milliseconds. This is the side-by-side: Traditional SPC, Cloud SPC, and AI-Native Predictive SPC compared across the four dimensions that determine which platform actually moves Cpk on a food and beverage batch line — latency, data sovereignty, Cpk improvement potential, and 3-year TCO.
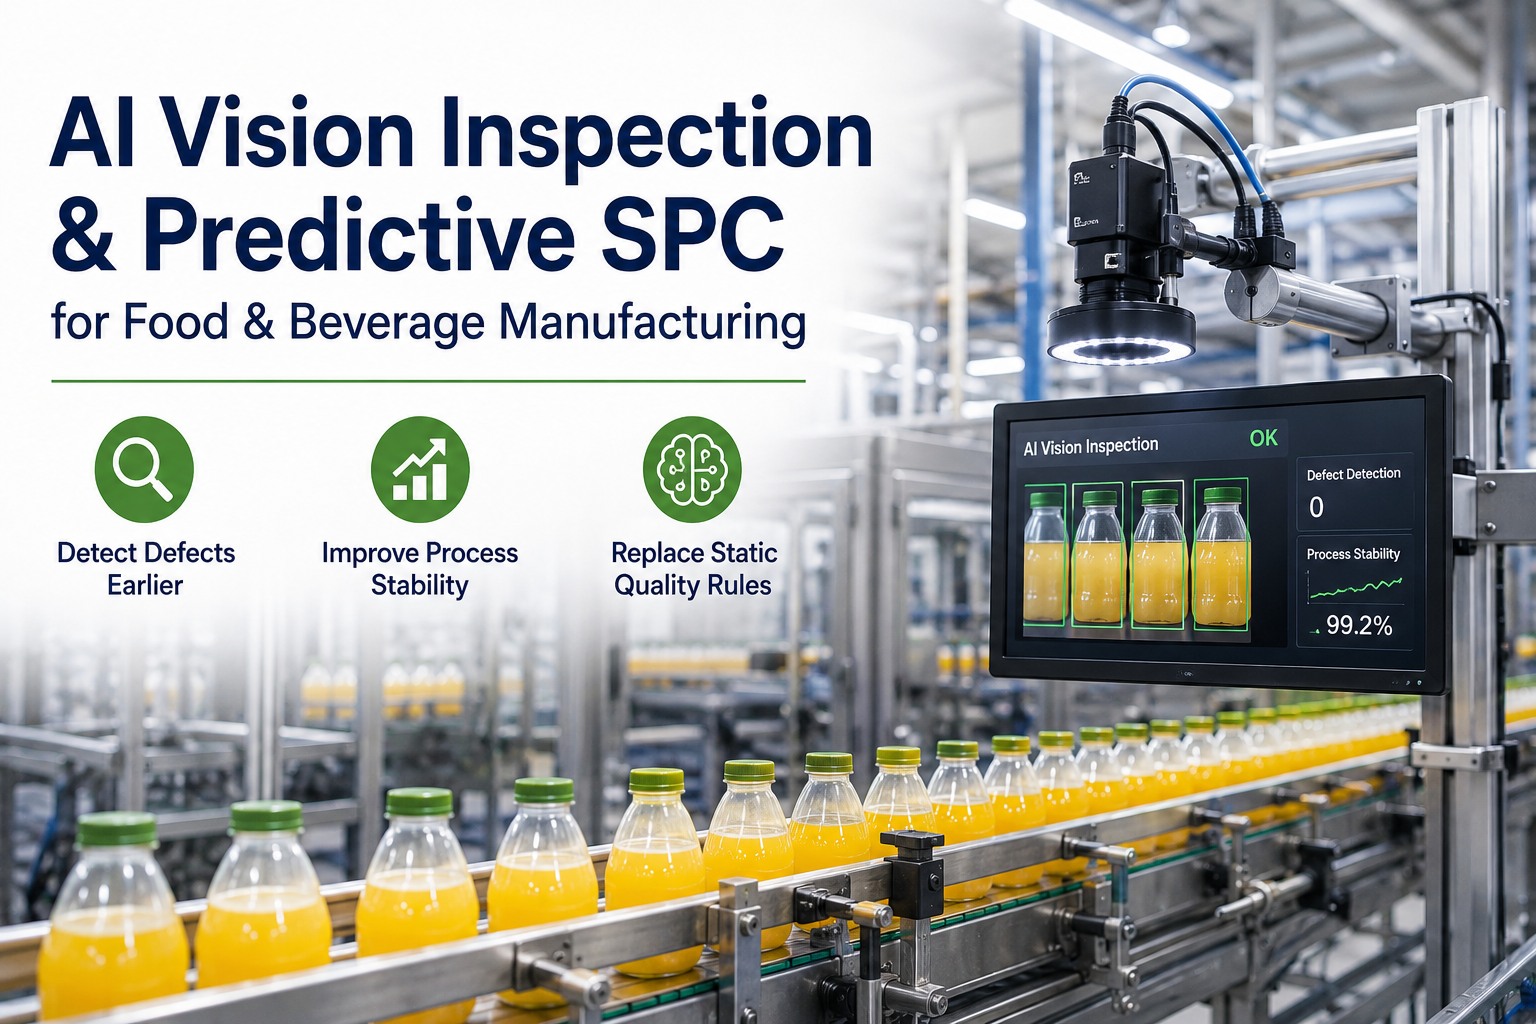
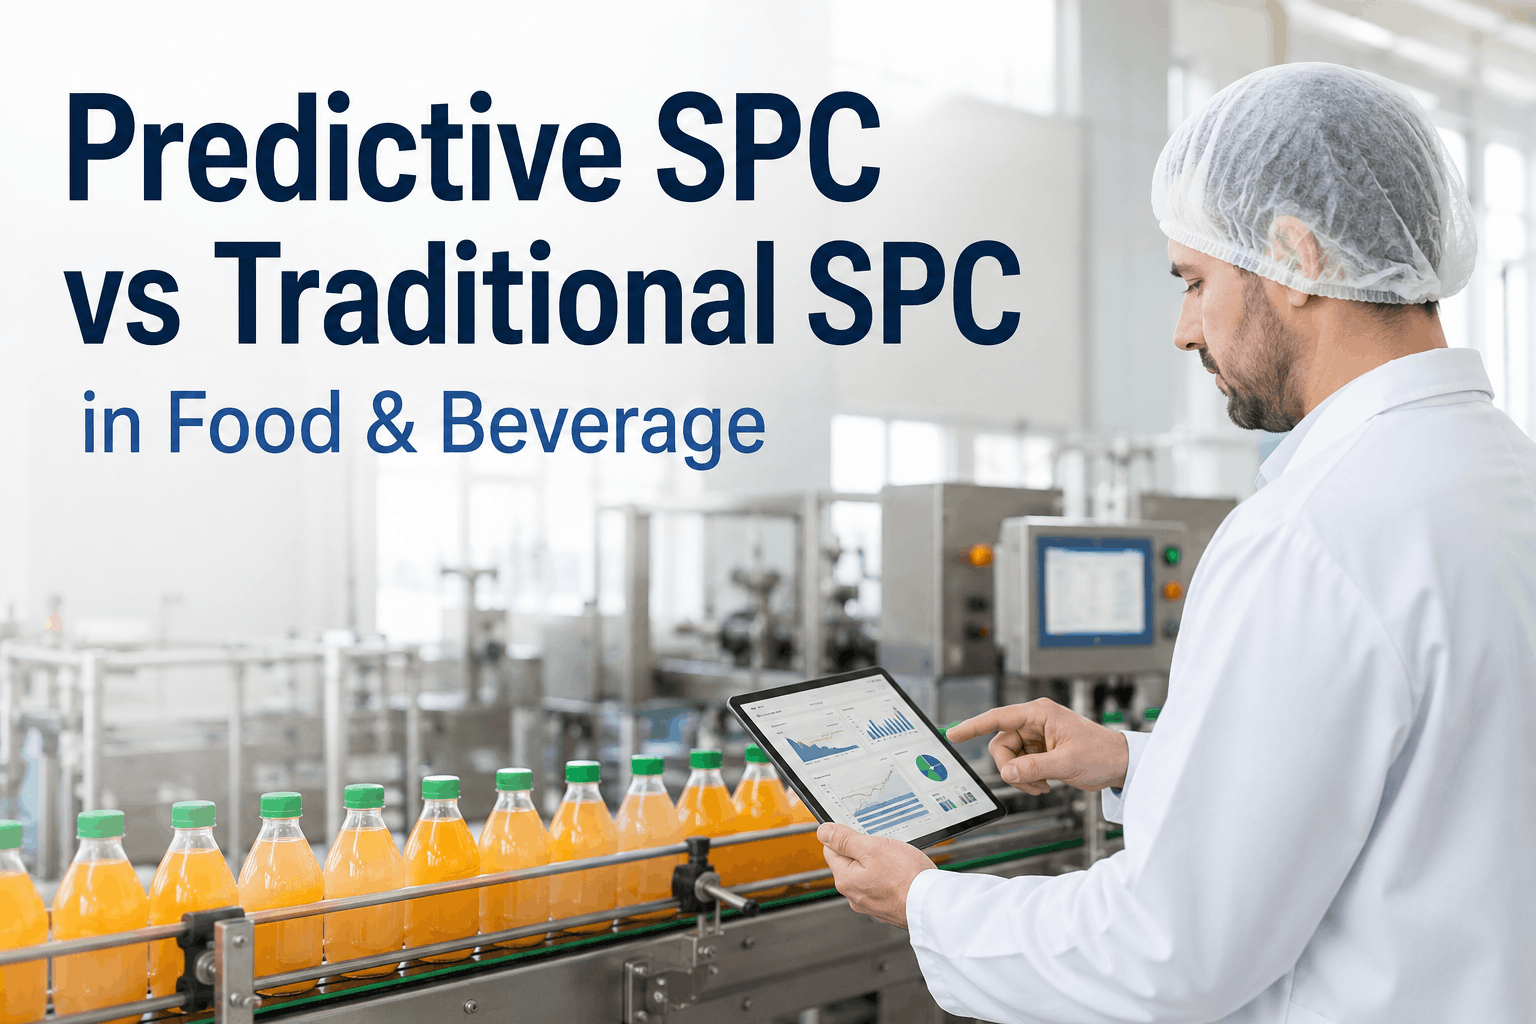
Predictive SPC vs Traditional SPC in Food & Beverage
Traditional SPC, Cloud SPC, AI-Native Predictive SPC compared side-by-side for F&B batch quality control — latency, data sovereignty, Cpk improvement, and total cost of ownership. The migration choice that determines whether you can hit Cpk 1.33+ on critical batch quality attributes.
Three Platforms Side-by-Side
F&B batch quality control platforms divide into three categories today. Traditional on-prem SPC platforms like SAP MII and SAP xMII; cloud-only SPC platforms like SAP DMC and various vendor SaaS products; and AI-native predictive SPC like iFactory AI. They differ across the dimensions that determine actual Cpk outcomes.
SAP MII / xMII style
SAP DMC / SaaS vendors
iFactory AI
The Four Dimensions That Actually Determine Cpk Improvement
Most platform comparisons get lost in feature checklists. For F&B batch quality control specifically, the dimensions that actually determine whether a platform can move Cpk reduce to four. Each is independent; each can disqualify a platform for an F&B use case.
1. Latency
For F&B batch quality control, the AI inference loop must complete inside the process control cycle. Cloud-only platforms add 500–2000ms WAN round-trip on every signal; AI-native edge inference completes in under 50ms. The difference determines whether the operator can act on a drift signal during the batch or only diagnose it afterward.
2. Data Sovereignty
Proprietary F&B recipes, customer-specific formulations, and process know-how are critical IP that cloud-only platforms move outside the plant boundary. Even with strong tenant isolation, regulatory bodies and customer audit teams increasingly question off-prem residency of formulation data. On-prem AI keeps the recipe and process data inside your network.
3. Cpk Improvement Potential
Static control limits and univariate SPC charts cannot meaningfully move Cpk because they don't catch the multivariate drift patterns that produce most F&B batch variation. AI-native predictive SPC moves Cpk by 0.4–0.7 on critical attributes because adaptive control limits and multivariate models address the actual root cause of variation.
4. Total Cost of Ownership
Traditional SPC carries ongoing maintenance license, on-prem infrastructure, and accumulating customization costs. Cloud SPC adds vendor lock-in and per-tag subscription scaling. AI-native predictive SPC includes the appliance, software, deployment, and 3 years of model retraining in a single turnkey package.
Want a sized comparison across the four dimensions for your specific F&B operation? Book the AI SPC Migration Workshop — iFactory's team will model your latency, data sovereignty, Cpk lift, and TCO across all three platform categories using your plant size, current SPC footprint, and product portfolio. Sessions available this week.
The Cpk Distribution — What Moves When the Platform Changes
The strongest single argument for AI-native predictive SPC is what happens to the batch quality distribution. Static control limits keep the average in spec but don't tighten the distribution; adaptive control limits and multivariate modeling tighten the distribution around the target, lifting Cpk and dropping out-of-spec tails.
Latency Where It Matters — The 50ms vs 1500ms Gap
Latency is the single most overlooked dimension in cloud SPC discussions. The vendor's marketing says "real-time"; the actual round-trip from plant signal to actionable alert tells a different story. In batch quality control, the difference between in-flight intervention and after-the-fact diagnosis is the difference between a saved batch and a lost batch.
Want to see the latency comparison applied to your specific batch quality control loop? Book the AI SPC Migration Workshop — iFactory's team will measure your current SPC alert latency against the AI-native edge inference path and project the in-flight intervention window you'd gain. Sessions available this week.
Six F&B Batch Quality Applications Where AI-Native SPC Moves Cpk
Beverage Brix & pH
Predicts final batch Brix and pH from upstream blending parameters, ingredient batch IDs, and temperature curves — 30–60 min before batch endpoint.
Sauce & Dressing Viscosity
Forecasts final viscosity from blender parameters, ingredient ratios, cooking time, and cooling curves — operator adjusts in-flight to land on target.
Filler Weight Consistency
Multivariate predicts fill-weight drift from filler valve cycle count, product temperature, viscosity, and head-pressure variation across the line.
Color & Clarity Consistency
AI Vision color measurement + multivariate model predicts final batch color from caramelization parameters, pH trajectory, and ingredient lot effects.
Bakery Moisture Content
Predicts final bakery product moisture from oven zone temperature profiles, dough ingredient lot, baking time, and humidity. Catches drift to extend.
Brewing & Fermentation
Predicts final beer or wine endpoint from fermentation curve trajectory, yeast strain activity, temperature profile, and gravity drop rate — batch-to-batch.
Want an application-specific Cpk projection for your top F&B batch quality attributes? Send your top 3 CQAs and current Cpk baseline to iFactory support and the F&B team will return a projected Cpk improvement map with 12-month deployment roadmap — typically within 3 business days, no obligation.
Two Real F&B Batch Quality Migration Outcomes
Premium beverage manufacturer with chronic Brix variation across batch operations
A premium juice and RTD beverage producer running four batch blending tanks. Brix Cpk averaged 0.92 across the portfolio — customer scorecard wanted 1.33+. Traditional SPC charts flagged out-of-spec batches but couldn't prevent them. Cloud SPC evaluated for $2.1M over 18 months; on-prem AI-native option evaluated alongside.
Sauces and dressings manufacturer with combined viscosity and fill-weight Cpk issues
A national sauces and dressings producer running 6 batch blending tanks feeding 4 filling lines. Viscosity Cpk averaged 1.05; fill-weight Cpk averaged 1.18 with frequent giveaway. SAP MII handled SPC but couldn't move either Cpk number. Annual giveaway cost on fill-weight alone exceeded $1.4M.
Neither scenario matches your situation? Send your top batch quality Cpk numbers and current SPC platform to iFactory support and the F&B team will return a customised migration analysis with three-platform comparison, projected Cpk lift per CQA, and 12-month roadmap — typically within 3 business days, no obligation.
iFactory's F&B SPC Deployment — On-Premise or Cloud
Same AI-native predictive SPC platform on either deployment model. Same adaptive control limits, same multivariate forecasting, same operator dashboards. The deployment choice depends on your data sovereignty requirements, latency needs, and multi-plant approach.
iFactory On-Premise Appliance Default for F&B plants with recipe IP or latency-critical batch QC
- Pre-configured NVIDIA AI server — racked, software-loaded, ready to plug in.
- <50ms edge inference — keeps up with high-speed filling and packaging.
- Recipe IP stays inside the plant — protects formulations from cloud exposure.
- Works during WAN outages — batch quality control continues uninterrupted.
iFactory Cloud For multi-plant F&B operations with centralized QA strategy
- Fully managed — no rack, no facility requirements.
- Same predictive SPC stack — adaptive limits, multivariate models, Cpk analytics.
- Cross-plant Cpk benchmarking across all F&B plants in one tenant.
- Fastest deployment — first plant live in 2–4 weeks.
The Cpk number is the scoreboard. The platform determines whether you can move it.
Traditional SPC keeps batches in spec but doesn't tighten the distribution. Cloud SPC adds the same paradigm with worse latency and data sovereignty trade-offs. AI-native predictive SPC moves Cpk by 0.4–0.7 on the critical batch quality attributes that customers actually scorecard. The AI SPC Migration Workshop sizes the migration across all three platforms with concrete cost, latency, sovereignty, and Cpk projections for your operation.
Frequently Asked Questions
Why does latency matter for batch quality control specifically?
For most batch quality decisions, the in-process window between drift detection and the operator's last chance to adjust the batch is measured in seconds to minutes. Cloud SPC platforms with 500–2000ms round-trip latency can still report a problem, but they consume too much of that adjustment window to enable in-flight intervention. On-prem edge inference at <50ms preserves the full adjustment window, which is what actually moves Cpk.
Is data sovereignty a real concern or just marketing?
For F&B specifically, it's increasingly real. Customer audit teams (especially major retailers and QSR chains) now ask about recipe and formulation data residency. Regulatory bodies in some jurisdictions question off-prem residency of proprietary process know-how. On-prem deployment keeps the data inside your network boundary, simplifying customer audit responses and regulatory positioning regardless of the long-term direction those questions move.
How does AI-native SPC actually move Cpk if the parameters were already in spec?
Cpk improves when the batch-to-batch variation tightens around the target. Traditional SPC keeps individual parameters in spec but doesn't address the multivariate combinations that produce variation — pH endpoint slightly low while temperature was slightly high while cooling rate was slightly fast. AI-native predictive SPC catches the multivariate signature, predicts the final outcome, and lets the operator adjust to land on target rather than just within spec.
What's the actual TCO difference across the three platforms?
For a typical mid-size F&B plant (8–12 batch lines), 3-year TCO is roughly — Traditional SPC (continuing SAP MII): $1.8–3.5M including maintenance and custom configuration; Cloud SPC migration (SAP DMC or equivalent): $2.5–5M including re-architecture and per-tag subscription scaling; AI-Native Predictive SPC (iFactory AI): $0.5–2M including the appliance, software, deployment, and 3 years of model retraining. Larger plants and multi-plant operations skew the comparison further toward AI-native.
Do I have to buy NVIDIA servers separately?
No. iFactory's on-premise appliance ships fully loaded — pre-configured NVIDIA AI server, software pre-installed, network gear, cabling, edge devices for line-side inference. You provide rack space, line power, Ethernet, and PLC/SCADA integration points. The deployment team handles all installation and configuration during the 6–12 week deployment. For cloud deployment, there's no hardware investment at all.
Can we migrate one batch line first before going plant-wide?
Yes — and that's the recommended approach. Start with the line where Cpk improvement would have the biggest customer or financial impact. Validate the Cpk lift, prove the operator workflow, build confidence with the multivariate predictions. Then expand line-by-line in 2–4 week waves. Full plant migration for a 6–12 batch line F&B operation typically completes in 3–4 months.
What does the AI SPC Migration Workshop actually cover?
The half-day workshop covers — current-state SPC platform assessment with your team, three-platform comparison sized to your operation across latency / sovereignty / Cpk / TCO, Cpk projection for your specific CQAs, live iFactory platform walkthrough with F&B batch quality use cases, deployment roadmap with milestone validation. Outcome is a concrete migration recommendation. Suitable for operations leaders, QA, IT, and finance representatives.
Cpk improvement isn't a goal. It's a platform decision.
The number you can hit on critical batch quality attributes depends on whether your SPC platform can actually catch multivariate drift in time for the operator to adjust. Traditional SPC and Cloud SPC can't. AI-Native Predictive SPC can. The AI SPC Migration Workshop is the fastest way to see what platform change means specifically for your Cpk numbers — sessions available this week, on-premise NVIDIA appliance or fully managed cloud deployment.