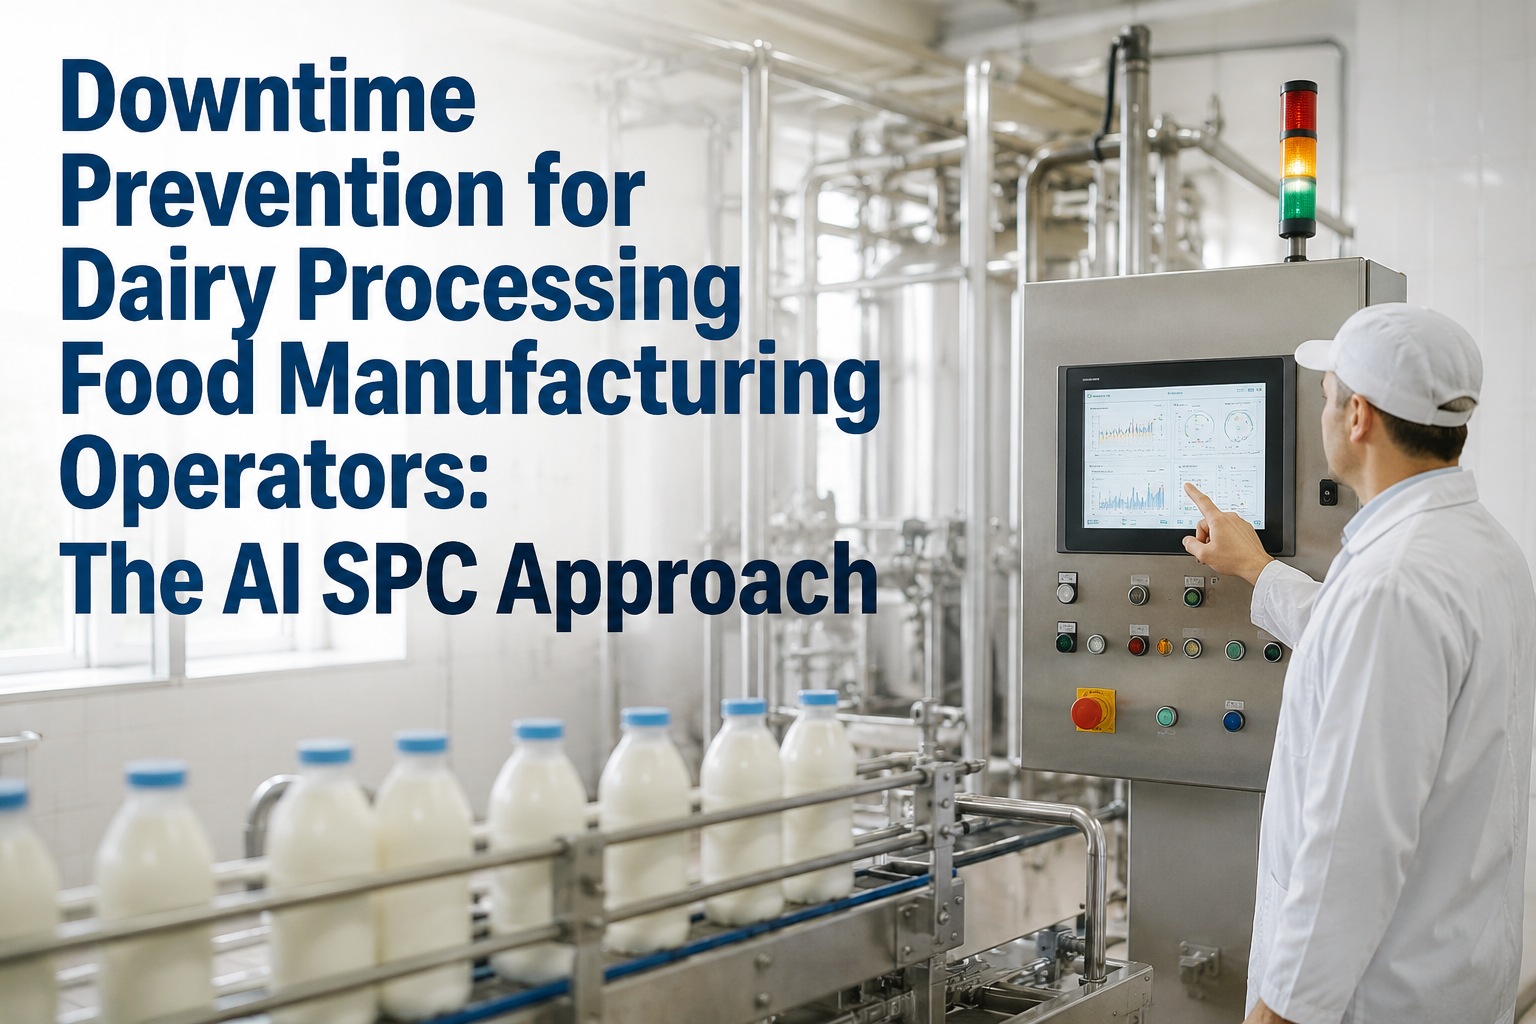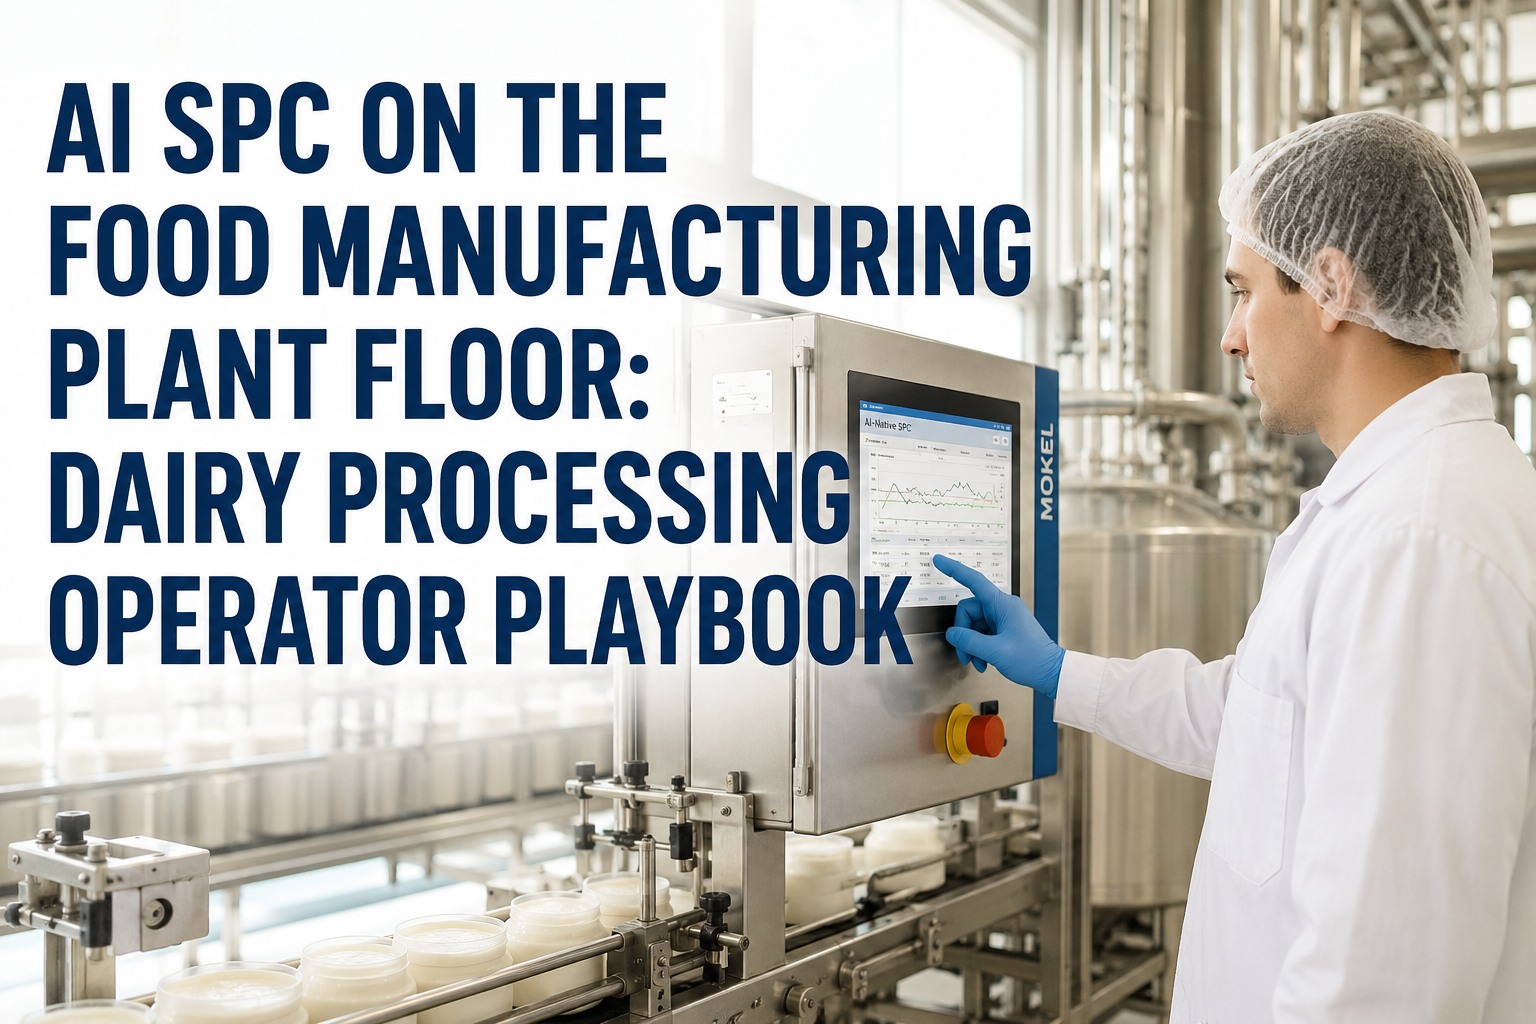
If you run a dairy processing line, you've lived through it — the homogenizer that seemed fine all shift until it suddenly threw a piston seal at 11 pm, the plate heat exchanger that fouled out of spec halfway through a 50,000-litre run, the separator bowl that started vibrating an hour before the bearing failed entirely. Every one of those moments was preceded by weeks of subtle wear signals that nobody was watching — until it was too late. Predictive quality analytics changes the math. Instead of waiting for equipment to fail and reacting, AI models running on the same PLC, SCADA, and vibration data your equipment is already producing can spot the degradation patterns 6–8 weeks before the failure event. Maintenance happens in planned windows. Production runs uninterrupted. Operators stop chasing emergencies and start working on actual improvements. This is the line operator's guide to predictive quality analytics in dairy processing — what equipment it monitors, what failures it catches early, how the shift flows differently, and how it preserves your GFSI, FDA, and HACCP audit position while preventing the unplanned downtime that quietly destroys your OEE. iFactory delivers this on a turnkey on-premise NVIDIA appliance or fully managed cloud — same predictive AI, your deployment choice.
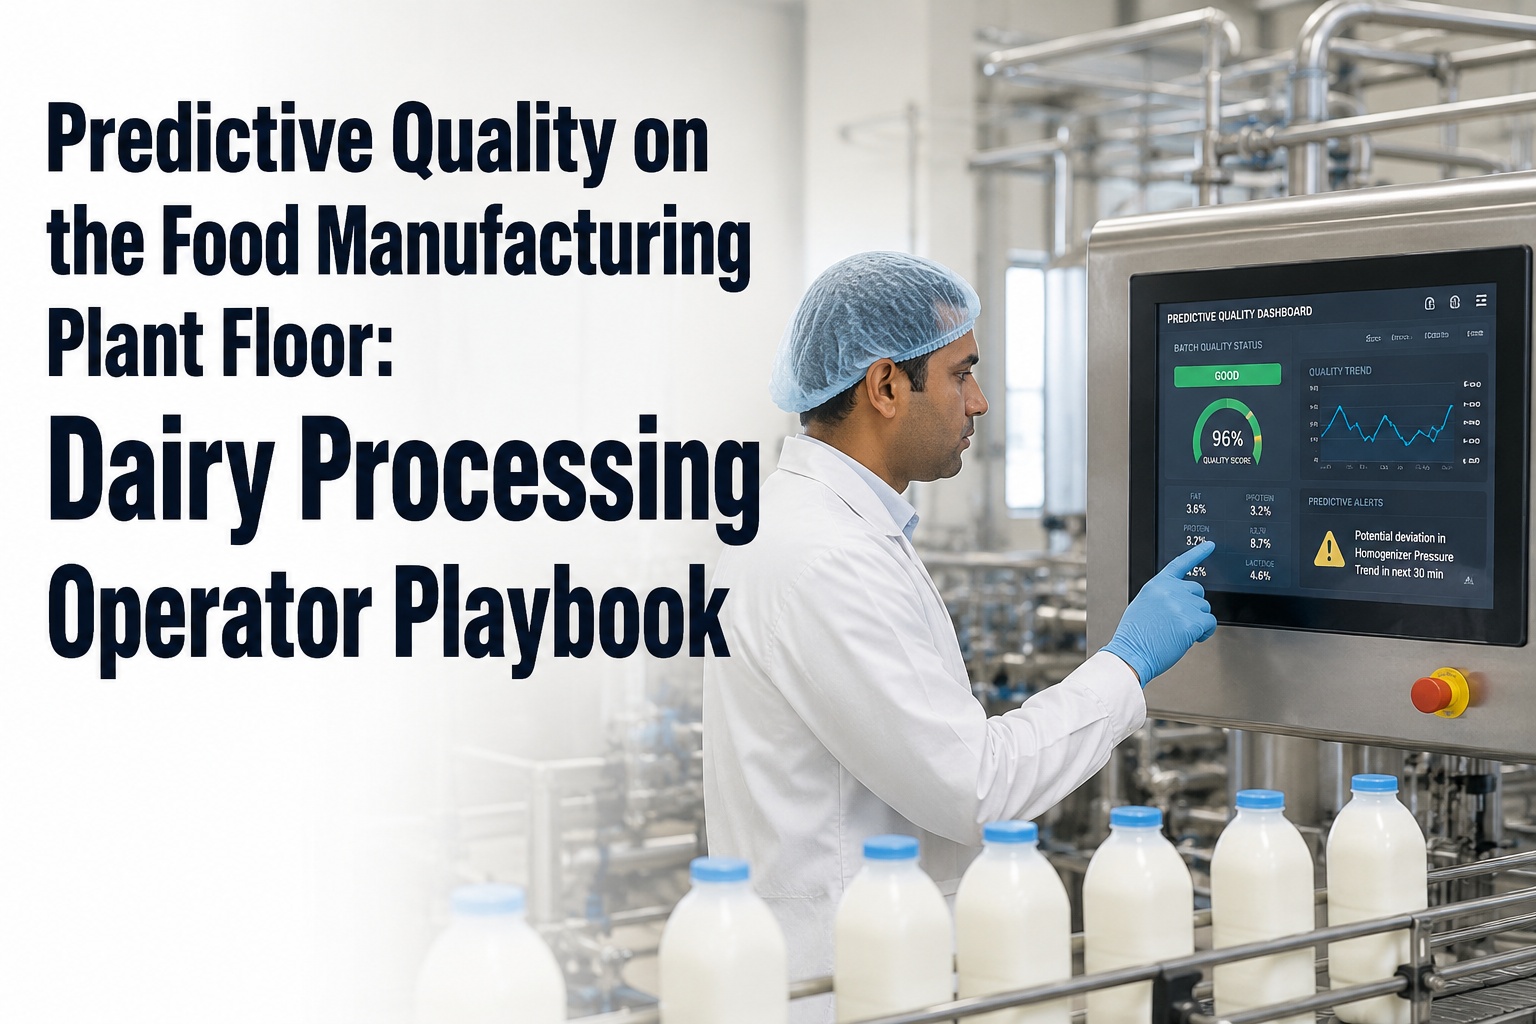
How Operators Use Predictive Quality for Downtime Prevention in Dairy Processing Food Manufacturing
The dairy line operator's guide to AI-driven equipment failure prediction — homogenizers, separators, pasteurizer plates, CIP systems, pumps. Predict the failure 6–8 weeks early, schedule the maintenance into a planned window, keep the line running.
What Predictive Quality Analytics Actually Does on a Dairy Line
Predictive quality analytics is the dairy-line equivalent of "we knew this was going to happen before it happened." Three AI model families run continuously on the data your equipment is already producing — LSTM time-series forecasting that catches gradual parameter drift, autoencoder anomaly detection that flags unusual multivariate patterns, and remaining useful life (RUL) models trained specifically on the failure modes of dairy equipment. Together they produce one number that matters most for the operator — the predicted weeks-to-failure for each critical piece of equipment, updated continuously. When that number drops below the planned-maintenance threshold, the work gets scheduled into a planned window rather than triggering an unplanned stop.
The economics of this picture are immediate. A reactive failure on a homogenizer typically consumes 4–8 hours of production time, plus product loss, plus emergency parts cost, plus the cascade impact on downstream operations. A planned predictive intervention typically consumes 1–2 hours during a scheduled window, with parts pre-staged and no production cascade. Across a year of dairy operation, that math compounds into the −45 to −65% unplanned downtime reduction figure you see in industry case studies.
Curious how many of your recent equipment failures showed predictive signals 6–8 weeks in advance? Request a retrospective failure audit from iFactory support — we'll analyze your last 12 months of equipment events against the predictive patterns AI would have caught, returned within 5 business days.
The Maintenance Maturity Shift — Where Predictive Quality Fits
Maintenance philosophy in dairy plants has evolved across three distinct generations. Most plants today operate in a mix of the first two, with the third only emerging now as edge AI becomes accessible. Understanding where you sit is the first step in figuring out what changes when predictive quality analytics arrives.
Reactive Maintenance
Run equipment until it fails, then repair. Spares stocked for the most common failures. Maintenance crew on standby.
Works for cheap, non-critical equipment. Costs add up fast when applied to homogenizers, separators, or pasteurizers.
Preventive Maintenance
Replace components on a calendar schedule — every X hours of run-time or every Y weeks. Industry-standard PM intervals.
Reduces surprise failures but wastes spare parts and labor on equipment that didn't actually need service yet.
Predictive Quality
AI predicts component degradation from real signal patterns. Maintenance scheduled based on actual equipment health, not calendar.
Catches surprise failures AND avoids unnecessary PM work. Significantly lower total maintenance cost with higher uptime.
Six Dairy Equipment Categories Predictive Quality Covers
Predictive quality analytics maps to specific dairy equipment types where slow degradation patterns are visible in operating data weeks before failure. Here are the six highest-impact categories where AI coverage typically pays back within months.
Homogenizer
AI tracks the multivariate relationship between operating pressure, motor current, vibration signature, and temperature trends. Catches gradual valve seat wear and seal degradation.
Cream Separator
Vibration analysis combined with bowl temperature and motor current detects bearing degradation early. Imbalance signatures catch bowl wear before catastrophic damage.
Plate Heat Exchanger
Heat transfer coefficient trends predict fouling buildup. Pressure-drop pattern changes catch gasket failure precursors. CIP performance trending flags plate degradation.
Process Pumps
Pressure, flow, and current signatures detect seal wear progressively. Vibration spectra catch bearing degradation. Cavitation patterns flag suction-side issues.
CIP System Components
CIP cycle performance trending — conductivity recovery rates, temperature climb, return flow patterns — catches spray ball partial blockages and valve degradation early.
Agitators & Mixers
Motor current draw, vibration, and seal leak detection combine to predict bearing failures and seal degradation in fermentation, blending, and storage tanks.
Want to see which of these six equipment categories would deliver the biggest downtime reduction at your dairy plant? Book a Demo with Us — bring your recent unplanned downtime log and we'll show how each equipment category gets covered, with a projected lead-time map for your specific equipment list. Sessions available this week.
CIP Analytics — Where Predictive Quality Pays Back Fastest
What predictive quality catches in your Clean-In-Place cycles
- Conductivity recovery rate trending (rinse efficiency drift)
- Caustic and acid concentration verification per cycle
- Temperature climb-rate analysis (heat exchanger fouling)
- Return flow patterns indicating spray ball blockage
- Final rinse turbidity and conductivity correlation
- Cycle duration drift catching pump or valve degradation
- Predicted cleanliness assessment per circuit
- Automatic CIP verification log for GFSI / FDA audits
CIP analytics is often the single highest-payback predictive quality application in dairy, because CIP failures cascade — a partially failed CIP cycle either burns a full production run from contamination risk, or triggers a complete re-clean that consumes 2–4 hours. Catching CIP system degradation 4–8 weeks ahead means the maintenance happens in a planned weekend window, and the production CIP cycles run cleanly throughout.
How the Operator's Role Changes
Predictive quality analytics doesn't replace anything the operator does — the line walks, parameter checks, sample collection, paperwork all continue exactly as before. What changes is the conversation with maintenance and the emergency-response load on the operator's shift.
Reactive operator workload
- Equipment fails mid-shift; operator stops the line, calls maintenance, logs the event
- Troubleshooting time consumes 30–90 minutes per event
- Production schedule disruption requires re-planning downstream operations
- Customer commitments at risk for current run
- Operator handover loaded with "watch this equipment" warnings
- End-of-shift paperwork includes deviation documentation
Planned operator workload
- Operator sees AI alerts 6–8 weeks ahead: "homogenizer valve drift — schedule maintenance week 6"
- Maintenance happens during weekend or planned outage
- Production runs uninterrupted across regular shifts
- Customer commitments delivered consistently
- Operator handover focuses on production status, not emergencies
- End-of-shift paperwork auto-assembled from the AI logs
Want to see what your shift would look like with predictive quality running? Book Demo with Us — iFactory's dairy team will walk through a representative shift showing the AI alerts, the maintenance scheduling integration, and the operator dashboard with your equipment list. Sessions available this week.
Two Real Dairy Plant Outcomes
Mid-size cheese plant with three homogenizers and recurring unplanned failures
A regional cheese producer operating three homogenizers across two product lines. Unplanned homogenizer failures averaged 5–7 per year across the fleet — each event consumed 4–6 hours of production plus emergency parts cost. Annual lost production exceeded 80 hours, with cascade impact on downstream operations adding another 40 hours.
National yogurt brand with CIP failures causing mid-shift batch losses
A national yogurt processor with 12 CIP circuits across the plant. Spray ball partial blockages and aging valve seats caused periodic CIP failures mid-cycle — each event required either re-cleaning (2–4 hr lost production) or scrapping the next batch under contamination risk. Annual CIP-related downtime totaled approximately 220 hours.
Neither scenario matches your specific dairy operation? Send your top downtime categories and equipment list to iFactory support and the dairy team will return a customised projection — predictive coverage map, projected downtime reduction, and 12-month deployment roadmap — typically within 3 business days, no obligation.
iFactory's Dairy Deployment — On-Premise or Cloud
Same predictive quality stack on either deployment model. Same LSTM forecasting, same RUL models, same operator dashboards, same audit trail. The choice depends on your IT strategy, data residency rules, and multi-plant approach.
iFactory On-Premise Appliance Default for single-plant dairy operations
- Pre-configured NVIDIA AI server — racked, software-loaded, ready to plug in.
- 24×7 monitoring — continuous AI coverage across all critical equipment.
- Integrated with PLC and SCADA — uses the data your equipment already produces.
- Works during WAN outages — predictive coverage continues uninterrupted.
iFactory Cloud For multi-plant dairy operations and central reliability teams
- Fully managed — no rack, no facility requirements.
- Same predictive quality stack — LSTM, RUL, vibration analytics.
- Cross-plant equipment benchmarking across all dairy plants in one tenant.
- Fastest deployment — first plant live in 2–4 weeks.
Stop discovering equipment failures the hard way.
Predictive quality analytics gives every operator a 6–8 week head start on the equipment failures that used to hit during a shift. Maintenance happens in planned windows. Production runs uninterrupted. Audit prep builds itself. iFactory's dairy demo is the fastest way to see how this works on your specific equipment — homogenizer, separator, pasteurizer, CIP system, or pumps. Sessions available this week, on-premise NVIDIA appliance or fully managed cloud.
Frequently Asked Questions
How is predictive quality different from predictive maintenance?
Predictive maintenance focuses narrowly on equipment failure timing. Predictive quality analytics covers a broader scope — equipment failure plus process drift, quality outcome, audit readiness, and the operational decisions tied to each. In dairy, where equipment problems cascade quickly into quality and audit issues, the broader scope matters. Same underlying AI techniques (LSTM, RUL, autoencoder), wider application surface.
Does this work with our existing PLCs and SCADA?
Yes. The iFactory platform integrates with the major dairy-industry PLC and SCADA systems via OPC UA, MQTT, Modbus, and proprietary protocols where needed. The deployment team handles the integration — operators don't change how they interact with the existing HMI. The predictive layer adds new dashboards but doesn't disrupt your validated control system.
How accurate is a 6–8 week failure prediction?
For mature deployments (90+ days of training data on your specific equipment), prediction confidence typically runs 85–93% within the 6–8 week window. Confidence increases over time as the model retrains on outcomes — failures correctly predicted, false positives flagged by maintenance teams. The system shows confidence score with every prediction so operators and maintenance can weight their response accordingly.
Do I have to buy NVIDIA servers separately?
No. iFactory's on-premise appliance ships fully loaded — pre-configured NVIDIA AI server, software pre-installed, network gear, cabling, edge devices. You provide rack space, line power, Ethernet, and integration points with your PLC/SCADA. The team installs and configures everything during the 6–12 week deployment. For cloud deployment, there's no hardware investment at all.
What happens if AI predicts a failure but nothing breaks?
Every prediction comes with a confidence score. Lower-confidence predictions route to maintenance for assessment rather than immediate action. The system continuously learns from outcomes — predictions verified by maintenance findings refine the model, predictions that turned out to be false-positives also refine the model. False positive rates typically drop below 8% within the first 90 days of operation.
Can we use this for our HACCP and GFSI audit requirements?
Yes. Every prediction event, maintenance action, and equipment status change is logged with timestamp, attribution, and electronic signature aligned to 21 CFR Part 11. The system generates audit-ready evidence for HACCP CCP monitoring, equipment qualification, change control, and corrective action documentation. GFSI auditors typically appreciate the deeper traceability versus traditional plant maintenance logs.
Can we deploy at one line before expanding to the whole plant?
Yes — and it's the recommended approach. Start with one production line where unplanned downtime is most painful. Validate the prediction accuracy, prove the operational impact, build operator and maintenance confidence. Then expand to other lines in 2–4 week waves. Full plant deployment for a 4–8 line dairy operation typically completes in 3–4 months.
From reactive emergencies to scheduled maintenance — in 6 to 12 weeks.
The 6–8 week predictive lead time isn't a technical detail — it's the difference between Tuesday-morning emergencies and Saturday-afternoon scheduled work. iFactory's dairy demo shows the AI running on representative equipment with predictive failure alerts firing on real signal patterns. On-premise NVIDIA appliance or fully managed cloud, your call on deployment.