Every plant manager has lived this moment: a leadership meeting asks for yield by line across three facilities, and the honest answer takes two days to assemble because the data lives in six disconnected spreadsheets, a legacy MES, and someone's personal tracking sheet. Operations directors running multi-plant food and beverage operations do not have a data shortage — they have a data fragmentation problem, and fragmentation is what turns a five-minute question into a two-day fire drill. iFactory AI's unified analytics platform connects production, quality, and inventory data across every plant into one live view, so the answer is ready before the meeting starts.
The Hidden Cost of Fragmented Plant Data
Fragmentation does not just slow down reporting — it actively hides problems. A quality issue that shows up faintly across three plants looks like noise in each plant's isolated data, but becomes an obvious pattern the moment the data sits in one place. Operations directors who rely on monthly rolled-up reports are, by definition, finding out about cross-plant trends a month after they started, long after the cheapest window to intervene has closed.
The Four Layers of a Unified Analytics Platform
Connects directly to MES, ERP, quality management systems, and inventory platforms across every plant, eliminating manual exports and spreadsheet consolidation.
Standardizes SKU codes, plant identifiers, and metric definitions across systems that were never built to talk to each other, so a "yield" figure means the same thing everywhere.
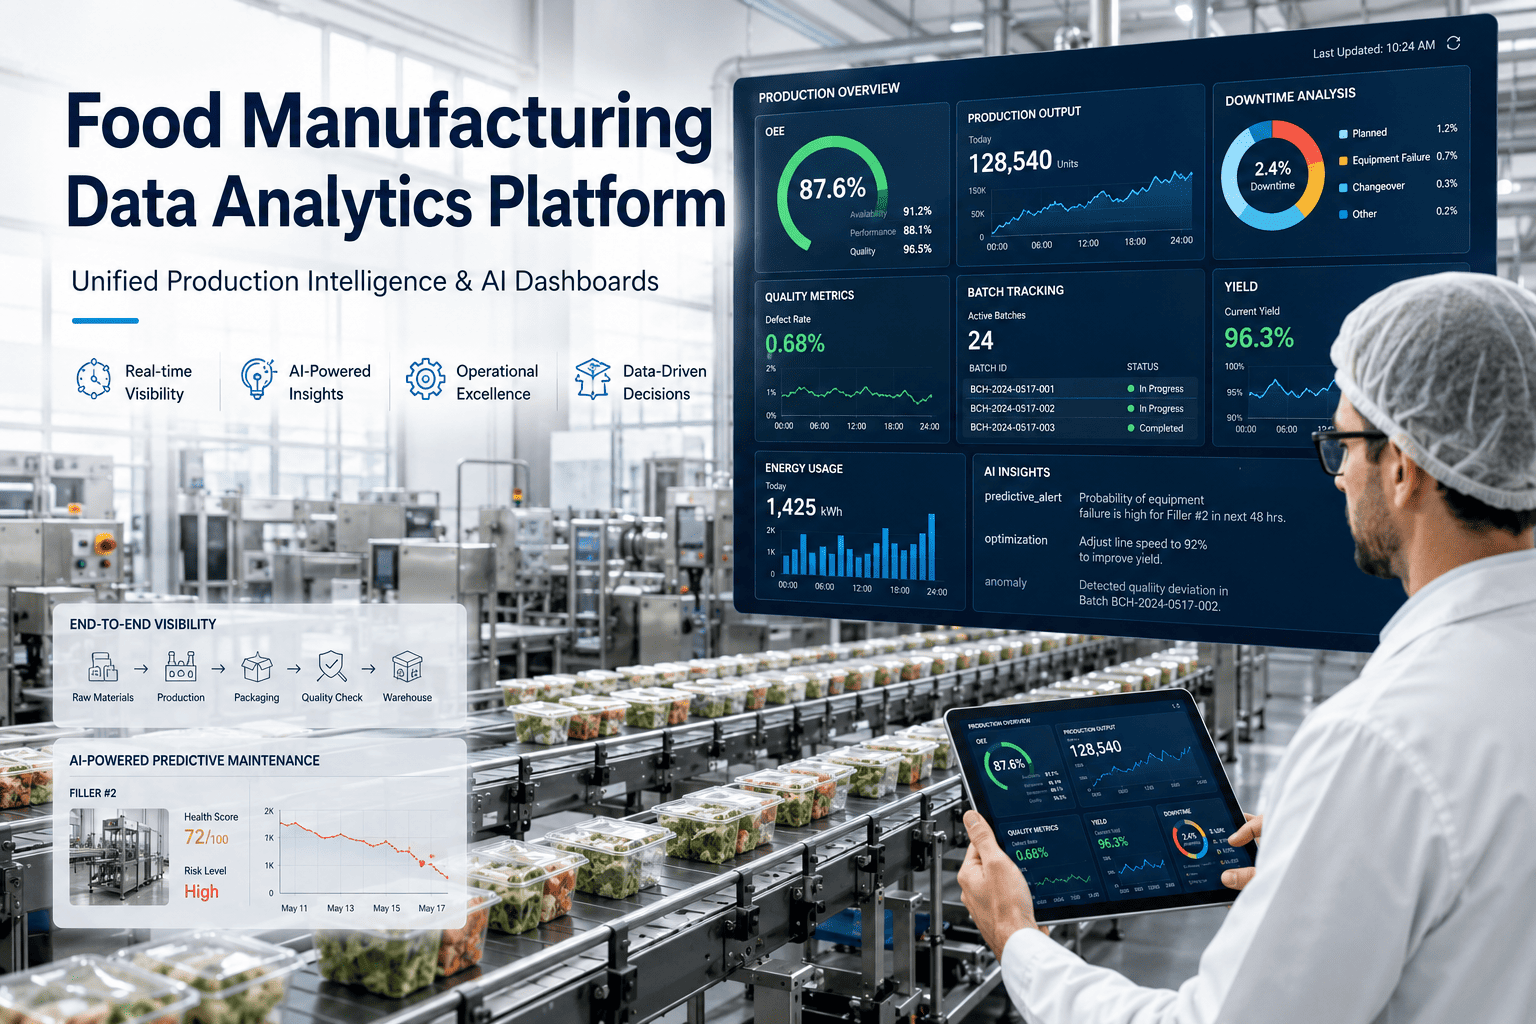
Presents live yield, downtime, quality, and inventory metrics in role-specific views, so a plant manager and a VP of operations see the same data at the depth each of them needs.
Surfaces cross-plant patterns and anomalies automatically — a line trending toward a quality issue, or a plant consistently underperforming a benchmark — before they show up in a monthly report.
What Cross-Plant Benchmarking Actually Reveals
Identical equipment across plants often shows meaningfully different yield, revealing operator technique or maintenance gaps that a single-plant view would never surface.
A defect type appearing at low frequency in several plants individually can represent a shared supplier or ingredient issue only visible in aggregate.
Comparing downtime causes across plants highlights which best practices from a top-performing line should be standardized elsewhere.
Plants with slower inventory turns for identical SKUs often reveal local planning practices that a unified view makes easy to compare and correct.
Manual Reporting vs. Unified Platform
| Capability | Manual Spreadsheet Reporting | Unified Analytics Platform |
|---|---|---|
| Time to Cross-Plant Report | 1–3 days of manual consolidation | Available on demand, continuously updated |
| Data Consistency | Varies by plant and by person compiling it | Standardized definitions across every plant |
| Anomaly Detection | Only visible if someone happens to notice it | Surfaced automatically as it emerges |
| Historical Trend Access | Limited to whatever was archived manually | Full historical record queryable instantly |
Operations Director Perspective
Before we unified our reporting, my monthly ops review meant three plant managers sending me spreadsheets in three different formats, and I spent the first hour of every review just reconciling numbers instead of discussing them. Six months after connecting all three plants into one dashboard, that reconciliation time disappeared entirely, and we caught a packaging line quality drift at one plant within days because the pattern was visible against the other two plants' baseline instead of buried in a single facility's monthly average. The real value was not the dashboard itself — it was getting an hour of every meeting back to actually solve problems instead of arguing about whose spreadsheet was right.
— Operations Director, Multi-Plant Beverage ManufacturerConclusion
Fragmented data does not just slow reporting down — it hides the exact cross-plant patterns that matter most, from shared supplier defects to operator technique gaps, until they show up as a much bigger problem later. Operations directors who unify their production data are not just saving reporting time; they are seeing problems weeks or months before a manual process ever would. Book a demo to see your own plants benchmarked against each other in one live view.
Frequently Asked Questions
Most plants see initial dashboards live within a few weeks of connecting a first data source, with full multi-plant integration typically completing within 8 to 12 weeks depending on how many systems and plants are involved. Integration timelines are driven more by data quality and system access than by the platform itself. Book a demo to scope a timeline for your specific systems.
No, a unified analytics platform sits on top of your existing MES, ERP, and quality systems, pulling data from each into one standardized view rather than replacing the systems that generate that data. This approach avoids the disruption and cost of ripping out operational systems that already work.
Yes, role-specific dashboards are standard practice — a plant manager typically needs line-level detail while a VP of operations needs plant-level and cross-plant summaries, and a well-designed platform presents both from the same underlying data without requiring separate reports for each audience.
Effective benchmarking normalizes for factors like SKU mix, equipment age, and shift patterns before comparing plants directly, since a raw comparison without these adjustments can mislead rather than inform. Platforms that surface these adjustments transparently give operations leaders more confidence acting on the comparisons. Contact support to discuss benchmarking methodology for your plant mix.
A reporting dashboard shows you the current and historical state of your metrics when you look at it, while AI-driven insights actively surface anomalies and emerging patterns without requiring someone to know to look for them. Both are valuable, but AI-driven insight generation is what catches a cross-plant quality drift days into its formation instead of a month later in a scheduled review.