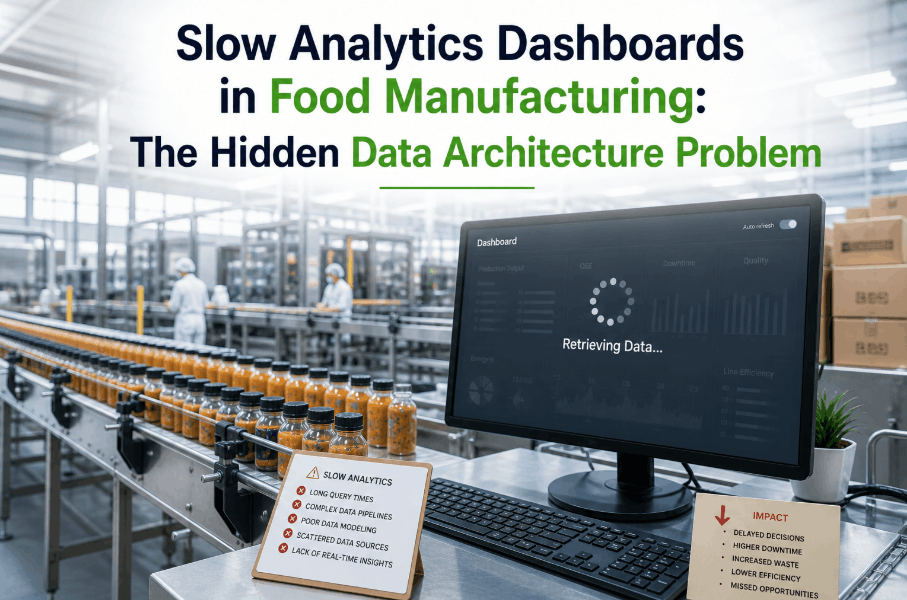
Slow analytics dashboards in food manufacturing are not just a user experience problem — they are a critical operational signal. When production managers wait 30 seconds for a yield report to load, when quality supervisors refresh batch deviation screens that stall mid-render, or when shift supervisors cannot access real-time OEE data during live production runs, the issue is almost never the dashboard software itself. It is the data architecture underneath it. In 2026, food manufacturers deploying AI-driven analytics platforms are discovering that dashboard lag, query timeouts, and inconsistent data freshness trace back to foundational infrastructure decisions — fragmented data pipelines, unoptimized schema designs, and legacy historian integrations that were never built to support real-time analytics at production scale. Understanding the hidden data architecture problem behind slow analytics dashboards is the first step toward building a manufacturing intelligence platform that actually performs. To see how AI-driven data infrastructure eliminates dashboard lag in food manufacturing environments, Book a Demo with the iFactory team today.
Why Analytics Dashboards Slow Down in Food Manufacturing Environments
The Root Cause Behind Dashboard Performance Issues Is Almost Always Upstream
Food manufacturing operations generate data at extraordinary volume and velocity — PLC signals, SCADA time-series records, ERP batch logs, MES event streams, quality inspection results, and environmental sensor readings, all flowing simultaneously from dozens of assets across a single production line. When this data feeds into analytics dashboards through architectures that were not designed for real-time aggregation, the result is predictable: slow load times, stale KPIs, and dashboards that show what happened three hours ago rather than what is happening right now. The most common architectural failures that produce slow analytics systems in food manufacturing include unpartitioned time-series tables with full sequential scans on every dashboard refresh, missing materialized views for frequently-queried aggregation patterns, historian connections pulling raw tag data directly into the analytics layer without intermediate transformation, and cloud data warehouses executing row-level queries against tables containing years of unarchived production records. Each of these failures has a specific infrastructure remedy — and none of them can be solved by switching dashboard vendors.
The Data Architecture Problems Causing Slow AI-Driven Dashboards
Six Infrastructure Failures That Degrade Analytics System Performance in Food Plants
Food manufacturing analytics teams often invest significant resources in dashboard configuration, visualization design, and frontend optimization — while the actual bottleneck sits three layers deeper in the data stack. Identifying the specific architecture failure patterns behind your slow analytics system is essential before any infrastructure investment delivers measurable performance improvement. The six failure patterns below account for the vast majority of analytics system performance issues observed in food manufacturing deployments. QA engineers and IT architects who want a live diagnosis of their specific data pipeline bottlenecks can Book a Demo and walk through a real-time infrastructure assessment with iFactory's data engineering team.
Real-Time Analytics Data Platform Architecture for Food Manufacturing
How AI-Driven Data Pipelines Deliver Sub-Second Dashboard Performance at Production Scale
Solving slow analytics dashboards in food manufacturing requires rebuilding the data architecture from the ingestion layer through to the query serving layer — not reconfiguring the visualization frontend. A modern real-time analytics data platform for food manufacturing operates across four architectural tiers, each optimized for its specific function within the production data lifecycle. Manufacturers who have deployed this architecture report dashboard load times dropping from 25–40 seconds to under 2 seconds, with data freshness improving from hourly batch updates to sub-10-second streaming latency. If your production analytics system is showing these performance gaps, you can Book a Demo to see the architecture in a live food manufacturing deployment.
Predictive Analytics Infrastructure: Beyond Real-Time Visibility
Why Predictive Analytics Data Infrastructure Requires a Different Architecture Than Reporting
Real-time dashboard performance is the foundational requirement — but leading food manufacturers are now deploying predictive analytics infrastructure that goes beyond displaying current production status to forecasting equipment failure, yield deviation, and quality non-conformance events before they materialize. Predictive analytics data infrastructure for food manufacturing operates on a feature store architecture that maintains pre-computed ML feature sets derived from production time-series, equipment condition signals, and environmental monitoring data. These feature stores feed predictive model inference pipelines that generate alerts and recommendations with single-digit-second latency — not the 30-minute scoring cycles that batch-oriented ML deployments produce. The architecture distinction is critical: a reporting-optimized data warehouse cannot serve as the foundation for real-time predictive analytics. Manufacturers planning to extend their analytics platform to include predictive capabilities can Book a Demo to review the feature store architecture iFactory uses in production food manufacturing environments.
Dashboard Performance Benchmarks: Before and After Data Architecture Optimization
Measurable Impact of AI-Driven Data Pipeline Optimization on Food Manufacturing Analytics
The performance improvements delivered by data architecture optimization in food manufacturing environments are quantifiable and consistent. The comparison below reflects observed performance deltas across food manufacturing deployments that migrated from legacy batch-ETL analytics architectures to AI-driven real-time data pipeline infrastructure.
| Performance Metric | Legacy Batch ETL Architecture | AI-Driven Real-Time Pipeline | Improvement Factor |
|---|---|---|---|
| OEE Dashboard Load Time | 22–38 seconds | 1.2–2.4 seconds | 12–16× faster |
| Production Data Freshness | 60–120 minutes (batch) | <10 seconds (streaming) | 360–720× more current |
| Concurrent User Capacity | 5–12 users before degradation | 50–200 users stable | 10–17× higher concurrency |
| Batch Deviation Alert Latency | 45–90 minutes post-event | 8–25 seconds post-event | 200–600× faster detection |
| Historical Query Response (90-day) | 4–12 minutes | 8–22 seconds | 25–45× faster |
| Predictive Model Inference Latency | 30–60 minute scoring cycles | 2–8 seconds per prediction | Real-time vs. batch |
Common Misconceptions About Slow Manufacturing Analytics Dashboards
Why Switching Dashboard Tools Does Not Solve Data Architecture Performance Problems
The most expensive mistake food manufacturing IT and OT teams make when confronted with slow analytics dashboards is treating the frontend as the problem. Dashboard software vendors — whether purpose-built manufacturing intelligence platforms or general-purpose BI tools — frequently receive replacement evaluation cycles driven by performance complaints that their products did not cause and cannot fix. A Tableau dashboard running against an unpartitioned PostgreSQL table will be slow. A Power BI report connecting directly to a process historian will time out under concurrent load. A Grafana instance querying a flat InfluxDB bucket with no downsampling will stall on 12-month trend visualizations. The visualization layer is constrained by the data it can access and the speed at which that data can be retrieved — and no frontend optimization changes those constraints. Food manufacturers who have already cycled through multiple dashboard tools without performance improvement and want to diagnose the actual infrastructure bottleneck can Book a Demo for a root-cause data architecture assessment.
Implementation Roadmap: Rebuilding Your Food Manufacturing Analytics Architecture
A Phased Approach to Eliminating Slow Analytics Dashboards Through Infrastructure Modernization
Migrating from a legacy batch-ETL analytics architecture to an AI-driven real-time data platform is a structured engineering undertaking that does not require a full production system cutover. The phased approach below reflects the migration sequence that minimizes production data risk while delivering measurable dashboard performance improvements at each stage.
Frequently Asked Questions
Why are analytics dashboards slow in food manufacturing environments?
Slow analytics dashboards almost always trace back to data architecture failures — unpartitioned time-series tables, missing materialized views, and batch ETL pipelines creating 60–120 minute data freshness gaps. Solving dashboard lag requires infrastructure changes at the pipeline and schema layer, not replacing the dashboard software.
What is a real-time analytics data platform for food manufacturing?
It is a multi-tier infrastructure that replaces batch ETL with streaming ingestion, stores operational data in tiered hot/warm/cold storage, and serves dashboard queries through a semantic caching layer. The result is sub-second dashboard load times and data freshness measured in seconds rather than hours.
How does predictive analytics infrastructure differ from reporting infrastructure?
Reporting infrastructure aggregates historical records on demand. Predictive analytics requires a feature store with pre-computed ML feature sets and low-latency inference pipelines that score predictions against live production data within seconds — fundamentally different query patterns that cannot share the same architecture.
How much performance improvement is realistic after data architecture optimization?
Most food manufacturing deployments achieve 8–16× dashboard load time improvement and data freshness improvement from hourly batches to sub-10-second streaming latency. Schema optimization alone — before any streaming pipeline changes — typically delivers 5–10× query performance improvement.
Can existing manufacturing dashboards connect to a new data architecture without rebuilding?
Yes. Most BI tools — Grafana, Power BI, Tableau — connect via standard SQL or API interfaces. Optimizing the data architecture layer improves existing dashboard performance without frontend redesign, as long as data source connection strings are updated to point to the new pipeline.
What data sources does a food manufacturing real-time analytics platform connect?
A complete platform ingests from process historians (OSIsoft PI, Ignition, WonderWare), MES event streams, ERP batch records, quality management systems, and equipment condition monitoring. The streaming ingestion layer normalizes formats and timestamps across all sources before delivery to the analytics storage tier.