How Operators Use Adaptive Control Limits for Scrap Reduction in Dairy Processing Food Manufacturing
By Riley Quinn on May 21, 2026
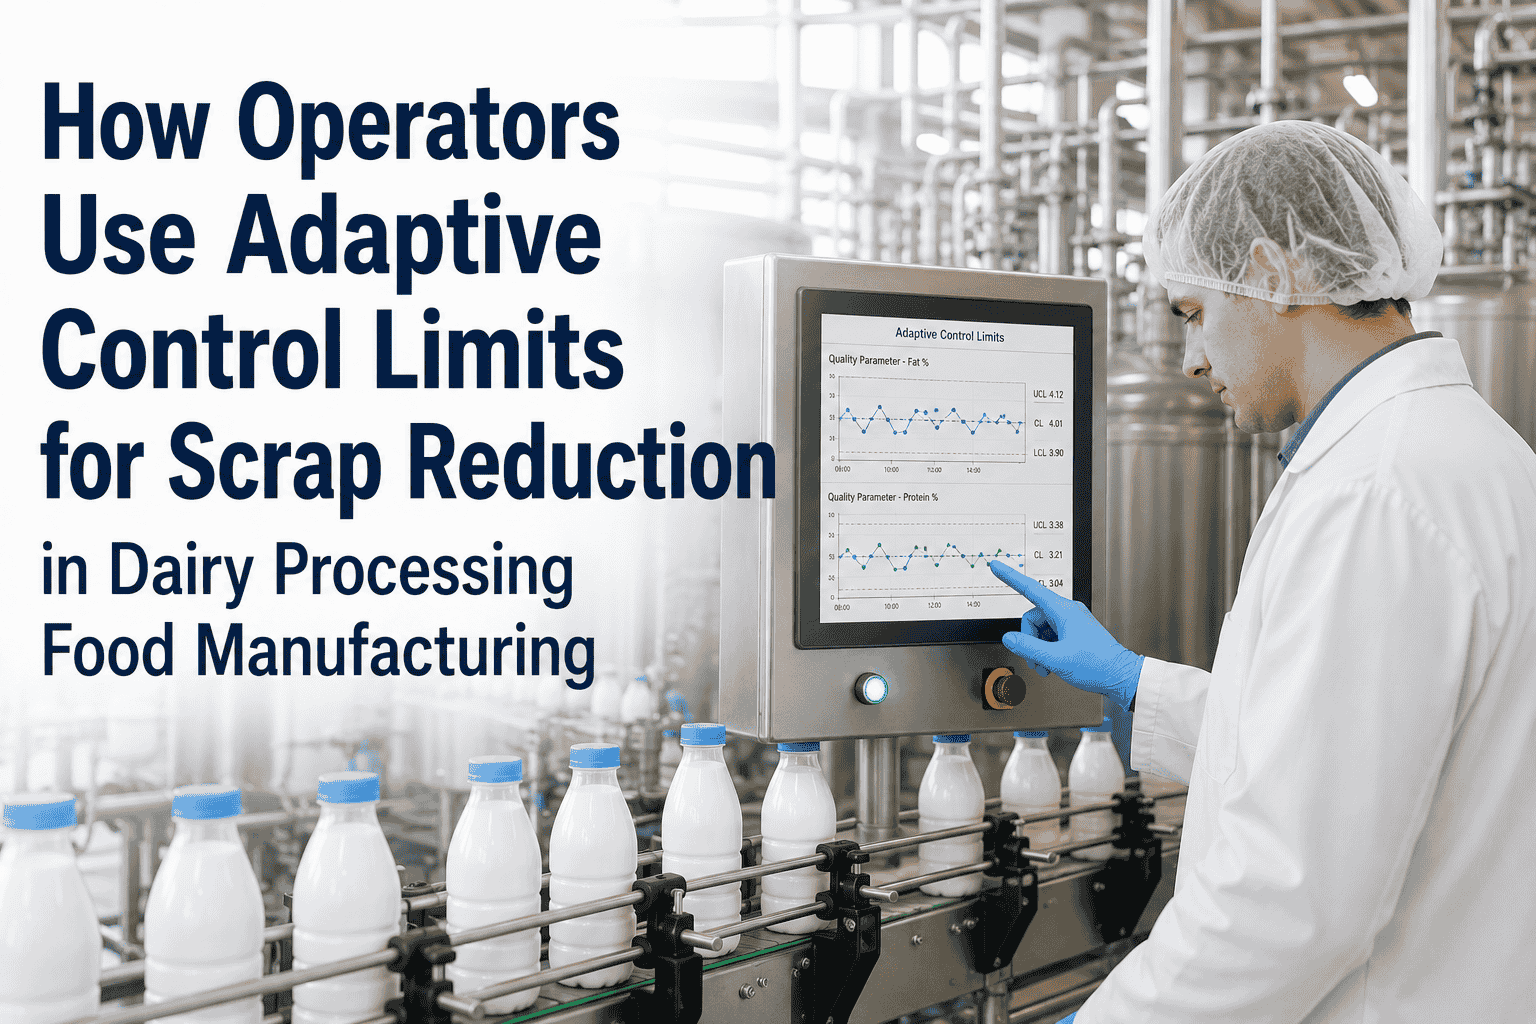
Static control limits are the silent tax on every dairy line. Set them once during commissioning at ±3 sigma around a steady-state recipe, then watch them lie to you for the next decade. They flag false alarms during normal startup variation. They miss real drift hidden inside “in-control” statistics. And every changeover, every grade switch, every recipe tweak forces operators to mentally subtract: that’s not really out of spec, the limit just isn’t calibrated for this run. Adaptive AI control limits end that game. They learn each product, each grade, each operator shift, each season, and each startup curve — tightening ,or widening the band in real time so what you see on the chart actually corresponds to what’s happening on the line. The result on dairy floors: 30–50% startup scrap reduction, sharp drops in giveaway, and changeovers that don’t bleed product for the first hour. This guide shows operators exactly how to use them. Book a demo with us to see adaptive limits drawn on your historian data.
Control Chart Comparison · Fat % on Line 3
YOGURT BATCH · 06:00–06:45
Static SPC limits (legacy)
False alarms:4 in 45 min
Startup scrap:~180 packs
Adaptive AI limits
False alarms:0 in 45 min
Startup scrap:~60 packs
Why Static Control Limits Lie to Dairy Operators
Classical SPC was built for stable, single-product manufacturing — widgets coming off a machine that runs the same recipe all day. Dairy isn’t that. A pasteurizer ramping from cold-start hits its hold-tube temperature on a curve, not a step. A separator finds its fat-skimming equilibrium over the first ten minutes. A filler stabilizes its weight-cell variance after a few hundred packs. Static limits drawn around a steady-state run will fire constantly during these normal stabilization curves — teaching operators to ignore the alarms. Which is when the real drift slips through.
Calibrated once, wrong forever
Limits set during commissioning don’t account for product variation, seasonal milk composition, or equipment wear across years.
Alarms during normal startup
Pasteurizer warm-up, separator stabilization, and filler ramp-in all violate static limits even when the process is healthy.
Drift hidden inside “in-control”
A slow trend that stays inside ±3 sigma can compound into a major spec breach hours later — invisible to a static chart.
One-size-fits-all across recipes
Greek yogurt, low-fat milk, and cream cheese each behave differently — but most lines run them all against the same fat % limits.
What Adaptive Control Limits Actually Do
Adaptive control limits use AI to set the upper and lower bounds dynamically — calculated from the current product, the current shift, the current startup stage, and the current equipment health. The center line moves with the recipe. The width of the band shifts based on phase: wider during stabilization, tighter during steady-state. The math is still SPC, but the limits are no longer locked at commissioning. Here’s the side-by-side on what changes.
Behavior
Static SPC
Adaptive AI Limits
Limit calculation
Set once at commissioning
Recalculated continuously from live data
Recipe sensitivity
Same band for every product
Per-recipe, per-grade, per-shift
Startup behavior
Constant false alarms
Wider band during stabilization curve
Drift detection
Misses slow trends inside band
Catches statistical drift before spec breach
Operator workload
Mental override of obvious false alarms
Trust the chart — act on real signals only
Scrap during startup
High — first 50–200 packs lost
30–50% reduction across startup window
Want to see your line’s static limits redrawn as adaptive? Book a 30-minute working session — bring your toughest recurring false alarm.
Where the Scrap Actually Hides on a Dairy Line
Scrap isn’t one thing. It’s four distinct hiding places that adaptive limits expose differently. Each represents a chunk of waste that operators have learned to accept as “the cost of running” — until they see what it looks like with adaptive limits drawn correctly.
35–45%
Startup & Changeover
The first 50–200 packs after recipe switch. Static limits flag this whole phase as “out of control” even when it’s normal stabilization. Adaptive limits widen the band during stabilization, then tighten as the line settles.
25–30%
Giveaway
Overfill on weight-target products — cheese spreads, yogurt cups, cream. Static fillers overdose to stay safely above LCL. Adaptive limits run tighter against the target without crossing it.
15–20%
Out-of-Spec Batches
Whole batches diverted for rework or downgrade after lab confirms drift the static chart missed. Adaptive limits flag the drift while there’s still time to correct.
10–15%
Rework & Quality Holds
Product held for retest, recooked, or repurposed. The accumulated effect of operators ignoring chronic false alarms — a habit static limits actively train.
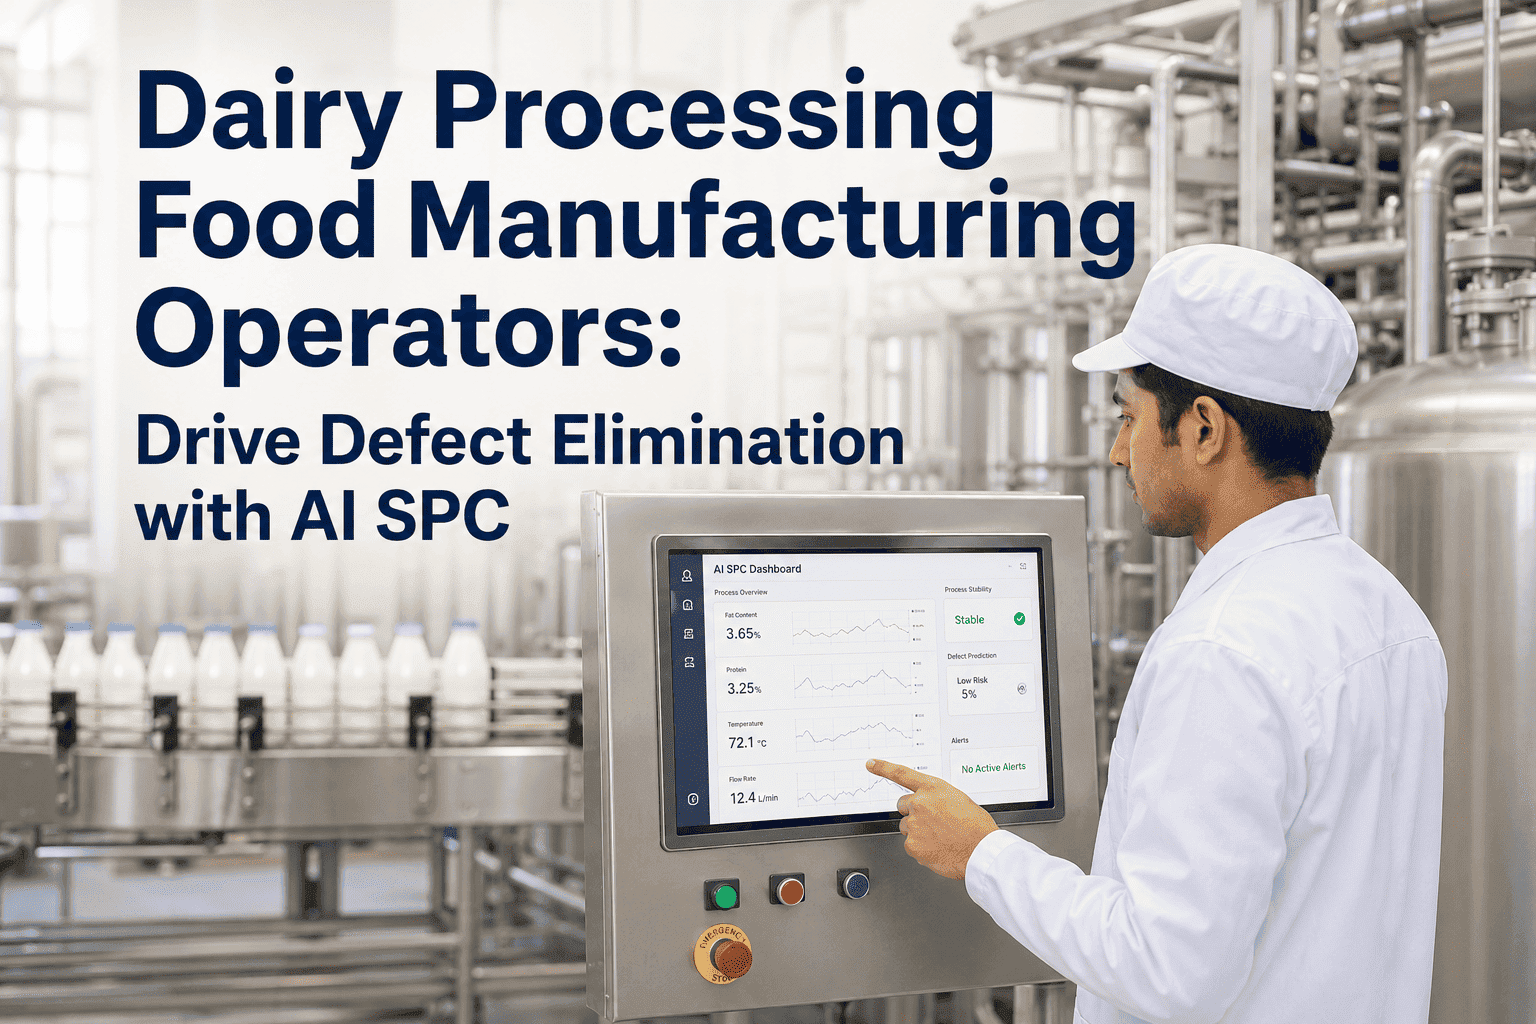
The Operator’s Workflow with Adaptive Limits
Nothing about the operator’s physical workflow changes. The HMI stays where it is, the SCADA still drives the controls, the shift schedule still owns the shop floor. What changes is what the chart on the screen actually means — and what the operator does with it.
01
Adaptive Band Loads with Recipe
When the operator selects the recipe at shift start, the AI loads the correct adaptive control band for that product, grade, and current line conditions — no manual recalibration.
02
Band Widens for Startup Curve
During pasteurizer warm-up and line stabilization, the band sits wider — reflecting expected variance during the curve. No false alarms.
03
Band Tightens at Steady State
Once the line is stable, the band narrows progressively. Drift that would have hidden inside static ±3 sigma now shows up early.
04
Operator Sees Real Signals Only
When the chart flags a deviation, it’s a real signal — not a false alarm masked by recipe context. Operator trust in the chart returns.
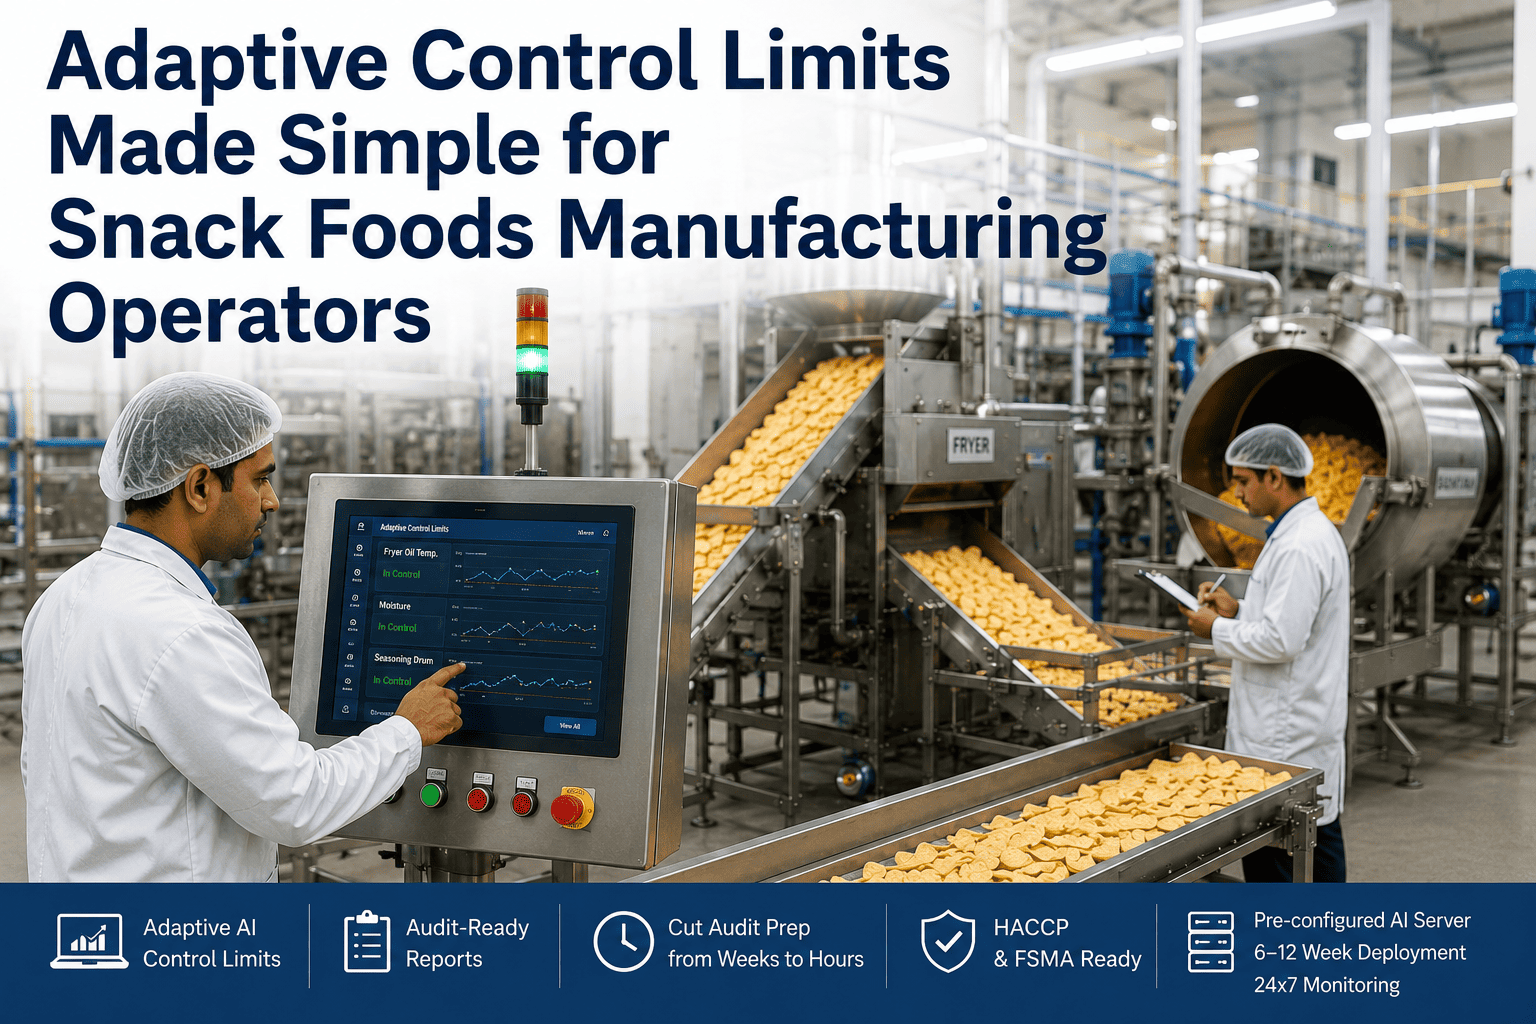
From Ignored Alarms to Trusted Signals in 6–12 Weeks
iFactory ships a pre-configured AI server tuned for dairy — pasteurizer, homogenizer, separator, filler, CIP. Connects to your PLC and SCADA, learns your recipes from 6–8 weeks of historian data, and delivers adaptive limits to operators within 6–8 weeks of go-live.
The numbers shift from theory to operating impact fast. Here’s the math on a representative mid-sized dairy line running cheese, yogurt, and milk products with three changeovers per shift.
Before
~520
packs scrapped per shift
Static limits, 3 changeovers, normal startup loss
After
~290
packs scrapped per shift
Adaptive limits, same changeover count
Result
44%
reduction in shift scrap
~$45K–$80K saved per line per year
The mid-range estimate aligns with documented case studies including Fonterra’s Dennington facility, which reduced protein giveaway by 49% by moving from batch to predictive control. The math sits on top of OEE: scrap reduction lifts the Quality factor, which multiplies against Availability and Performance — pulling the whole shift number up at the same time.
Want the same math run against your line’s production volumes? Book a scrap reduction demo and we’ll model your specific savings.
Common Operator Questions Before Day One
Most operators have the same three concerns when they hear “AI control limits” for the first time. The honest answers below are what changes hesitation into adoption inside the first week of go-live.
"Will the AI override my judgment?"
No. Adaptive limits are decision-support, not autonomous control. The AI redraws the band on your chart and surfaces signals — you still execute every corrective action. Nothing in the PLC control loop changes. The operator is still the one driving the line.
"What happens during a brand-new recipe rollout?"
For new recipes the AI starts from your existing static limits as a safe initial band, then learns the new recipe’s natural variance over the first 4–8 production runs. During the learning window, the band stays wider than necessary by design — conservative until enough data exists to tighten it confidently.
"How do I know the AI hasn’t set the band too wide and missed something?"
Every adaptive limit comes with a confidence indicator and a hard ceiling at the regulatory or recipe spec limit — the AI never widens past the legal or food-safety bound. The chart shows both the adaptive band and the absolute spec line, so you always see the relationship. Audit trails log every band adjustment.
Expert Perspective
"The shift from static SPC to adaptive limits is the most important quality-engineering change on dairy lines this decade. It restores the original promise of statistical process control — the operator trusts the chart. When the chart shows green, the line is healthy. When it shows yellow, action is required. The mental gymnastics of “is this a real alarm or just startup noise” disappear, and that’s where the 30–50% scrap reduction actually comes from. The math is downstream of the trust shift."
— Dairy Process Control Practice, 2026 industry insight
49%
protein giveaway reduction at Fonterra Dennington with predictive control
50–200
parts scrapped per startup before line stabilizes
85%
world-class OEE target reachable with adaptive control lift
Conclusion: Trust the Chart Again
Static control limits taught a generation of dairy operators to second-guess their own SPC charts. The result is a culture where alarms get muted, drift gets normalized, and scrap gets accepted as the cost of running. Adaptive AI control limits flip that culture quietly — not by changing the operator’s workflow, but by making the chart honest. The band moves with the recipe. The band widens for startup curves. The band tightens for steady state. When the chart finally tells the truth about your line, you reduce scrap 30–50%, cut giveaway, compress changeovers, and lift the shift OEE number all at the same time. The technology is mature. The deployment runs 6–12 weeks. The first validated alerts arrive in 6–8. The only question left is which line you start on. Book a demo with us to see it on yours.
Bring Adaptive Limits to Your Line
iFactory’s dairy practice deploys adaptive AI control limits in 6–12 weeks against your existing PLC and SCADA — no rip-and-replace, no new sensors required. 24x7 monitoring, mobile-first operator alerts, pre-configured for dairy recipes from day one.
What are adaptive control limits in dairy processing?
Adaptive control limits are dynamic upper and lower bounds on a control chart that recalculate continuously based on the current product, grade, shift, startup phase, and equipment condition. Unlike traditional static SPC limits set once during commissioning, adaptive limits widen during normal stabilization (pasteurizer warm-up, separator equilibrium, filler ramp-in) and tighten during steady-state operation. This eliminates the false alarms that historically train dairy operators to mistrust their charts, and exposes the real drift hidden inside “in-control” statistics. Plants typically see 30–50% startup scrap reduction within the first quarter of deployment.
How do adaptive control limits reduce scrap on a dairy line?
Scrap on a dairy line hides in four places: startup and changeover (35–45%), giveaway from overfill (25–30%), out-of-spec batches caught too late (15–20%), and rework or quality holds (10–15%). Adaptive limits address all four. They widen during startup so the first 50–200 packs aren’t treated as out-of-control. They tighten near target during steady state so fillers stop overdosing for safety margin. They catch slow drift before it crosses the spec line. And they restore operator trust so chronic false alarms stop being ignored. The combined effect is documented at the Fonterra Dennington facility, which reduced protein giveaway by 49% by moving from batch to predictive control.
Will adaptive limits replace our existing PLC, SCADA, or SPC software?
No. iFactory’s adaptive control limits layer sits above your existing controls stack. It reads data from your PLCs and SCADA over standard industrial protocols, runs adaptive band calculations on a pre-configured AI server, and pushes updated limits back to your operator HMI or existing SPC display. PLCs continue to run the control logic as they always have. SCADA continues to display alarms and trends operators are trained on. Your existing SPC software, if any, continues to function — the AI just feeds it smarter limits than the commissioning team could set manually a decade ago.
How long does adaptive control limits deployment take on a dairy line?
Typical deployment runs 6–12 weeks. The first 2–3 weeks cover PLC and SCADA integration and ingest of your historian data. The next 4–6 weeks are model calibration — the AI learns each recipe’s natural startup curve and steady-state variance from 6–8 weeks of historical production. The final 2–4 weeks involve operator-side band-width tuning so the chart aligns with what your team considers actionable. Most plants report first validated adaptive limits within 6–8 weeks, full coverage across all recipes by week 10–12, and measurable scrap reduction within the first month of live operation.
What does this mean for operator training and shift culture?
Training is intentionally light. A 60–90 minute walkthrough plus shift-side support during the first week of go-live is typical. The reason is that nothing about the physical workflow changes — the operator still owns the line, still executes corrective actions, still drives the recipe. The only behavioral shift is that operators stop mentally overriding their own charts. Inside the first month of deployment, most dairy teams report that morning huddles change tone: fewer defensive explanations of last shift’s scrap, more forward-looking discussion of which products are tracking against forecast. That cultural shift is what compounds into the documented 30–50% scrap reductions.