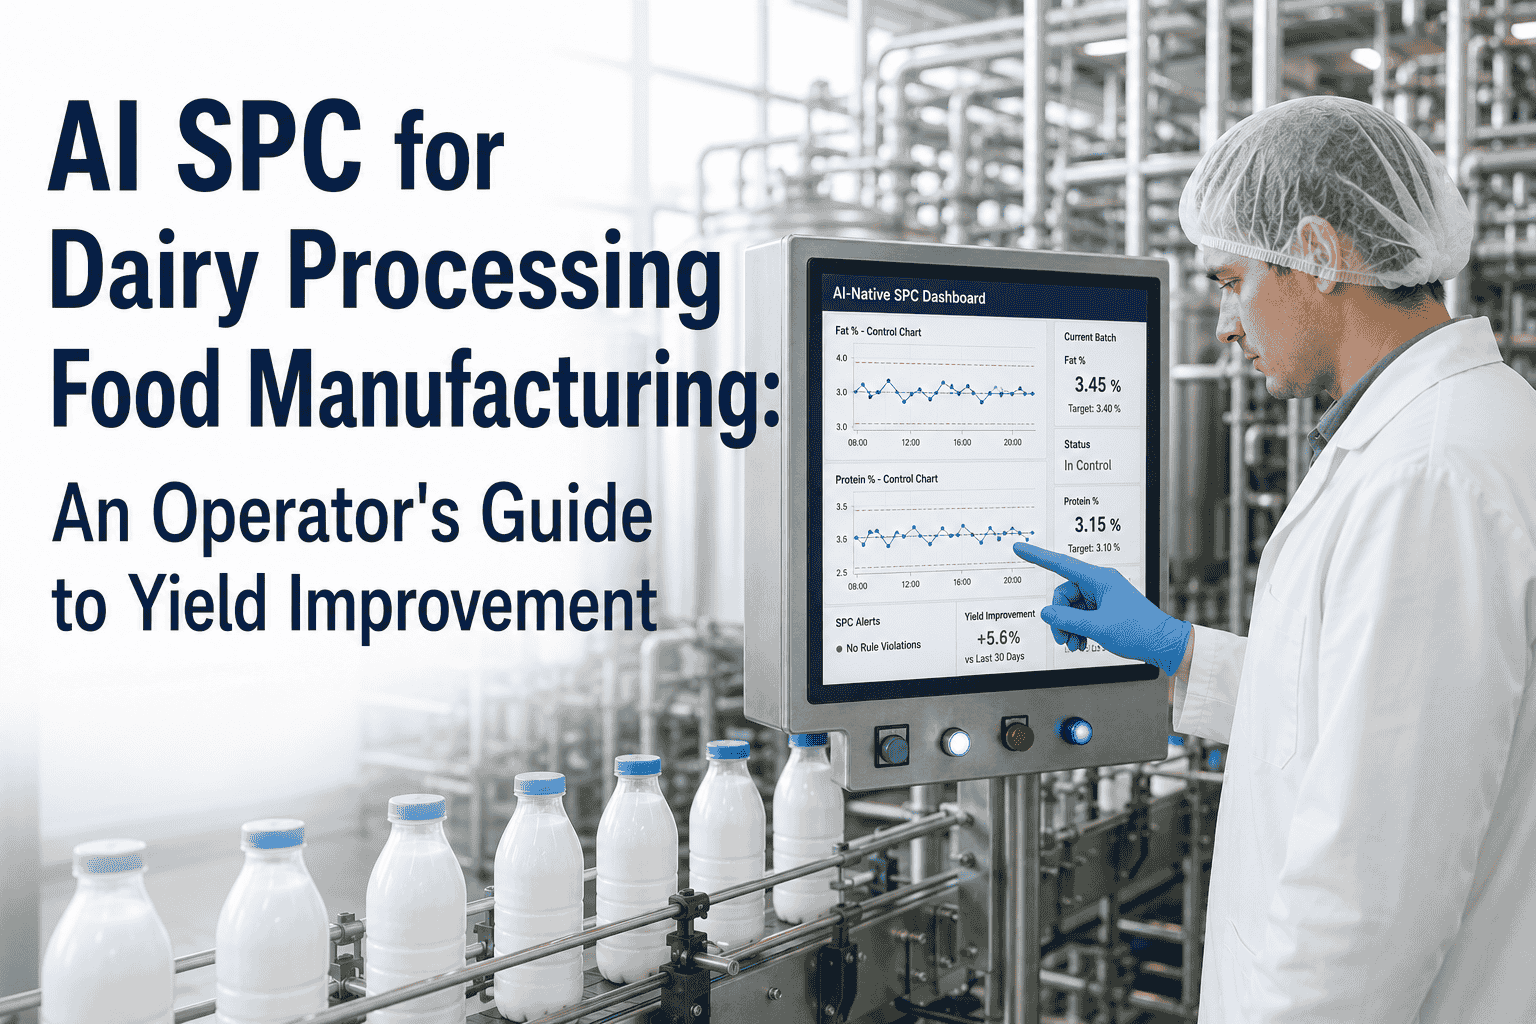
Statistical Process Control was invented in 1924 at Bell Labs by Walter Shewhart, codified into the Western Electric Rules in 1956, and expanded into Lloyd Nelson’s eight rules in 1984. Every dairy quality engineer for the last forty years has learned them. Every operator has seen them taped to a wall in the control room. And yet on most dairy lines today, those eight rules are still being applied by hand — by an operator squinting at a printed chart, mentally checking whether the last nine points landed on the same side of the mean. AI-native SPC ends that. It applies all eight Nelson rules continuously to every signal on the line, simultaneously, in real time — and surfaces only the patterns that actually matter, with the corrective action attached. The operator’s job becomes what it was always supposed to be: judgment on edge cases, not pattern-detection on stable processes. The result on dairy lines: 4–8 point first-pass yield lift, 37% defect rate reduction, 22% throughput improvement. This guide walks through how it works. Book a demo with us to see the eight rules running on your historian data.
R2
9 points same side of mean
R3
6 points trending up or down
R4
14 points alternating up & down
R5
2 of 3 points beyond 2σ
R6
4 of 5 points beyond 1σ
R7
15 points within 1σ (stratification)
R8
8 points outside 1σ (mixture)
The Three Charts Every Dairy Operator Should Know
AI-native SPC doesn’t replace control charts — it picks the right one automatically for each data type and runs it without manual setup. Three chart families cover almost every signal on a dairy line. Knowing which is which still matters, because what the AI does behind the scenes maps directly to these.
Variable data · subgroups
X-bar R
Used when you can take small samples in groups — fat % every 5 minutes, protein % every batch. Tracks both the average and the spread within each subgroup.
Best for:
Fat %, protein %, viscosity, density
Variable data · individuals
I-MR
Used when each measurement is a single reading — pasteurizer hold-tube temperature, homogenizer pressure, individual CIP cycles. Tracks the individual value and the moving range between consecutive readings.
Best for:
Temperature, pressure, CIP cycle time
Attribute data
P / C Chart
Used for pass-fail or defect-count data — seal failures per 1000 packs, contamination flags per shift. P-chart tracks proportions, C-chart tracks counts.
Best for:
Seal defects, leak rate, reject counts
What "AI-Native" Actually Means — The Difference From Legacy SPC
The phrase “AI-native” gets used loosely. On a dairy line it has a precise meaning: every step of the SPC workflow that was manual is now automated, and every signal that was monitored in isolation is now monitored against every other signal it correlates with. Five capabilities separate legacy SPC software from AI-native SPC.
01
Auto-chart selection
AI selects the correct chart type (X-bar R, I-MR, P, C) based on the data structure of each signal — no manual setup per parameter.
02
Continuous baseline learning
UCL and LCL recalculate continuously from live data instead of being locked at commissioning. Adjusts naturally to seasonal milk composition.
03
All 8 Nelson rules in parallel
Every signal evaluated against all eight rules simultaneously — not just “point beyond 3σ.” Catches trend, oscillation, and clustering patterns operators can’t track manually.
04
Multivariate correlation
Tracks relationships between signals — fat-protein ratio drift, homogenizer pressure vs. viscosity. Single-variable SPC misses these entirely.
05
Prescriptive action attached
Every rule violation arrives with the recommended corrective setpoint — not a generic “investigate” alarm. Cuts response time from minutes to seconds.
See it on your data
30-minute working session running these 5 capabilities on your line’s historian.
Book a Demo
Curious which of these five capabilities would lift your line’s yield the most? Book a 30-minute working session with our dairy SPC specialists.
Where Yield Actually Lives — And How AI-Native SPC Lifts It
First-pass yield (FPY) on a dairy line is the product of dozens of small wins compounded. A 4–8 point lift doesn’t come from one breakthrough — it comes from tightening the control on a handful of high-leverage parameters at the same time. Here’s where the math actually moves.
Parameter
Why it bleeds yield
FPY lift
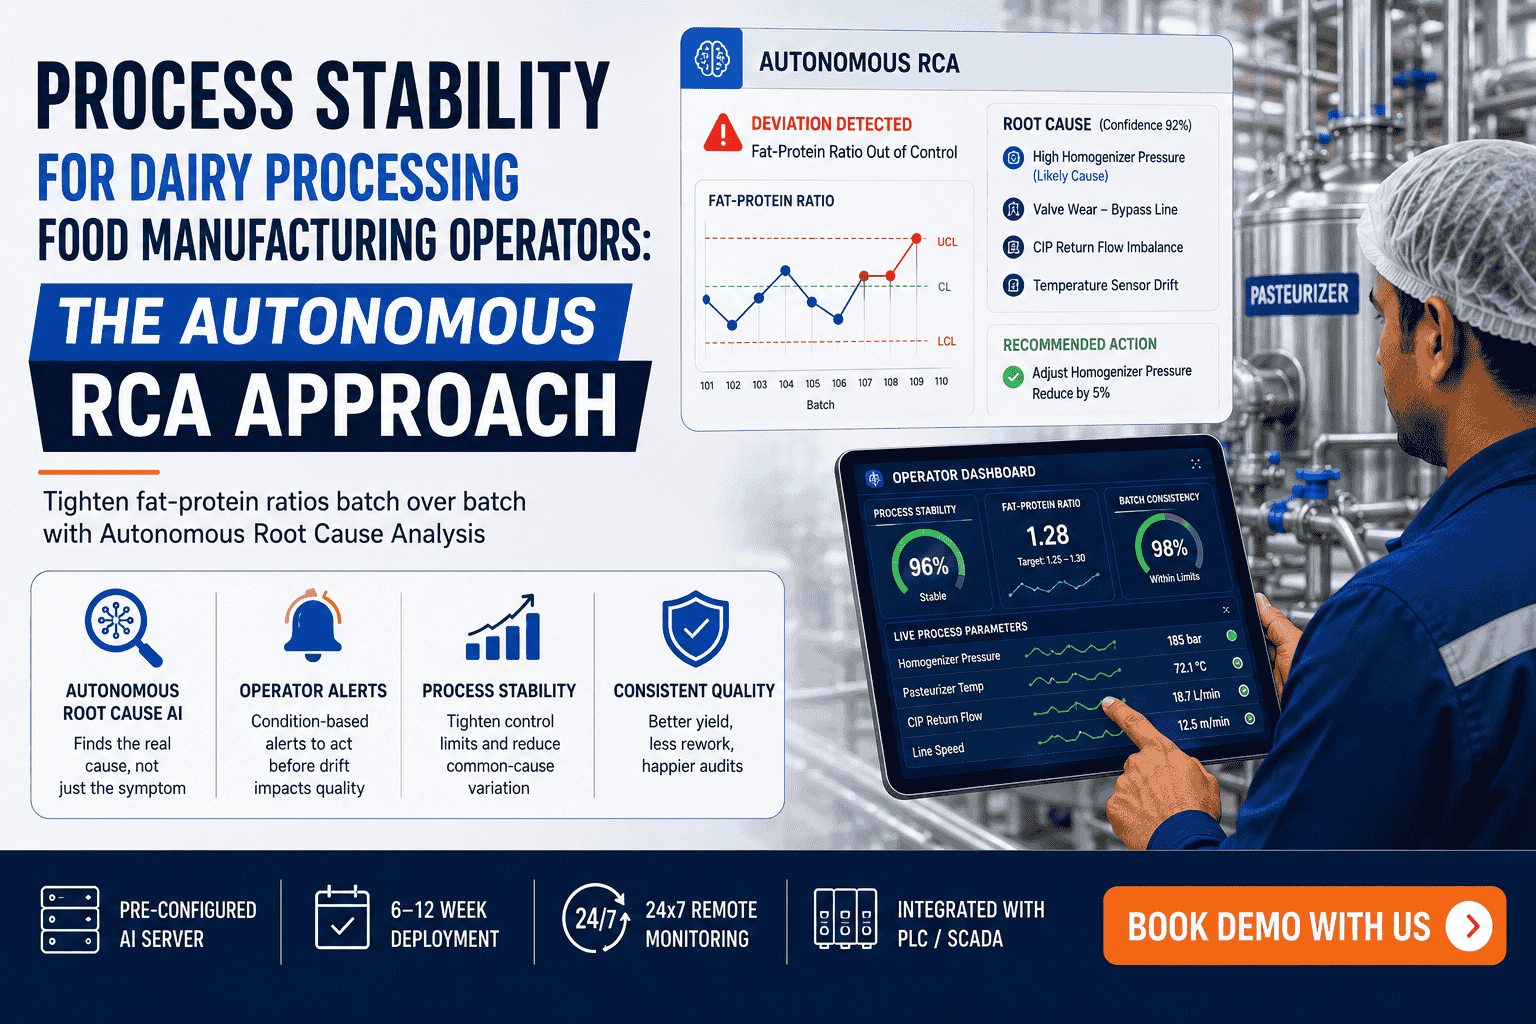
Fat-protein ratio
Standardization drift causes giveaway or downgrade. Single-variable SPC misses ratio shifts entirely.
+1.5–2.5 pts
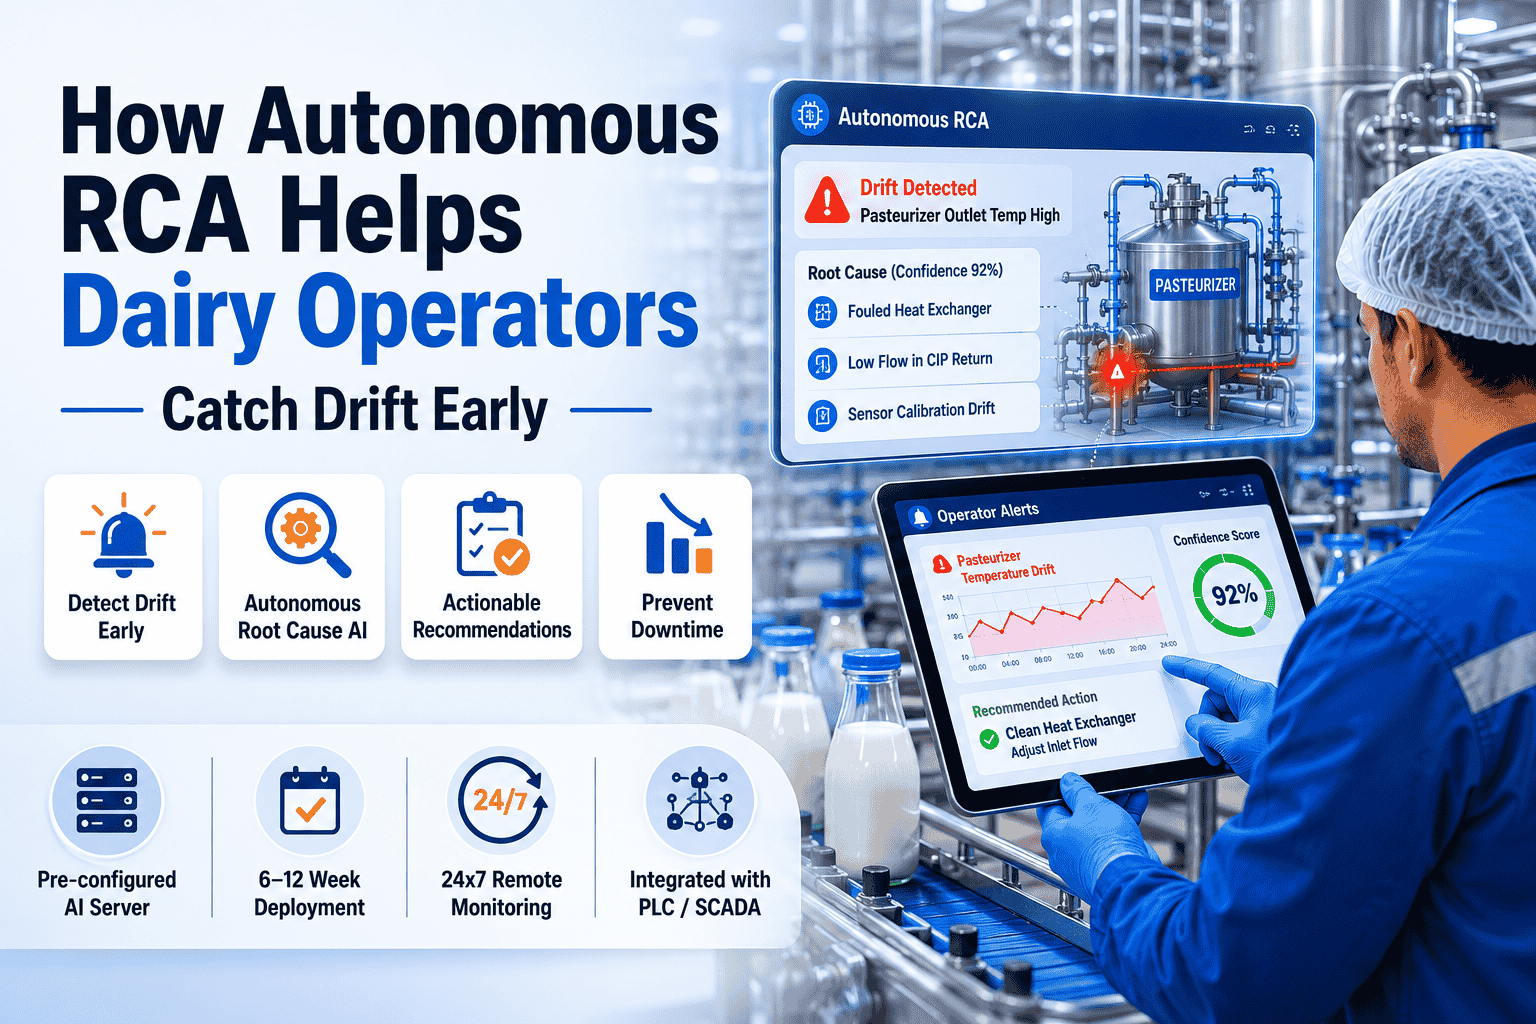
Pasteurizer hold-tube temp
Wobble triggers diversion. Continuous I-MR chart catches drift in seconds.
+0.8–1.5 pts
Homogenizer pressure stability
Pressure drift impacts fat globule size and downstream stability.
+0.6–1.2 pts
Filler nozzle variance
Overfills become giveaway, underfills become reject. P-chart catches per-head drift.
+0.5–1.0 pts
CIP rinse-out consistency
Carryover contamination forces batch downgrade. Continuous conductivity monitoring.
+0.4–0.8 pts
Combined FPY lift
When all five run under AI-native SPC simultaneously
+4–8 points
The Operator’s Daily Loop with AI-Native SPC
Nothing dramatic changes about the operator’s physical day. What changes is what each part of the loop produces. The morning briefing has data. The shift run has trustworthy alerts. The handover has forward-looking context for the next operator. Here’s the day-in-the-life shift.
06:00
Shift Brief
Yesterday’s Cpk and Ppk numbers, top 3 parameters trending, expected risk windows for today’s product mix — all auto-generated from the SPC layer.
06:00–14:00
Run Mode
Rule violations appear on HMI with prescriptive action. Operator acts; AI watches result; pattern is logged for next shift’s context.
13:45
Pre-Handover Summary
Auto-generated shift summary — rule violations resolved, corrective actions taken, parameters trending into next shift. No paperwork chase.
14:00
Handover & Forecast
Next operator gets context-rich handover with forecast for their shift. Defensive explanations become forward-looking briefings.
From SPC by Memory to SPC by AI in 6–12 Weeks
iFactory ships a pre-configured AI server tuned for dairy SPC — eight Nelson rules running against every CTQ signal, auto-chart selection, continuous baseline learning, and multivariate correlation. 6–12 week deployment with no rip-and-replace of your PLC or SCADA.
The Documented Impact — Numbers That Hold Up in the Plant Manager Meeting
AI-native SPC isn’t a hypothesis on dairy lines — it’s a documented operating reality. The headline numbers below come from manufacturing deployments across food & beverage and broader process industries running AI-powered SPC platforms.
37%
defect rate reduction
22%
throughput improvement
4–8 pts
first-pass yield lift
6–8 wk
to first validated alerts
24x7
monitoring without operator load
Want these numbers benchmarked against your line? Book a yield demo and we’ll model the lift from your own historian data.
Expert Perspective
"The original 1924 promise of statistical process control was that the operator would trust the chart, act on real signals, and ignore everything else. For most of the last century, that promise broke against the practical impossibility of one person manually evaluating eight pattern rules against dozens of signals across a moving shift. AI-native SPC finally delivers what Shewhart designed and what Nelson refined. The eight rules now run continuously, the chart updates itself, and the operator gets back to what humans do best — judgment on the edge cases the algorithm flags. That’s where the 4–8 point yield lift comes from. The math hasn’t changed in a century. The discipline of actually running it has."
— Dairy Manufacturing Quality Practice, 2026 industry insight
1924
year Walter Shewhart invented control charts at Bell Labs
8
Nelson pattern rules now applied continuously by AI
20–25
subgroups needed to establish a reliable SPC baseline
Conclusion: The Chart Finally Catches Up to the Math
Shewhart drew the first control chart by hand in 1924. Nelson published the eighth rule in 1984. For the forty years between then and now, dairy operators have been doing the math by memory — watching for trends, counting points on the same side of the mean, mentally evaluating whether a run was real or random. AI-native SPC isn’t a new theory. It’s a hundred-year-old theory finally implemented at the speed and scale the equipment always demanded. The eight Nelson rules run continuously. The chart selects itself. The baseline updates with the season. The signals get ranked by impact. And the operator does what they were always meant to do — judgment on the edge cases, hands on the line, eyes on the product. That’s where the 4–8 yield points come from. Book a demo with us to see it on yours.
Bring AI-Native SPC to Your Dairy Line
iFactory’s dairy practice deploys AI-native SPC in 6–12 weeks against your existing PLC and SCADA — eight Nelson rules, auto-chart selection, multivariate correlation, prescriptive operator alerts. Get a free working session built around your line.
Frequently Asked Questions
What is AI-native SPC for dairy processing?
AI-native SPC is statistical process control software that automates every step of the SPC workflow on a dairy line — auto-selection of the correct chart type per signal, continuous baseline learning, parallel evaluation of all eight Nelson rules against every critical-to-quality parameter, multivariate correlation between related signals, and prescriptive operator alerts with the corrective action attached. Unlike legacy SPC tools that require manual chart configuration and post-event analysis, AI-native SPC runs the eight Nelson rules in real time on every shift, surfacing only the pattern violations that actually matter. Plants using this approach typically achieve 4–8 point first-pass yield lifts, 37% defect rate reduction, and 22% throughput improvement.
How does AI-native SPC differ from the SPC software we already have?
Legacy SPC software typically requires manual setup per parameter — an engineer picks the chart type, sets the control limits during commissioning, defines which Nelson rules to monitor, and configures alarm thresholds. From that point on, the limits are static, the rule evaluation is partial, and the chart only updates when someone refreshes it. AI-native SPC removes every manual step: chart selection is automatic from data structure, control limits recalculate continuously from live data, all eight Nelson rules evaluate against every signal in parallel, and multivariate correlations between signals are tracked — not just isolated single-variable charts. The operator interface looks similar; what runs underneath is fundamentally different.
Which Nelson rules actually matter most on a dairy line?
Rule 1 (single point beyond 3σ) catches the obvious outliers and has historically been considered sufficient for most cases by quality experts. But on a continuous-flow process like dairy, the subtler rules deliver more value: Rule 2 (nine points same side of mean) catches process shifts that stay inside ±3σ but reflect real drift, Rule 3 (six points trending) catches gradual fouling or wear, Rule 5 (two of three points beyond 2σ) catches early-stage drift before Rule 1 fires. The honest answer is that on a dairy line where eight signals interact, applying all eight rules simultaneously is what makes the difference — not picking a few favorites. That’s exactly the work AI-native SPC was built to do.
Do we need to replace our PLCs, SCADA, or MES to deploy this?
No. iFactory’s AI-native SPC platform sits above your existing controls stack and reads data over standard industrial protocols. PLCs continue to run the control logic. SCADA continues to display alarms, alarms, and trends. MES continues to track production. The AI layer ingests historian data, applies the eight Nelson rules continuously, runs multivariate correlation, and pushes prescriptive alerts back to the operator HMI or mobile devices. No control loops are touched, no compliance documentation changes, and no operator retraining on the controls layer is needed. Deployment runs 6–12 weeks with first validated alerts typically arriving within 6–8 weeks.
How much operator training is needed for AI-native SPC?
Light. A 60–90 minute walkthrough plus shift-side support during the first week of live operation is typical. The reason is that nothing about the operator’s physical workflow changes — the HMI stays where it is, the corrective actions are still executed by the operator, the shift schedule still owns the line. What changes is what the chart on the screen actually means and what the morning briefing contains. Most operators adapt within their first shift because the alerts they receive are no longer false alarms requiring mental override — they’re trustworthy signals with actions attached. By week four to six, the playbook is fully internalized and the 4–8 point yield lift starts showing on the weekly summary.