OEE on a dairy line is a fragile number. One slow homogenizer changeover, a fifteen-degree wobble on the HTST hold tube, a single filler nozzle drifting half a gram — and your shift OEE drops three points before you finish your second coffee. The frustrating part isn’t the drop. It’s that almost every cause is predictable thirty to ninety minutes before it bites the metric. Predictive OEE flips the operator’s job: instead of explaining yesterday’s number on the morning huddle, you walk in already knowing what’s about to threaten today’s number — and exactly which play in your playbook stops it. This is that playbook: five plays for the five most common OEE killers on a dairy line, the AI signals that trigger each one, and the prescriptive action that protects the run. Book a demo with us to see your line’s plays modeled on your historian data.
Forecasted shift OEE (with intervention)
79%
Projected if no action taken
68%
Why Dairy OEE Is Harder Than Most Manufacturing Lines
Discrete manufacturers fight OEE in clean variables — cycle time, scrap rate, planned vs unplanned downtime. Dairy operators fight it in a swirl of fluid dynamics, microbial windows, and equipment chemistry that changes from one batch to the next. Five forces drag the number down disproportionately on dairy lines, and they almost always show up in the same order on the shift summary.
1
Homogenizer pressure drift
Performance hit: 4–8 pts
Single or two-stage homogenizers running at 200–300 bar are positive displacement — capacity only adjusts via motor speed or pulley size, so any wear shows up immediately as pressure variance.
2
HTST hold-tube wobble
Availability hit: 3–6 pts
HTST requires 72–75°C held for 15–20 seconds. Temperature wobble triggers automatic flow diversion — one of the most common unplanned mini-stops on dairy lines.
3
CIP overrun & carryover
Availability hit: 3–5 pts
CIP cycles that run 10–20 minutes longer than scheduled compound across shifts and quietly destroy availability. Conductivity drift signals it 30+ minutes ahead.
4
Filler nozzle variance
Quality hit: 2–5 pts
Overfills, underfills, and seal failures on filler lines silently erode the quality factor of OEE. Cycle-by-cycle nozzle drift is the leading hidden cost in dairy packaging.
5
Changeover & SKU swap drag
Availability hit: 4–7 pts
Recipe changeovers on multi-product lines extend predictably under specific conditions. AI flags shift-end changeovers most at risk so they can be re-sequenced or pre-prepped.
Want these five killers ranked against your specific line’s OEE losses? Book a 30-minute working session with our dairy specialists.
The Operator’s Playbook — 5 Plays for 5 OEE Killers
Each play follows the same three-beat structure: the signal that triggers it, the action that resolves it, and the OEE points you protect. Treat them like baseball signs — the AI gives you the call, you execute the play, the shift number holds.
The Pressure Lock
Signal
AI detects piston pressure curve deviating from baseline by 6–12 bar over 8 minutes — before the SCADA alarm threshold trips.
Action
Step-change motor speed by recommended delta, schedule piston seal inspection in next planned stop, log event for handover.
Saves
4–8 OEE points on Performance — prevents flow control diversion and downstream HTST instability.
The Hold Stabilizer
Signal
Hold tube temperature trending below 72.5°C with predicted breach in 4–7 minutes. Diversion imminent if uncorrected.
Action
Adjust regenerator bypass per AI recommendation, verify steam supply pressure, hold incoming feed rate steady for 6 minutes.
Saves
3–6 OEE points on Availability — avoids forced diversion and prevents the cascade restart through the regenerator.
The Clean Sweep
Signal
Conductivity rinse-out curve flattening; AI predicts cycle will overrun by 12–18 minutes if current trajectory continues.
Action
Increase final rinse flow, verify caustic concentration on next batch, schedule heat-exchanger pre-clean for end of shift.
Saves
3–5 OEE points on Availability — protects the production window for the next batch and eliminates carryover risk.
The Nozzle Trim
Signal
Statistical drift on weight cells of one filler head; AI forecasts 50+ overfilled units in next 20 minutes if uncorrected.
Action
Trim individual nozzle setpoint by recommended delta, check seal integrity on flagged head, log for end-of-shift inspection.
Saves
2–5 OEE points on Quality — eliminates the silent FPY loss that historically only shows up on weekly waste reports.
The Swap Ready
Signal
AI flags scheduled changeover at risk — recipe complexity, current shift fatigue patterns, and CIP timing all point to extended swap.
Action
Pre-stage parts and tooling at the line, request second operator assist, run pre-CIP flush to compress the critical path.
Saves
4–7 OEE points on Availability — the single biggest controllable lever on multi-SKU dairy lines.
See your plays
Build your own playbook on your data
In a 30-minute working session we’ll surface the 5 highest-impact plays for your specific dairy line — calibrated against your historian.
Book a Demo with Us
From OEE Surprise to OEE Forecast in 6–12 Weeks
iFactory ships a pre-configured AI server tuned for dairy processing — pasteurizer, homogenizer, separator, filler, CIP. Integrates with your PLC and SCADA over standard protocols, delivers first validated alerts within 6–8 weeks, and runs 24x7 in the background while operators stay on the line.
The OEE Math — What Each Play Actually Moves
OEE is the product of three factors, not the average. That changes the math entirely — a small Availability gain compounds against Performance and Quality at the same time. Here’s how each play stacks against the three-factor formula and where the leverage actually sits.
Factor
Definition
Plays that move it
Typical baseline
After predictive OEE
Availability
Run time / Planned production time
Plays 02, 03, 05
82–87%
88–93%
Performance
Actual rate / Ideal rate
Play 01
88–92%
93–96%
Quality
Good units / Total units (FPY)
Play 04
94–97%
97–99%
OEE
A × P × Q
All 5 plays
68–78%
80–85%
What the Shift Handover Looks Like Now
The most underestimated change predictive OEE delivers isn’t a number on a dashboard. It’s what the shift handover sounds like the next morning. The CAPA chase, the “why did OEE drop last night” conversation, the operator defending their shift — all of that gets replaced by a forward-looking briefing.
Before
Reactive Handover
"OEE dropped to 71%."
"Not sure why — QA hasn’t come back yet."
"Homogenizer felt off around 02:00."
"You’ll have to wait for the morning report."
After
Forecast Handover
"OEE finished 81% — on forecast."
"Ran Play 01 on H-02 at 02:14 — saved 5 pts."
"CIP-03 flagged for inspection at next stop."
"Your shift forecast is 79% — watch filler F-04."
Want the shift handover to sound like the right-hand column on your line? Book a 30-minute walkthrough with our dairy specialists.
How It Plugs Into Your Plant — Without Replacing Anything
Predictive OEE on a dairy line doesn’t require ripping out your existing controls. The pre-configured AI server reads your PLC and SCADA over standard protocols, ingests data from your existing HTST, homogenizer, filler, and CIP loops, and runs predictive models in the background. Operators see alerts on the HMI they already use. Maintenance sees forecasts on whatever tablet or mobile they already carry.
6–12
weeks
From kickoff to operators receiving validated OEE forecasts
24x7
always-on
Continuous monitoring with no operator dashboard fatigue
0
capital required
Uses your existing PLCs, SCADA, sensors, and inline analyzers
5–15
min lead time
Typical predictive window between AI alert and avoided OEE loss
Expert Perspective
"The dairy operators we work with don’t want another dashboard. They want fewer surprises. Predictive OEE on a dairy line gives them what their plant manager has been asking for — consistent shift numbers — while giving the operator something more important: control of the run, not reaction to it. Plants using AI-driven quality and OEE prediction routinely report 10% throughput improvements and 25% higher yield compared to manual systems. Those aren’t projections. They’re the measurable outcome of moving the operator from spectator to driver of the OEE number."
— Dairy Manufacturing AI Practice, 2026 industry insight
10%
throughput improvement from AI quality prediction models
25%
higher yield using AI-automated dairy lines by 2026
85%
world-class OEE target for dairy processing lines
Conclusion: The Shift That Knows What’s Coming
A dairy operator running a line in 2026 doesn’t need more training, more dashboards, or more KPIs. They need an AI co-pilot that watches the homogenizer pressure curve, the HTST hold tube, the CIP conductivity rinse-out, and the filler weight cells continuously — and hands them the right play at the right moment. Five plays, five OEE killers, one quieter shift. The math is the same multiplication formula it’s always been. The difference is that Availability, Performance, and Quality all start moving up together when the operator stops being the last to know what’s drifting and becomes the first. The plants where OEE consistently lands at 80%+ in 2026 are the ones running this playbook in the background every shift. Book a demo with us to see it on yours.
Bring the Playbook to Your Dairy Line
iFactory’s predictive OEE platform deploys in 6–12 weeks against your existing PLC and SCADA — pre-configured for HTST, homogenizer, separator, filler, and CIP. See your line’s top 5 plays surfaced in a single working session.
Frequently Asked Questions
What is predictive OEE for dairy processing?
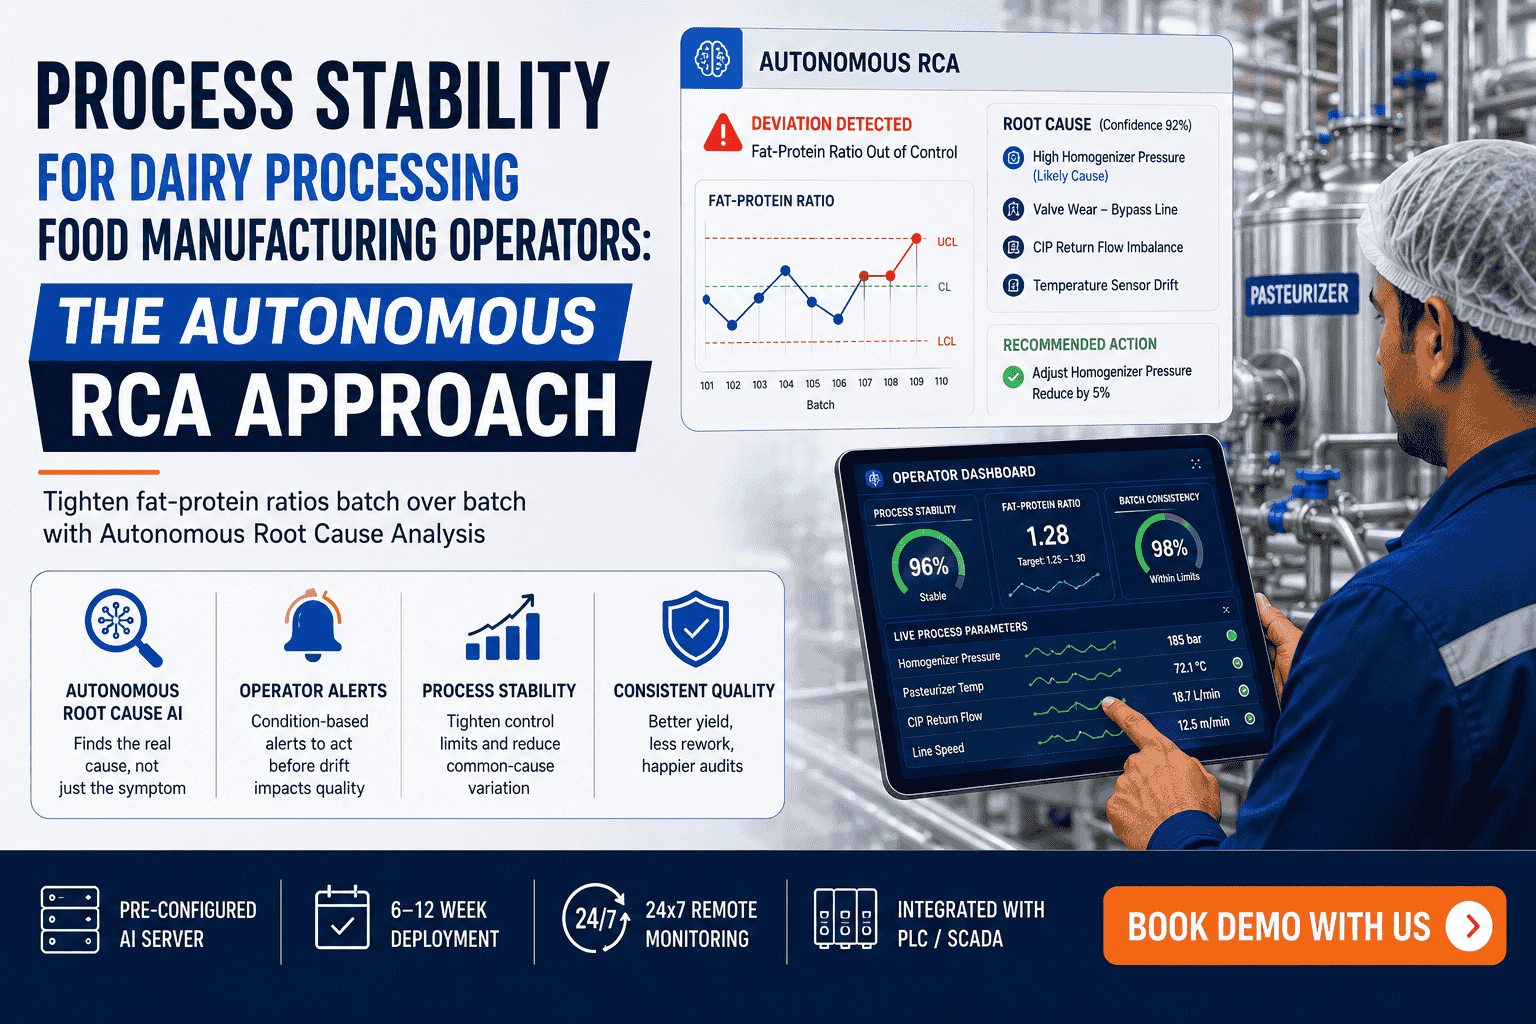
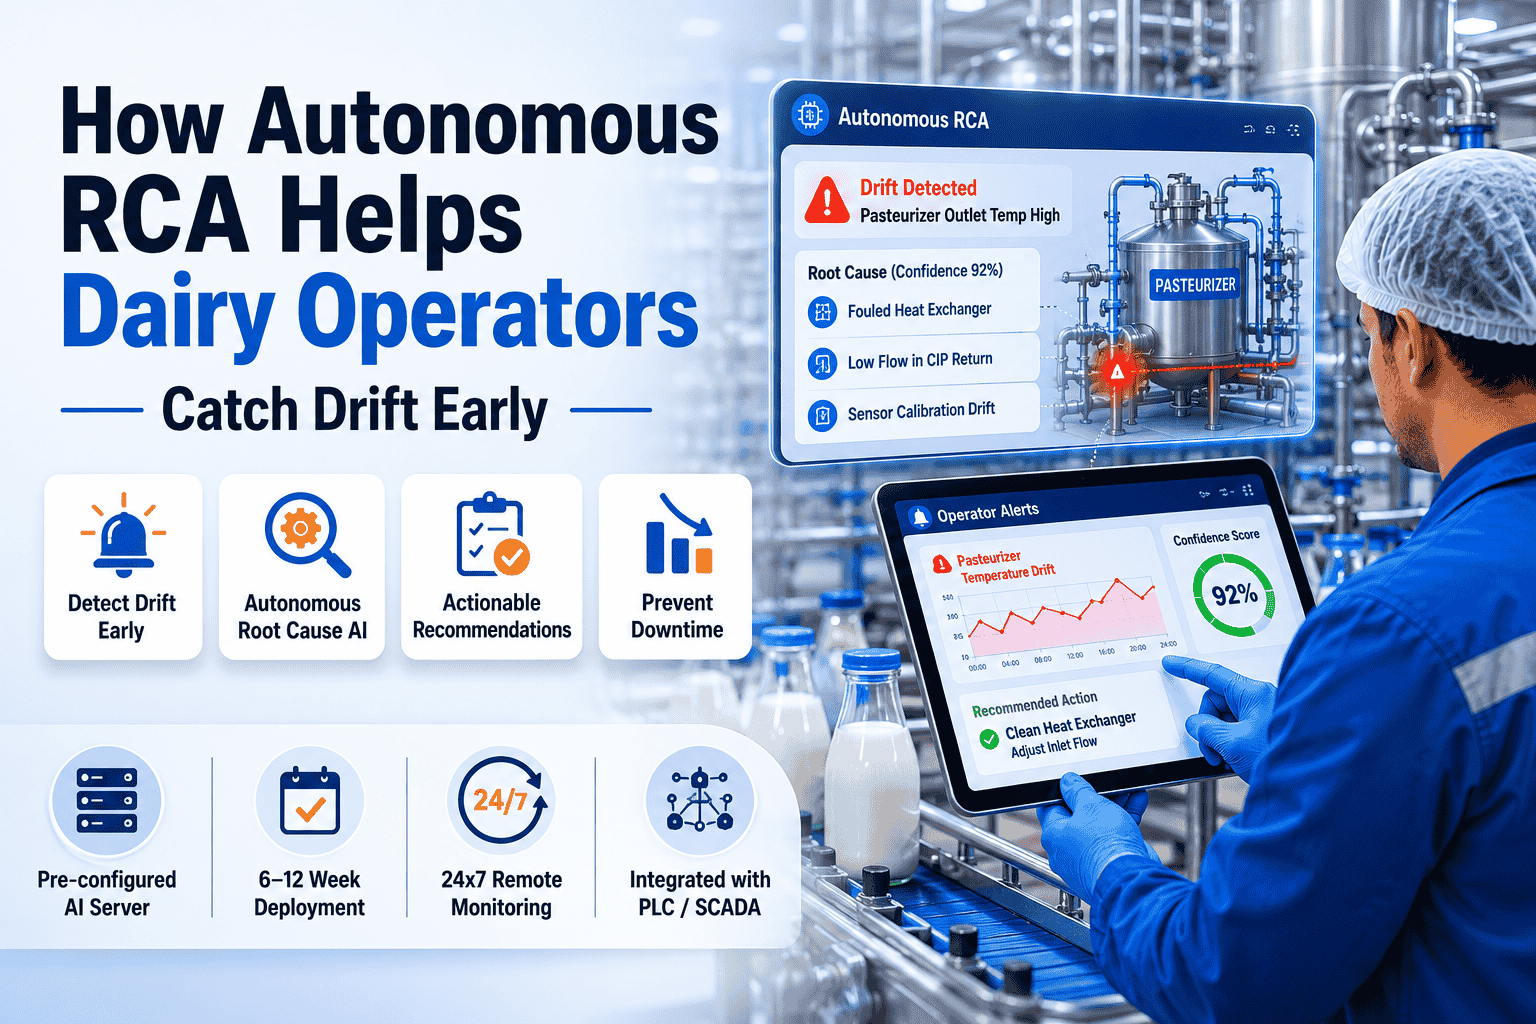
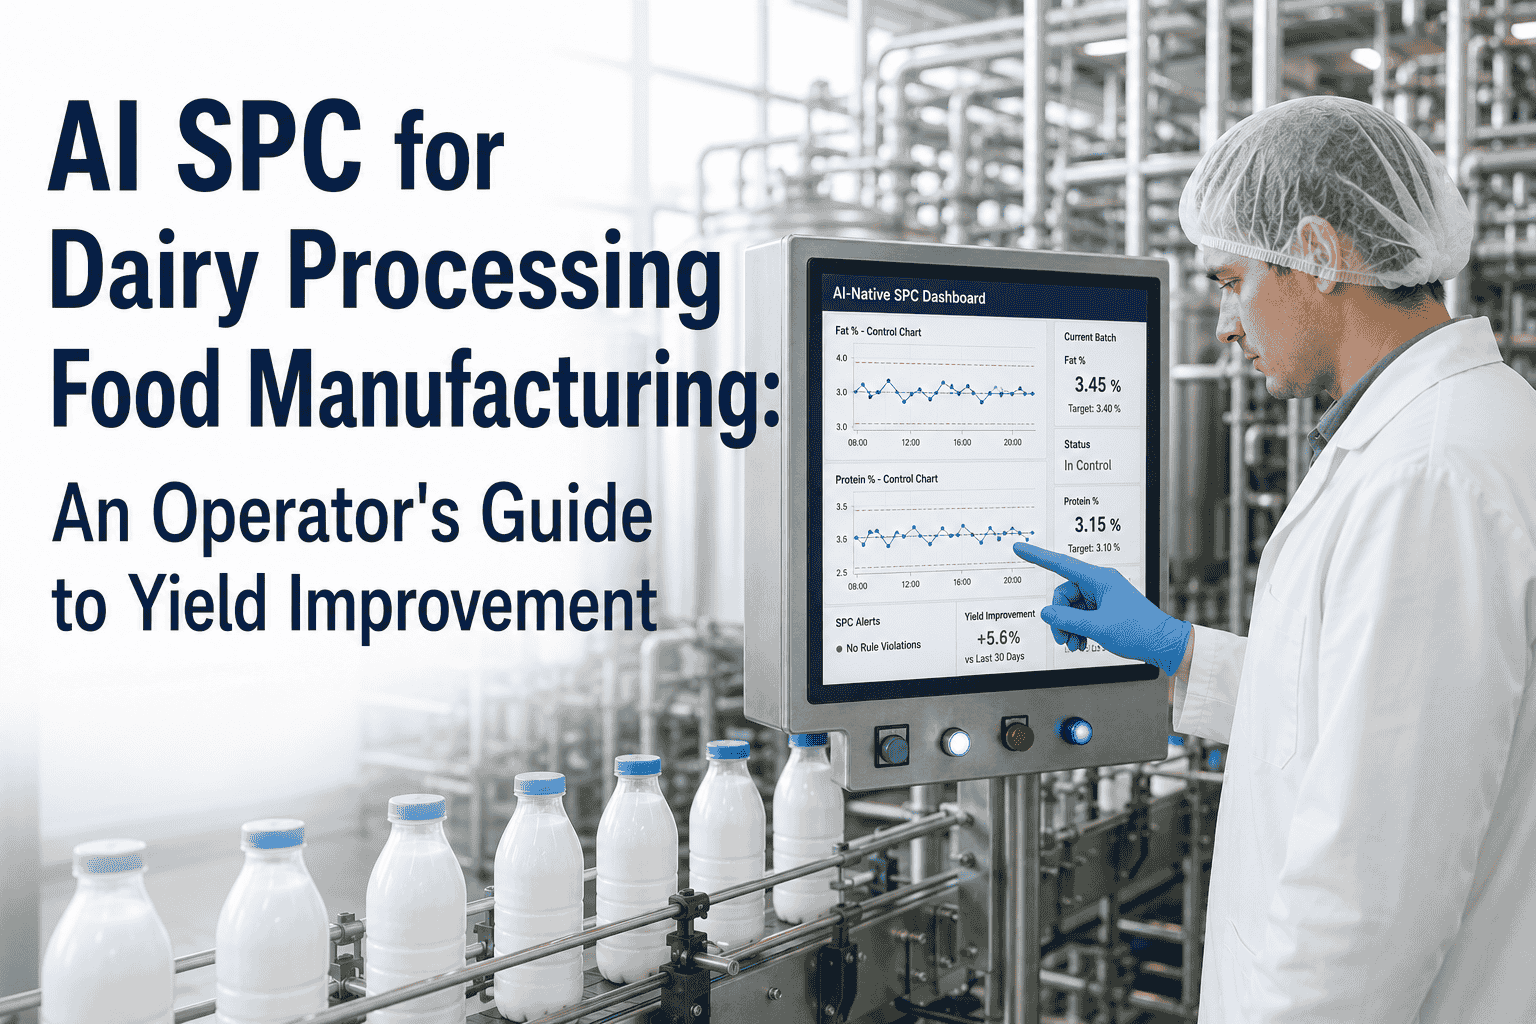
Predictive OEE is AI software that continuously monitors dairy line data from PLCs, SCADA, inline analyzers, and historians to forecast where Availability, Performance, and Quality will land at end-of-shift — and surface prescriptive actions to operators 5–15 minutes before drift becomes loss. It tracks the five common OEE killers on dairy lines — homogenizer pressure drift, HTST hold-tube wobble, CIP overrun, filler nozzle variance, and changeover drag — and gives operators a play-by-play set of corrective actions instead of post-shift explanations. Plants using this approach typically lift OEE from a 68–78% baseline into the 80–85% world-class range.
How does predictive OEE actually save the OEE number on a shift?
The math is the multiplication formula every operator knows: Availability × Performance × Quality. The five plays target each factor individually. Plays 02 (HTST stabilization), 03 (CIP cycle), and 05 (changeover) move Availability from 82–87% to 88–93%. Play 01 (homogenizer pressure) moves Performance from 88–92% to 93–96%. Play 04 (filler nozzle trim) moves Quality from 94–97% to 97–99%. Because the three factors multiply, small gains compound. A line that historically ran at 73% OEE typically lands at 82–83% within the first quarter of disciplined playbook use.
Do we need new sensors or new equipment to deploy predictive OEE?
No, in most cases. iFactory’s predictive OEE platform reads from your existing PLCs, SCADA, sensors, and inline analyzers using standard industrial protocols. Pasteurizers, homogenizers, separators, fillers, and CIP loops already stream the data the AI models need. The only time additional sensors are recommended is when a critical asset (typically an older HTST or homogenizer) has data gaps that prevent confident prediction — in which case targeted retrofit IIoT sensors are added in 1–2 days per asset without shutdowns. Most plants reach validated OEE forecasts within 6–8 weeks of go-live with no capital equipment investment.
How does this work alongside our PLC, SCADA, and HMI?
It sits above all three as an independent intelligence layer. PLCs continue to run the control logic exactly as they do today. SCADA continues to display the same alarms and trends operators are already trained on. The HMI gets a small new banner area where predictive OEE alerts and play recommendations appear, plus mobile push alerts for shift leads and maintenance. Nothing in the control loop, alarm hierarchy, or compliance documentation changes. Operators see incremental information — not a new platform replacing what they already know.
What does deployment and operator training look like?
Deployment runs 6–12 weeks. The first 2–3 weeks cover PLC and SCADA integration and historian ingest. The next 4–6 weeks are model calibration against 6–8 weeks of your historian data, with dairy-specific pre-configured templates accelerating most of this work. The final 2–4 weeks are alert threshold tuning with your operator team to eliminate false positives. Operator training is light by design — typically a 90-minute walkthrough plus shift-side support during the first week of live alerts. The five-play playbook is intentionally short because operators retain it. Most plants see operators independently executing all five plays by week 10–12 of deployment.