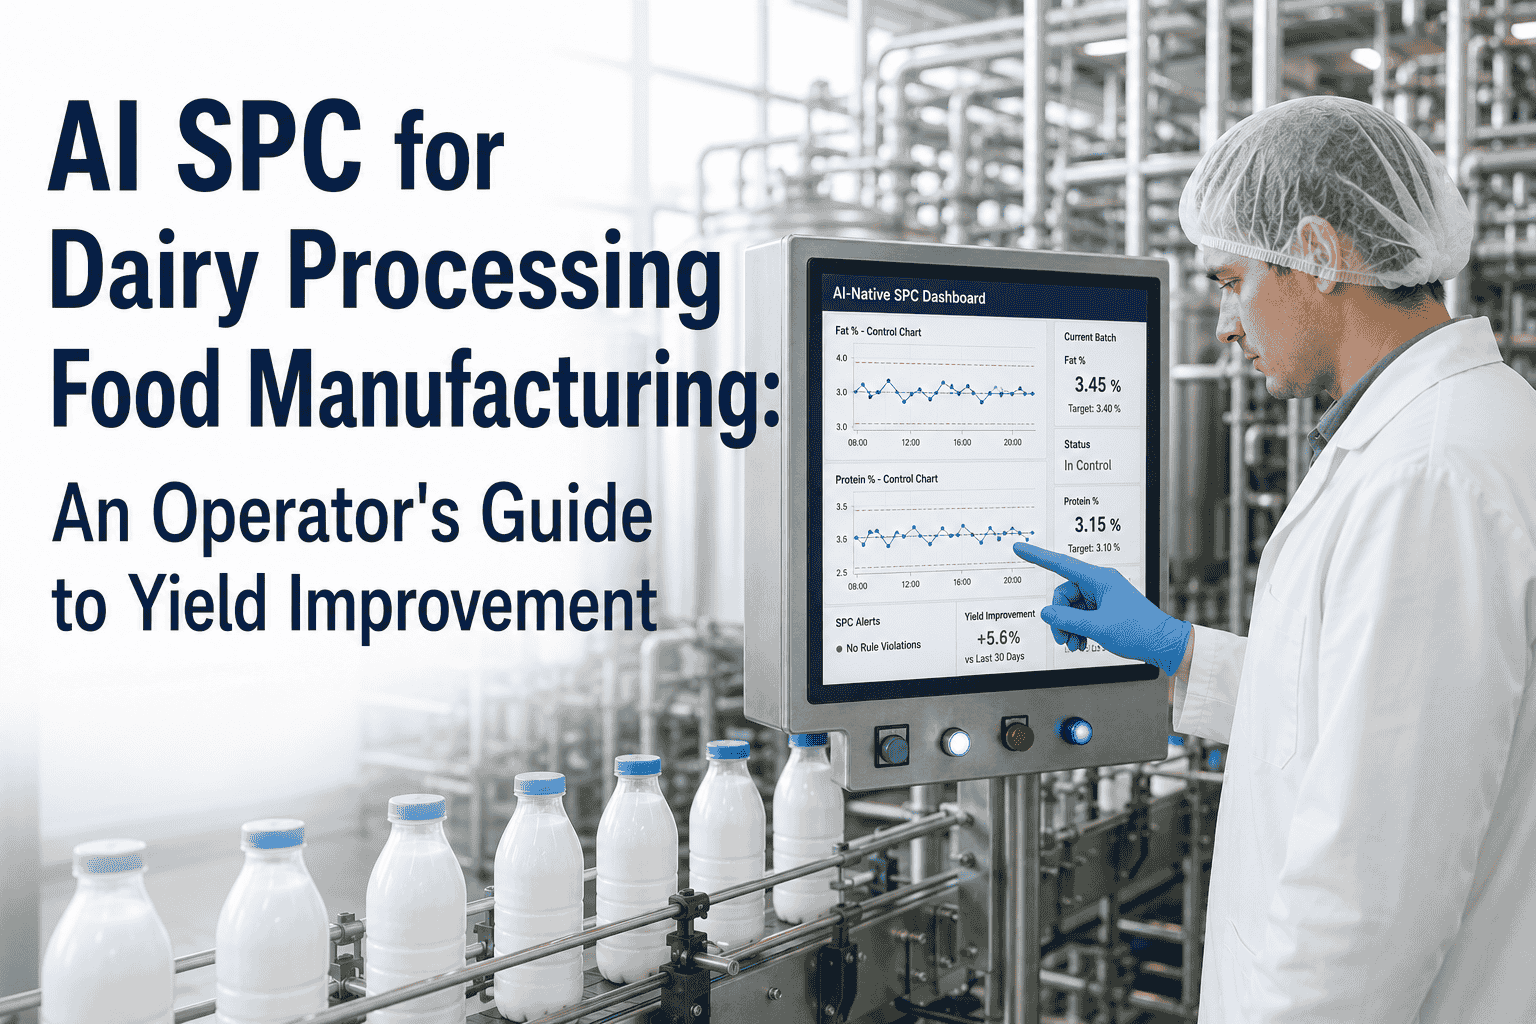
Walk into a dairy plant in 1985 and you’d find a paper SPC chart taped to the wall next to the pasteurizer, an operator filling in dots with a pencil between batch samples, and a quality engineer doing the Cpk math by hand on Friday afternoons. Walk into the same plant in 2026 and the chart is still there — but the dots are auto-plotted from real-time sensors, the Cpk number recalculates every shift, five diagnostic agents run continuously in the background and the 5-Why investigation that used to take a week now completes itself in seconds. Forty years of SPC evolution have compressed into four generations of tooling. This guide walks an operator through every generation — what changed, why it changed, and what becomes possible at the autonomous RCA layer that wasn’t possible at any of the three before it. The destination matters most: a dairy line where chronic out-of-spec SKUs that have sat at Cpk 0.8–1.0 for years finally climb past 1.33, and the operator stops being the person who chases variation and becomes the person who confirms the AI caught it. Book a demo with us to see autonomous RCA running on your chronic SKUs.
G1 · 1980s–2000s
Paper SPC
Cpk reviewed weekly
G2 · 2000s–2010s
Digital SPC
Cpk reviewed daily
G3 · 2015–2024
AI-Assisted SPC
Cpk live, alerts manual
G4 · 2026
Autonomous RCA
Cpk lifted autonomously
Generation 1: Paper SPC — The Foundation Everything Else Builds On
The first generation of SPC on dairy lines did the math by hand. Shewhart’s 1924 control chart, Western Electric’s 1956 rules, Nelson’s 1984 expansion — all of it implemented through paper charts, pencil entries, and quality engineers running Cpk calculations on Friday afternoons. The methodology was sound. The execution was where it broke.
How it worked
Operator pulls a sample every 30–60 min. QA lab runs the test. Result handwritten onto the chart. Engineer calculates Cpk weekly.
Strengths
Established the methodology. Operators learned to read patterns. The discipline of plotting itself drove engagement.
Limitations
30–90 min latency between event and chart. One operator’s skill = one chart. RCA done forensically after the fact.
Generation 2: Digital SPC — Same Methodology, Faster Loop
The second generation moved the pencil into a database. Inline sensors, automated data entry, and SPC software made the chart auto-plot. The methodology stayed identical — same Western Electric rules, same Cpk formula, same control chart logic — but the loop tightened from weekly to daily. Operators got their first taste of real-time process visibility. The forensic RCA didn’t go away. It just got faster.
How it worked
Inline sensors stream data to SPC software. Charts auto-plot. Static control limits set during commissioning. Daily Cpk roll-up.
Strengths
Latency dropped from 90 min to under 15. Charts always current. Quality engineering had real data to investigate with.
Limitations
Static limits drifted out of calibration over years. False alarms during normal startup. Single-variable view missed multivariate causes.
Generation 3: AI-Assisted SPC — Detection Got Smarter; Action Stayed Manual
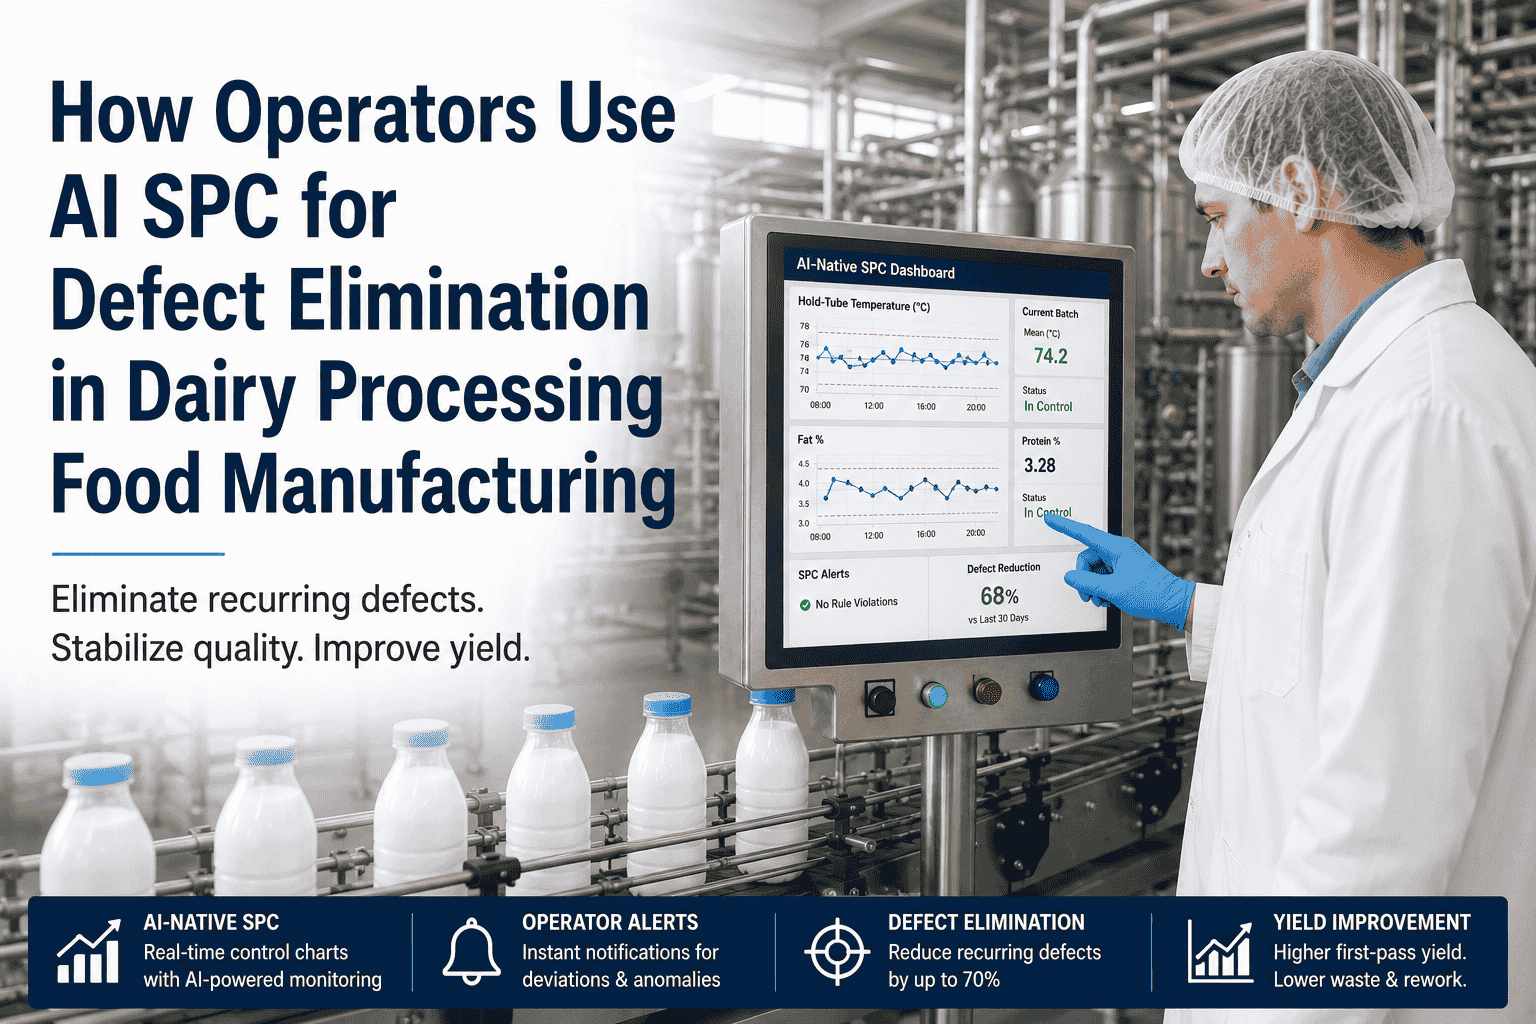
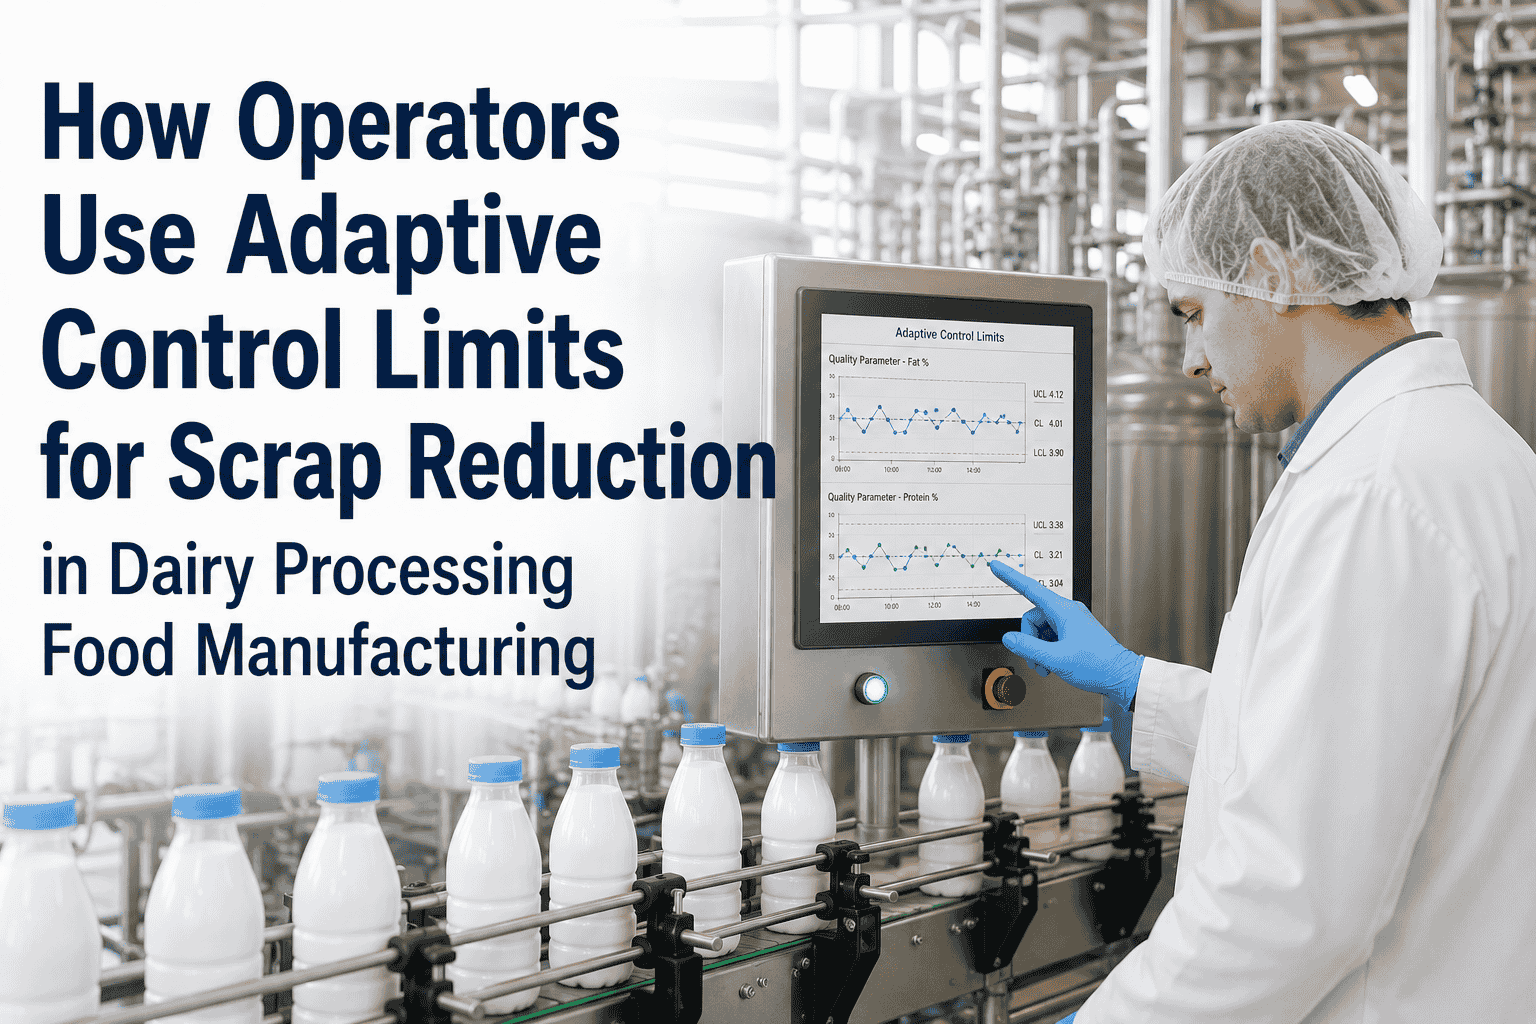
The third generation added AI as an overlay. Anomaly detection algorithms could spot patterns operators missed. Adaptive control limits replaced the static ones. Multi-variable correlation surfaced relationships single-variable charts couldn’t see. But the workflow was still operator-driven: AI flagged the anomaly, operator interpreted it, operator investigated the cause, operator decided on a fix. Better detection, same forensic RCA at the end.
How it worked
AI overlay watches sensor streams continuously. Adaptive limits replace static ones. Multivariate correlation finds patterns. Cpk calculated live.
Strengths
5–15 min lead time before defects form. Eight Nelson rules running automatically. False alarms drop. Chronic SKUs get diagnosed.
Limitations
AI flags the anomaly — the operator still does the RCA. 5-Why investigation manual. Knowledge lives in one operator’s head.
Generation 4: Autonomous RCA — The Investigation Comes Pre-Done
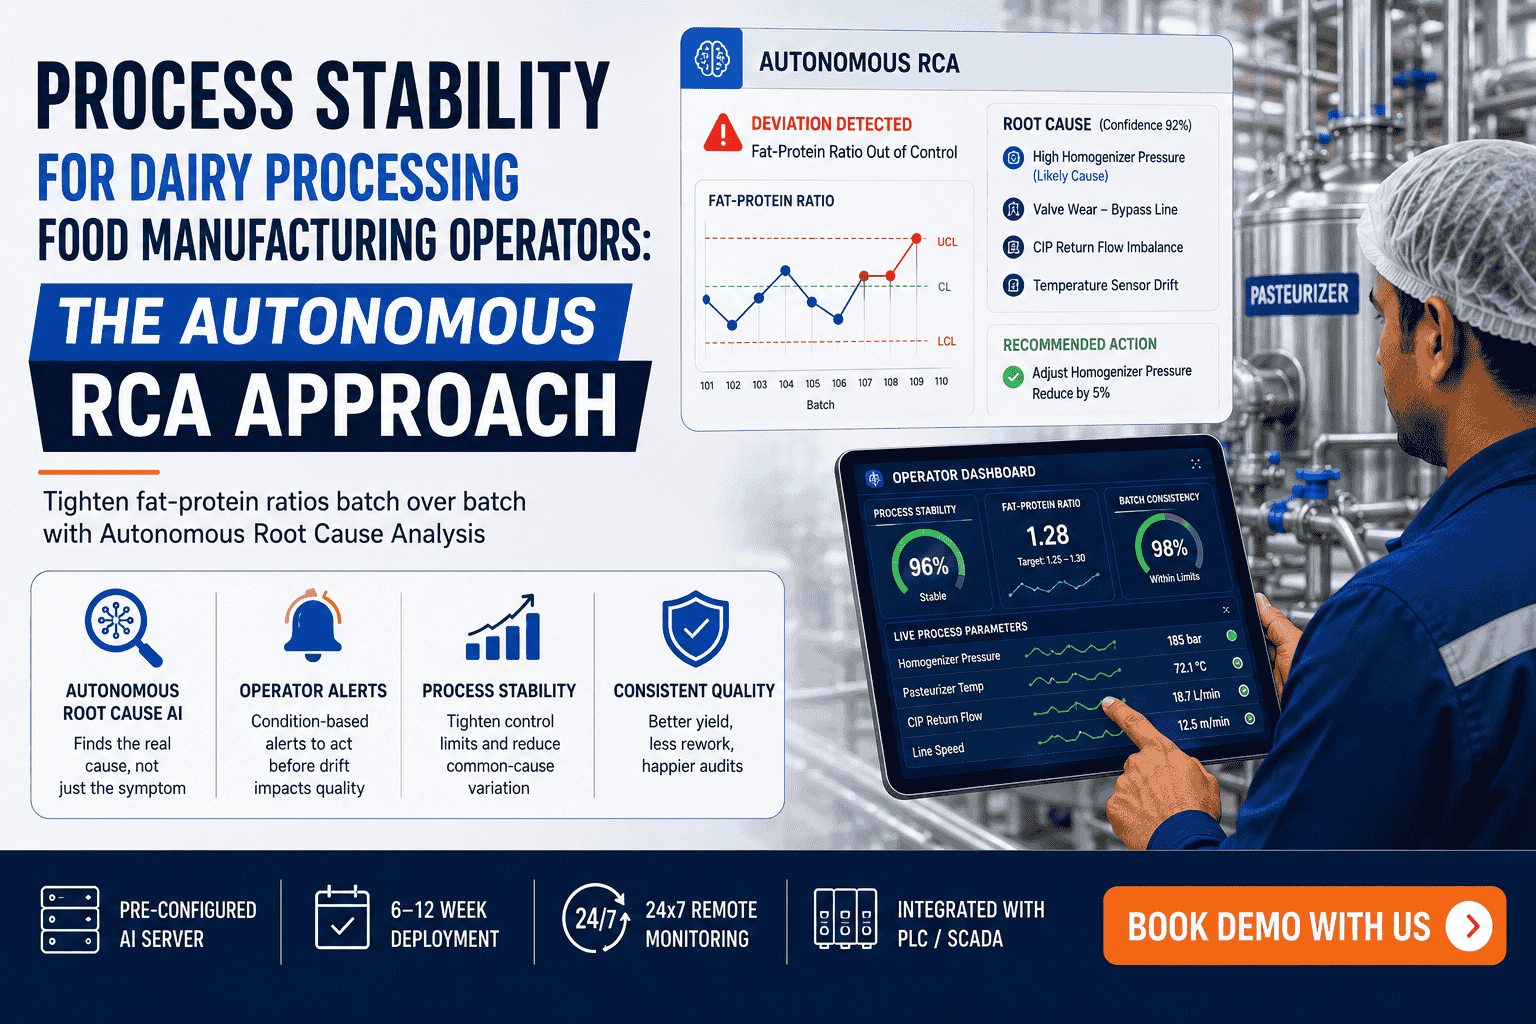
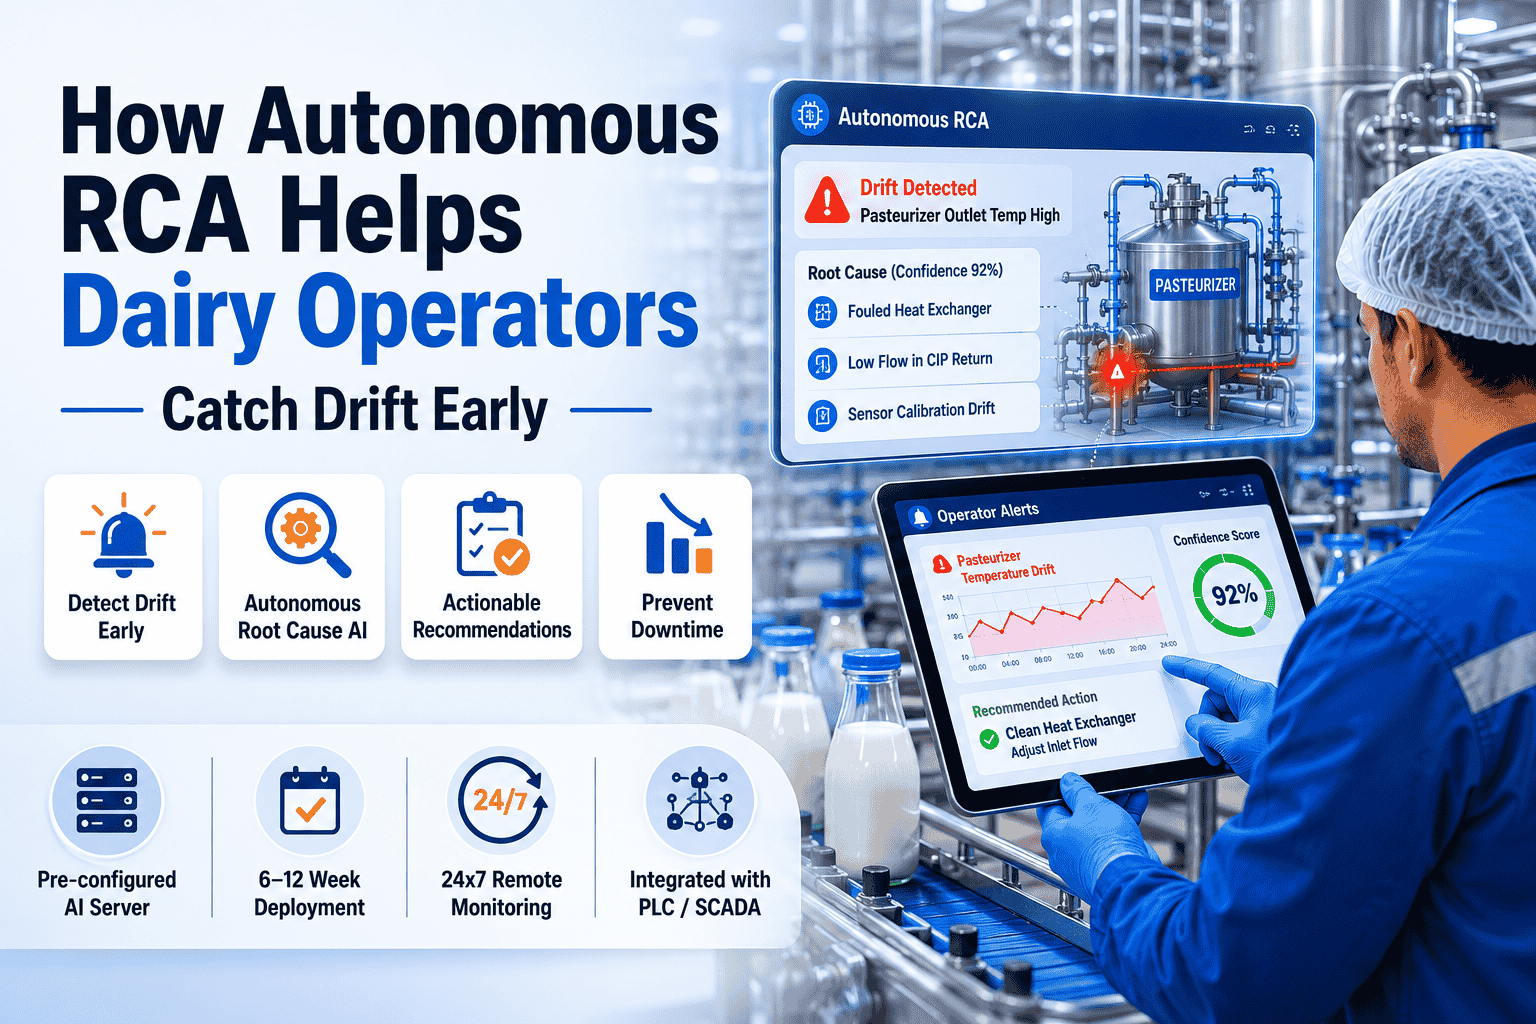
The fourth generation closes the loop that the first three left open. Five diagnostic agents replace the operator’s mental decision tree: one detects the anomaly, one generates causal hypotheses, one validates evidence, one prescribes the action, one captures the outcome. By the time the alert reaches the HMI, the entire 5-Why investigation is already complete — with a ranked root cause, confidence score, and corrective setpoint attached. The operator’s job becomes execution and edge-case judgment. The forensic RCA disappears.
How it works
Five agentic AI diagnostic models run continuously. 5-Why investigation automated. Failure-pattern library self-updates. Cpk lifted autonomously.
Strengths
Investigation already done at alert time. Chronic Cpk 0.8–1.0 SKUs climb past 1.33. Recurrence breaks. Operator confidence rises.
Operator role
Execute prescriptive actions. Judgment on edge cases. Physical confirmation of root cause. Forward-looking shift handovers.
Curious which generation your line is currently running — and what the leap to G4 looks like specifically for your chronic out-of-spec SKUs? Book a generation assessment with our dairy team.
What Changed Across the Four Generations — A Side-by-Side Capability Comparison
The chronological story is intuitive. The capability comparison makes the leap from G3 to G4 concrete. Six dimensions tell the operator exactly what shifts — and what gets retained — as the platform moves from each generation to the next.
Capability
G1 Paper
G2 Digital
G3 AI-Assisted
G4 Autonomous
Data capture
Pencil & sample
Sensor → DB
Sensor → AI
Sensor → AI
Latency
30–90 min
5–15 min
Real time
Real time + 5–15 min lead
Anomaly detection
Manual reading
Threshold alarms
Pattern + ML
Multivariate + adaptive
5-Why investigation
Days, manual
Hours, manual
Minutes, manual
Seconds, automated
Knowledge retention
One operator’s head
Paper CAPA log
Digital CAPA system
Self-updating library
Cpk visibility
Weekly engineer roll-up
Daily QA report
Live operator dashboard
Live + auto-lifted
Cpk in Plain Operator Language — and Why G4 Is Where the Number Actually Climbs
Cpk is the process capability index: how well your line stays inside spec relative to its inherent variation. Cpk 1.0 means you’re right at the edge of fitting. Cpk 1.33 is the industry-standard minimum for FMCG — corresponds to roughly 64 defects per million units. Cpk 1.67 is world-class — 0.6 defects per million. Major retail buyers and standards like BRC Global Standard Issue 9 expect documented Cpk 1.33 minimum on critical parameters. The G1–G3 generations could measure Cpk. G4 is the first generation that actively lifts it.
0.6–1.0
Not capable
Chronic out-of-spec SKUs sit here. Operators add safety margin on every batch. Giveaway is the routine cost.
1.0–1.33
Marginal
Technically meeting spec but inconsistent. Process drift will pull this back to <1.0 within months without intervention.
1.33+
Capable
Industry-standard FMCG minimum. ~64 ppm defect rate. Required by most retail buyers’ technical standards.
1.67+
World-class
~0.6 ppm defect rate. Safety margin against tolerance drift during long production runs. Target for regulated parameters.
The Chronic SKU Story — Where G4 Earns Its Deployment
Every dairy plant has them. The three or four SKUs that have run at Cpk 0.8–1.0 for years. Everyone knows they’re problematic. Multiple improvement projects have been launched and quietly abandoned. The chronic out-of-spec rate has become a budget line item rather than a target. These are exactly the SKUs where autonomous RCA delivers visible impact within the first quarter — because the variation they carry isn’t random, it’s a pattern that no manual investigation has had the bandwidth to fully decode.
Before
Cpk 0.82
14 months without a capability study. 8.2% of output outside internal spec window. £148K/year of invisible cost.
Diagnosis
8 weeks
Autonomous RCA identifies depositor nozzle wear on two heads as the dominant variance source. Targeted maintenance scheduled.
After
Cpk 1.48
Same line, same tolerance, same equipment — lifted to capable Cpk within 8 weeks of autonomous RCA deployment.
Recover Your Chronic SKUs in 6–12 Weeks
iFactory ships a pre-configured AI server tuned for dairy autonomous RCA — HTST, separator, homogenizer, filler, CIP. Integrates with your existing PLC and SCADA, first chronic-SKU diagnosis within 6–8 weeks. Get a free working session focused on your three lowest-Cpk SKUs.
The Operator’s Walkthrough — What Changes Day One of G4
The leap from G3 to G4 is the biggest behavioral change a dairy operator has experienced in the digital era. Five concrete shifts happen the first week of go-live. None of them require new training. All of them produce visible relief on the shop floor.
01
Alerts arrive with the investigation done
No more “something’s wrong, go figure out what.” The HMI banner shows the ranked root cause, confidence score, and recommended setpoint. Read, confirm, execute.
02
Cpk shows on your shift dashboard
The number that used to live in monthly QA reports lives on your screen now. Watch it climb in real time as you execute the day’s corrective actions.
03
Recurring problems stop recurring
The same defect that bit last shift now triggers an alert before it reforms. The failure-pattern library remembers what worked. Your shift inherits yesterday’s solutions, not yesterday’s problems.
04
Handovers become forecasts
The morning huddle stops being a defensive recap. The platform shows the next shift exactly what to watch, what’s trending, what’s at risk. Forward-looking by default.
05
Edge cases become your real work
The pattern-tracking and 5-Why work that consumed shifts goes to the agents. Your judgment goes to the 5% of cases the AI hasn’t seen before — where shop-floor experience actually compounds.
Want this walkthrough modeled against your line’s actual day-shift workflow? Book a 30-minute working session with our dairy specialists.
Expert Perspective
"The four-generation arc from paper SPC to autonomous RCA is the story of execution catching up to methodology. Shewhart’s control chart math hasn’t changed since 1924. Nelson’s eight rules haven’t changed since 1984. What’s changed is whether a working operator can apply all that mathematics continuously across dozens of signals on a moving line — and the honest answer until G4 was always ‘not really.’ Autonomous RCA finally delivers the speed and scope the discipline always demanded. The plants that lift their chronic Cpk 0.8 SKUs past 1.33 in 2026 aren’t doing better SPC than their competitors. They’re running the same SPC at a speed and depth no one could match manually."
— Dairy Manufacturing Quality Practice, 2026 industry insight
Cpk 1.33
FMCG industry minimum — corresponds to 64 ppm defects
Cpk 1.67
World-class target — 0.6 ppm defect rate
8 weeks
documented chronic-SKU recovery: Cpk 0.82 → 1.48
Conclusion: One Hundred Years of SPC, One Final Loop Closed
Walter Shewhart drew the first control chart in 1924. For a hundred years, the methodology has been right and the execution has been incomplete. Paper SPC made the discipline visible. Digital SPC made it fast. AI-assisted SPC made it smart. Autonomous RCA finally closes the loop that the first three generations left open — the loop between detection and action, between symptom and root cause, between the chart on the wall and the fix at the valve. Dairy operators in 2026 don’t need to do SPC better than the operators who came before them. They need a platform that does the work no human ever could — eight Nelson rules continuously, multivariate correlation across hundreds of tags, 5-Why investigation in seconds, failure-pattern memory that persists across shifts and seasons. The chronic SKUs climb. The Cpk number reaches world-class. The variation that everyone accepted as the cost of doing business finally stops being the cost of doing business. Book a demo with us to see what G4 looks like on your line.
Step Into G4 on Your Dairy Line
iFactory’s dairy practice deploys autonomous RCA in 6–12 weeks against your existing PLC and SCADA. Five diagnostic agents, automated 5-Why, self-updating failure-pattern library, world-class Cpk delivery. Get a free 30-minute working session built around your three lowest-Cpk SKUs.
Frequently Asked Questions
What separates autonomous RCA (G4) from the AI-assisted SPC (G3) we already have?
The investigation. G3 systems detect anomalies and flag them — the operator still does the root cause analysis, the 5-Why interrogation, the corrective action decision. G4 closes that loop. Five diagnostic agents run the entire 5-Why automatically in the background: anomaly inference detects the drift, causal hypothesis ranks probable root causes, evidence validation confirms with historical patterns, remediation planning generates the prescriptive action, and outcome capture logs the result. By the time the operator sees the HMI alert, the investigation is complete with a ranked root cause and recommended setpoint already attached. The operator’s job becomes execution and judgment on edge cases, not pattern detection and hypothesis testing.
Why do chronic out-of-spec SKUs respond so well to autonomous RCA specifically?
Because the variation they carry isn’t random — it’s a pattern that no manual program has had the bandwidth to fully decode. A line running a chronic SKU at Cpk 0.8–1.0 for years is carrying systematic noise from sources that interact in ways single-variable SPC misses. Documented chronic-SKU recoveries in adjacent food manufacturing settings — like the UK biscuit plant whose cream deposit weight climbed from Cpk 0.82 to 1.48 in 8 weeks after depositor nozzle wear was diagnosed — show the same pattern: the root cause was identifiable, the platform found it, and the fix landed. Multivariate correlation and the self-updating failure-pattern library are exactly the tools chronic SKUs have always needed.
What Cpk should a dairy plant target, and what does autonomous RCA realistically deliver?
Cpk 1.33 is the industry-standard minimum for FMCG quality parameters — corresponds to roughly 64 defects per million units, and is required by most major retail buyers’ technical standards including BRC Global Standard Issue 9. Cpk 1.67 is world-class — 0.6 ppm defect rate, typical target for parameters with direct regulatory consequence like net weight or allergen content. Plants deploying autonomous RCA typically see chronic SKUs lift from baseline Cpk 0.8–1.0 into the 1.33+ range within 12 weeks, and capable SKUs lift further into the 1.5–1.67 world-class band within 24 weeks. The specific trajectory depends on baseline data quality and how much variation is special-cause vs common-cause on your line.
Do we have to abandon our existing SPC software to deploy autonomous RCA?
No. iFactory’s autonomous RCA platform sits above your existing SPC and controls stack. It reads from your PLCs, SCADA, historian, and existing SPC software through standard industrial protocols, runs the five diagnostic agents on a pre-configured AI server, and feeds prescriptive alerts plus adaptive limit updates back to your existing operator HMI or SPC display. Your existing SPC software continues functioning — the platform feeds it smarter control limits than the commissioning team could set manually, and adds the autonomous 5-Why investigation layer that legacy SPC doesn’t have. Most G3 deployments coexist with G4 indefinitely; G4 is additive, not replacement.
How long does the G3-to-G4 transition take and what does training look like?
Typical deployment runs 6–12 weeks. The first 2–3 weeks cover PLC and SCADA integration and historian ingest. The next 4–6 weeks calibrate the five diagnostic agents on 6–8 weeks of your plant’s historical data, with iFactory’s dairy-specific pre-configured templates accelerating most of that work. The final 2–4 weeks tune alert thresholds and confidence scoring with the operator team. Operator training is intentionally light — a 60–90 minute walkthrough plus shift-side support during the first week of live alerts. The reason training stays light is that nothing about the physical workflow changes — only the quality of information arriving on the HMI does, and that information is designed for execution, not interpretation.