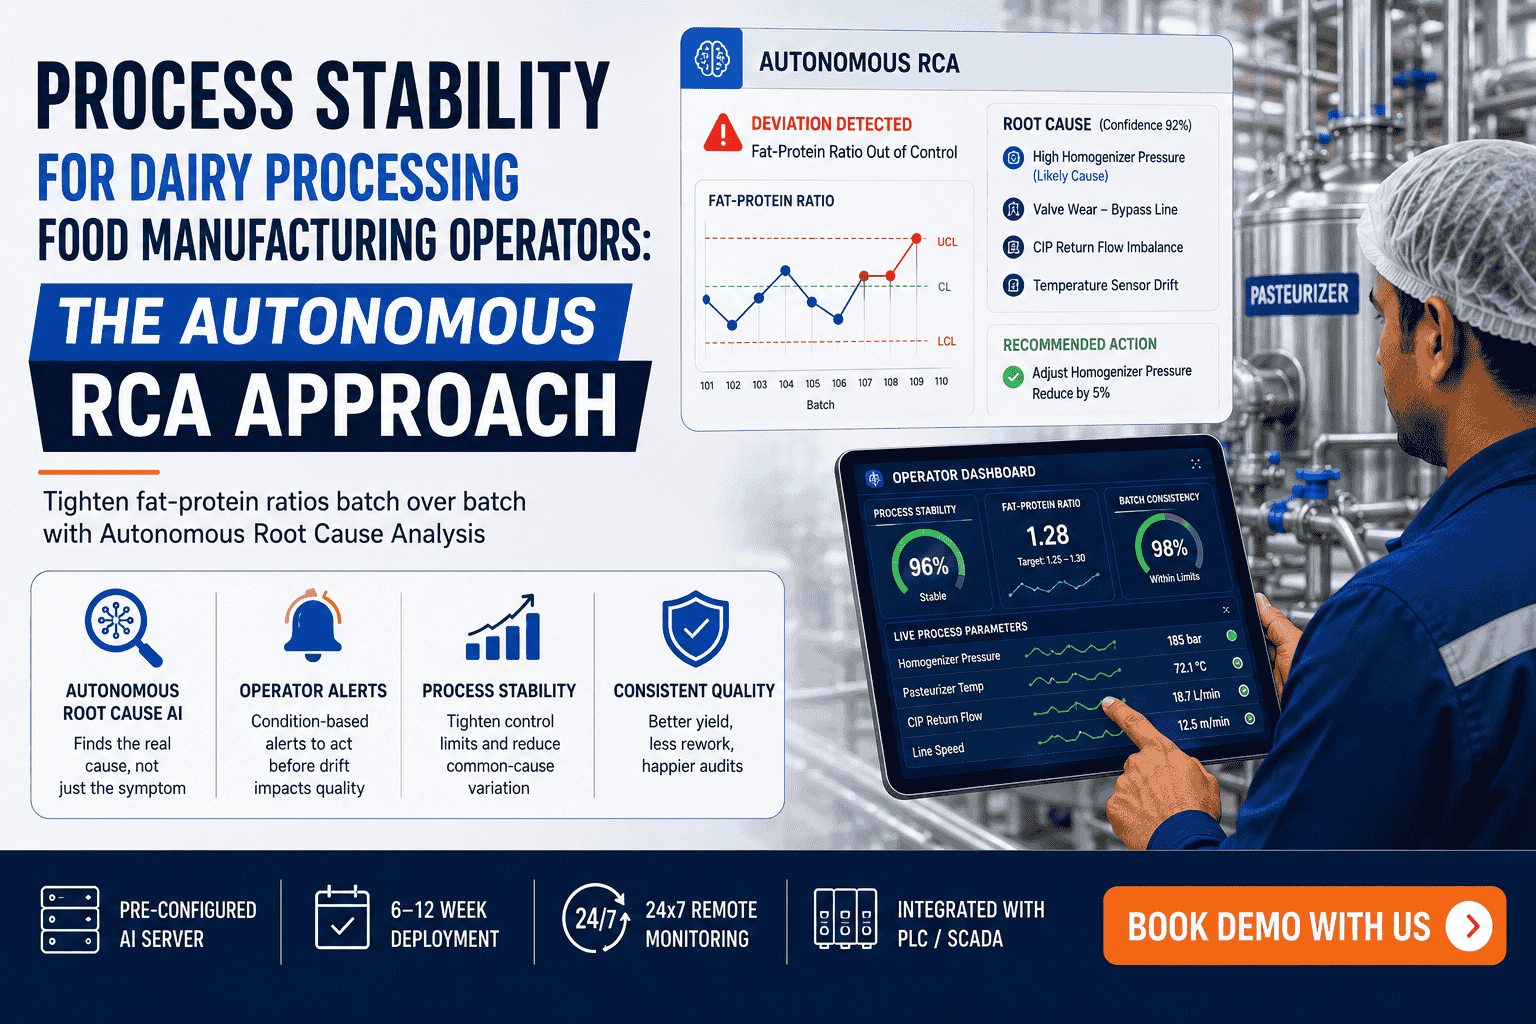
Process Stability for Dairy Processing Food Manufacturing Operators: The Autonomous RCA Approach
By Riley Quinn on May 22, 2026
Walter Shewhart drew the distinction in 1924: special-cause variation is the unusual event that throws a process out of statistical control, common-cause variation is the inherent noise of the system itself. Eliminate the first, reduce the second, and you have process stability — the precondition for every yield improvement, every audit pass, every customer commitment. For a hundred years, dairy operators have done this work by hand: spotting the special causes, chasing them through investigation, attempting to reduce common causes through manual recipe tuning across seasons. Autonomous RCA finally automates both loops. It catches every special cause at the moment of emergence with a complete investigation already done, and it learns the common-cause patterns batch over batch so the system itself becomes quieter. The result on a dairy line: fat-protein ratios that tighten week over week, batches that mirror each other instead of fighting each other, and a Cpk number that climbs without anyone having to chase it. Book a demo with us to see process stability emerge on your historian data.
Process Stability Journey · Cpk over deployment timeline
FAT-PROTEIN RATIO · LINE 3
Unstable
Cpk 0.92
Stabilizing
Cpk 1.18
Stable
Cpk 1.45
World-class
Cpk 1.67
The Two Variations Every Dairy Operator Fights — and Why They Need Different Workflows
Every dairy line carries two types of variation simultaneously. Special-cause variation comes from identifiable disruptions: a steam pressure dip, a separator vibration anomaly, an operator entering a wrong setpoint, a sensor calibration drift. Common-cause variation is the background noise built into the system: seasonal milk composition shifts, slight feed-rate fluctuations, normal homogenizer pressure ripple. Both reduce process stability. Both are addressed by autonomous RCA. But they require fundamentally different workflows — and confusing them is the most common reason quality programs stall.
Type A
Special-Cause Variation
Unusual, identifiable events that throw the process out of statistical control. The line was running stable, then something specific happened.
Reduce progressively through process redesign and adaptive control.
The Autonomous RCA Approach — One Platform, Two Workflows
Autonomous RCA doesn’t treat all variation the same. The platform runs two parallel workflows continuously. The first hunts special causes and eliminates them at the moment of emergence. The second studies common causes patiently across hundreds of batches, building the model of inherent variation that lets adaptive control progressively tighten the band. Both workflows feed the same failure-pattern library, but they operate on different timescales and produce different operator experiences.
Workflow 01
Special-Cause Elimination
Real-time · seconds to minutes
1
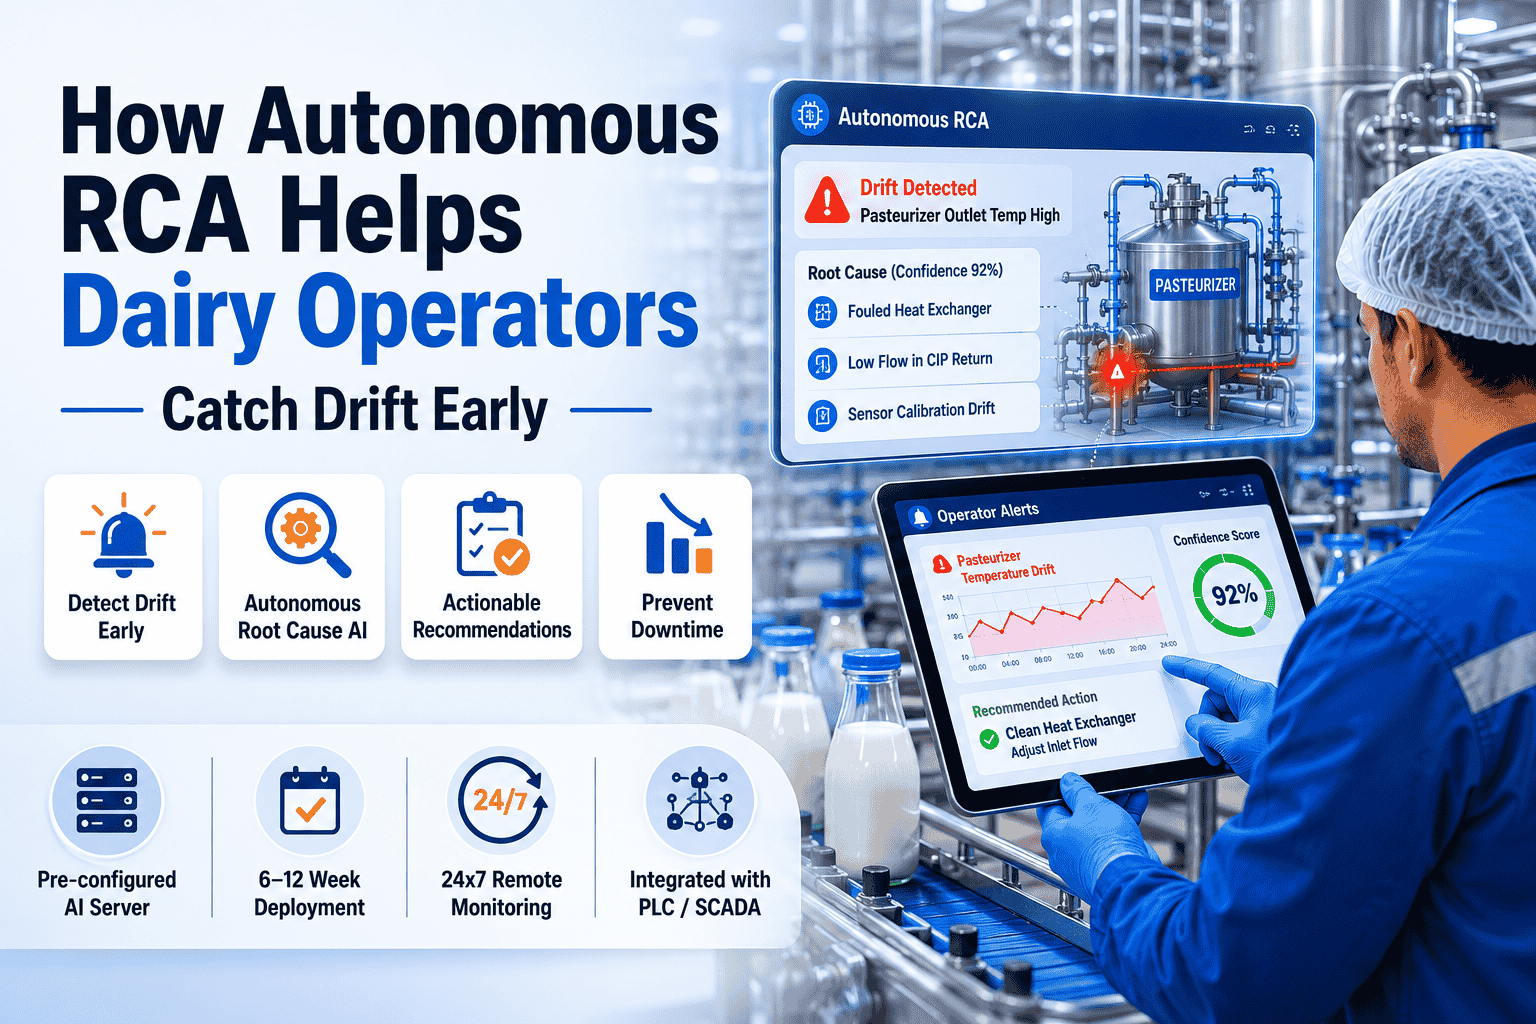
AI detects the anomaly — out-of-pattern signal that doesn’t match common-cause baseline.
2
Causal hypothesis ranks probable root causes from variable contribution scores.
3
Prescriptive action surfaces on operator HMI with confidence and expected resolution.
4
Operator executes; outcome logged to failure-pattern library to prevent recurrence.
Workflow 02
Common-Cause Reduction
Continuous learning · days to weeks
1
AI models the inherent variation patterns across hundreds of batches at steady state.
2
Adaptive control limits tighten as the model gains confidence about natural noise floor.
3
Recipe-level recommendations emerge for setpoints that consistently produce tighter batches.
4
Cpk climbs progressively as common-cause noise reduces — without operator chasing it.
Want to see both workflows mapped against your fat-protein ratio history? Book a stability assessment with our dairy specialists.
What Tightening Fat-Protein Ratio Actually Looks Like — Batch Over Batch
The fat-protein ratio on standardized dairy products is the single most operator-visible measure of process stability. A ratio that drifts batch-over-batch produces giveaway, downgrades, customer complaints, and the operator’s recurring nightmare of being held responsible for variation they didn’t cause. Watching this number tighten is how operators feel autonomous RCA working on their line.
Week 0
Pre-deployment
±0.18 ratio
Wide batch-over-batch spread. Operators add safety margin on every batch. Giveaway is the routine cost of consistency.
Week 6
Special causes eliminated
±0.12 ratio
Workflow 01 has caught the recurring drift events. The chronic outliers stop appearing. Operators trust the chart again.
Week 12
Adaptive limits engaged
±0.08 ratio
Workflow 02 has tightened the common-cause band. Recipe recommendations apply. Giveaway falls without underfill risk.
Week 24
World-class stability
±0.05 ratio
Cpk crosses 1.67. Batches mirror each other. The line behaves as a stable, predictable system — ready for further capability gains.
From Unstable to World-Class in 24 Weeks — Deployed in 6–12
iFactory ships a pre-configured AI server tuned for dairy process stability — both special-cause elimination and common-cause reduction running in parallel. Integrates with your existing PLC and SCADA, delivers first stability gains within 6–8 weeks of go-live.
Process stability isn’t one number — it’s a constellation of four signatures that move together when autonomous RCA is working correctly. Watching all four simultaneously is how operators and plant managers know the platform is delivering on its promise. Three weeks into deployment, you should be able to point at every one of them.
Cpk Trending Up
Process capability index climbs steadily as both workflows compound. Baseline 0.9–1.0 typically reaches world-class 1.33+ within 12 weeks.
Variance Compressing
Batch-over-batch standard deviation falls. Visible on weekly summary plots as a literal narrowing of the spread.
Recurrence Rate Falling
The same defect stops happening twice. The failure-pattern library prevents repeat events, which is the structural signature of true elimination.
Operator Trust Rising
Alert acceptance rate climbs from ~70% in week 1 to >95% by week 8. The platform stops being “the new tool” and starts being how the line runs.
Want a 30-day stability dashboard built for your line? Book a working session with our dairy team.
What the Operator Actually Does Differently
Process stability isn’t an abstract concept on a control chart. It changes what the operator does — minute to minute, shift to shift, batch to batch. Three concrete behavioral shifts mark the deployment’s success on the shop floor.
Operator behavior
Before
After
Setpoint adjustments
Made reactively after a problem appears
Made proactively from prescriptive AI alert
Investigation time
30–90 min per recurring defect
Investigation already done — act in seconds
Shift handover
Defensive recap of yesterday’s problems
Forward-looking briefing with stability forecast
Recipe trust
Manual safety margin added to every batch
Recipe used as designed — AI watches for drift
Cpk awareness
Monthly QA report, after the fact
Live on the shift dashboard — trending in real time
Expert Perspective
"A process must be stable before its capability can be assessed or improvements initiated. That was Deming’s teaching from the 1950s, and it remains the foundation of every quality improvement program in dairy manufacturing. What’s changed in 2026 is that achieving stability is no longer a multi-year discipline requiring manual investigation of every special cause and patient reduction of every common cause. Autonomous RCA runs both workflows continuously, in parallel, on every signal — making the journey from Cpk 0.9 to 1.67 a 12–24 week project rather than a 2–5 year one. The math hasn’t changed in a century. The speed of running it has."
— Dairy Process Stability Practice, 2026 industry insight
1.33+
Cpk target for world-class dairy process capability
2 types
variation Shewhart’s SPC theory distinguishes
12–24 wk
typical journey from baseline to world-class Cpk
Conclusion: Stability as the Operating State
Process stability isn’t a quarterly achievement or a once-and-done project. It’s the operating state of a dairy line where special causes get caught the moment they appear and common causes shrink progressively across batches. Shewhart described it. Deming taught it. Autonomous RCA finally delivers it at the speed dairy manufacturers actually need. The Cpk number climbs, the batches mirror each other, the giveaway falls, and the morning huddle stops being a recap of variation and starts being a forecast of capability. Six to twelve weeks to deployment. Twelve to twenty-four weeks to world-class stability. And the line that opened this guide — fighting batch-over-batch fat-protein drift like it’s the cost of doing business — finishes with batches that hit target within ±0.05 ratio, every time. Book a demo with us to begin the stability journey on your line.
Begin the Stability Journey on Your Line
iFactory’s dairy practice deploys autonomous RCA in 6–12 weeks against your existing PLC and SCADA. Both workflows — special-cause elimination and common-cause reduction — running in parallel. Get a free 30-minute working session built around your line’s current Cpk baseline.
What is process stability in a dairy processing context?
Process stability is the operating state where a dairy line shows only common-cause variation (the inherent noise of the system) and no special-cause variation (unusual events that throw it out of statistical control). A stable line produces predictable, repeatable batches; an unstable line produces unpredictable variation that no amount of reactive intervention can fully correct. Shewhart’s teaching from 1924 remains the foundation: a process must be stable before its capability can be assessed or improvements can be reliably initiated. Cpk ≥ 1.33 is the typical threshold for world-class stability in regulated process industries; dairy plants running autonomous RCA platforms typically reach this within 12–24 weeks.
How does autonomous RCA reduce common-cause variation, not just special-cause?
By running two parallel workflows. Workflow 01 (special-cause elimination) operates in real time — catches anomalies, runs the diagnostic agents, surfaces prescriptive actions on the HMI within seconds. Workflow 02 (common-cause reduction) operates on a longer timescale — models the inherent variation patterns across hundreds of batches, adaptive control limits tighten progressively as confidence in the noise floor grows, and recipe-level recommendations emerge for setpoints that consistently produce tighter batches. Common-cause variation can only be reduced by changing the system itself; autonomous RCA does this through learned recommendations that operators and engineers act on across weeks, while the daily firefighting on special causes happens in seconds.
How does this tighten fat-protein ratios batch over batch specifically?
The fat-protein ratio is the most sensitive indicator of dairy process stability because both signals interact — ratio drift means at least one signal is moving while the other isn’t tracking. Autonomous RCA addresses this through multivariate correlation rather than single-variable monitoring. Workflow 01 catches the upstream cause of any ratio excursion (separator skim drift, NIR calibration shift, cream metering valve wear) before the ratio crosses spec. Workflow 02 progressively learns the seasonal patterns — raw milk composition varies across the year, and the platform builds a season-aware baseline that legacy SPC tools cannot. The visible result is a ratio spread that compresses from typical ±0.18 at deployment to ±0.05 by week 24.
Does the operator need to understand SPC theory to use this?
No, although operators who already understand SPC find autonomous RCA intuitive almost immediately. The platform’s outputs are designed for execution, not interpretation: prescriptive actions arrive on the HMI with a specific setpoint adjustment, a confidence score, and an expected resolution time. The operator doesn’t need to mentally apply the eight Nelson rules, compute control limits, or distinguish common-cause from special-cause variation — the platform handles all of that in the background. Where operator skill compounds is in the small percentage of edge cases the AI hasn’t seen before, where judgment based on shop-floor experience remains essential. Training is typically a 60–90 minute walkthrough plus shift-side support during the first week of live operation.
How does this work alongside our existing PLC, SCADA, and quality systems?
As an additive layer, not a replacement. iFactory’s autonomous RCA platform reads from any PLC vendor and SCADA system over standard industrial protocols, runs the two workflows on a pre-configured AI server, and pushes prescriptive alerts and adaptive limit updates back to your existing operator HMI. Your existing QMS, LIMS, and SPC software continue functioning — the platform feeds them better-calibrated control limits and richer event documentation than the commissioning team could set manually a decade ago. PLCs run the deterministic safety control loops as they always have. The autonomous RCA layer adds intelligence above without disturbing what works underneath. Deployment runs 6–12 weeks, with first stability gains visible within 6–8 weeks.