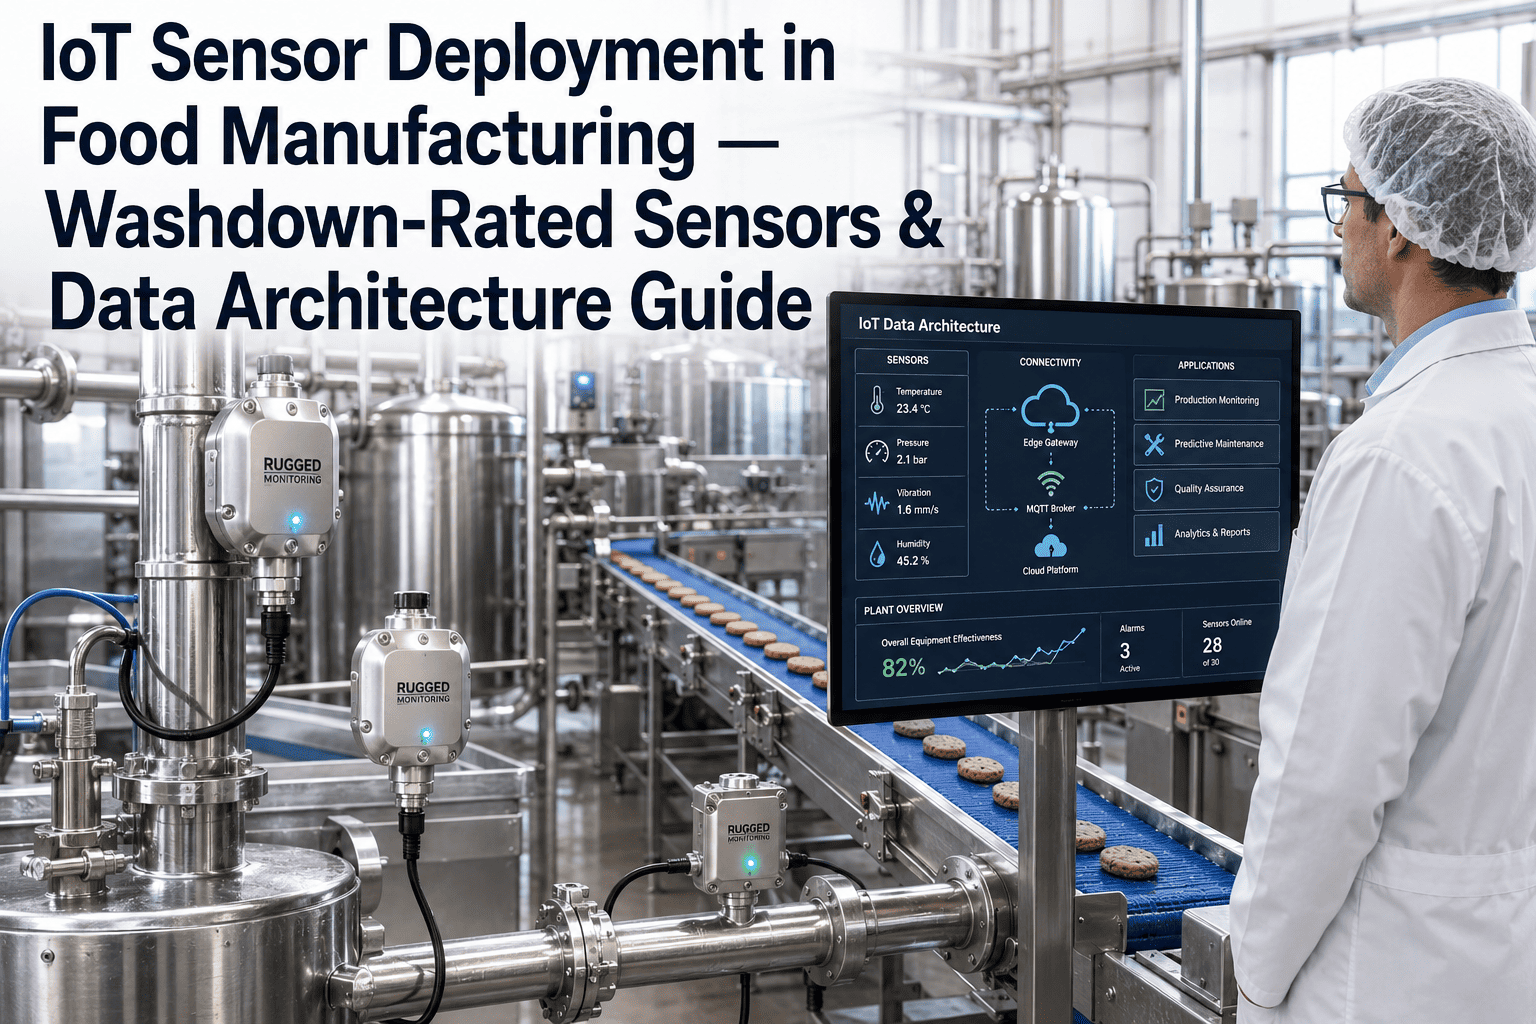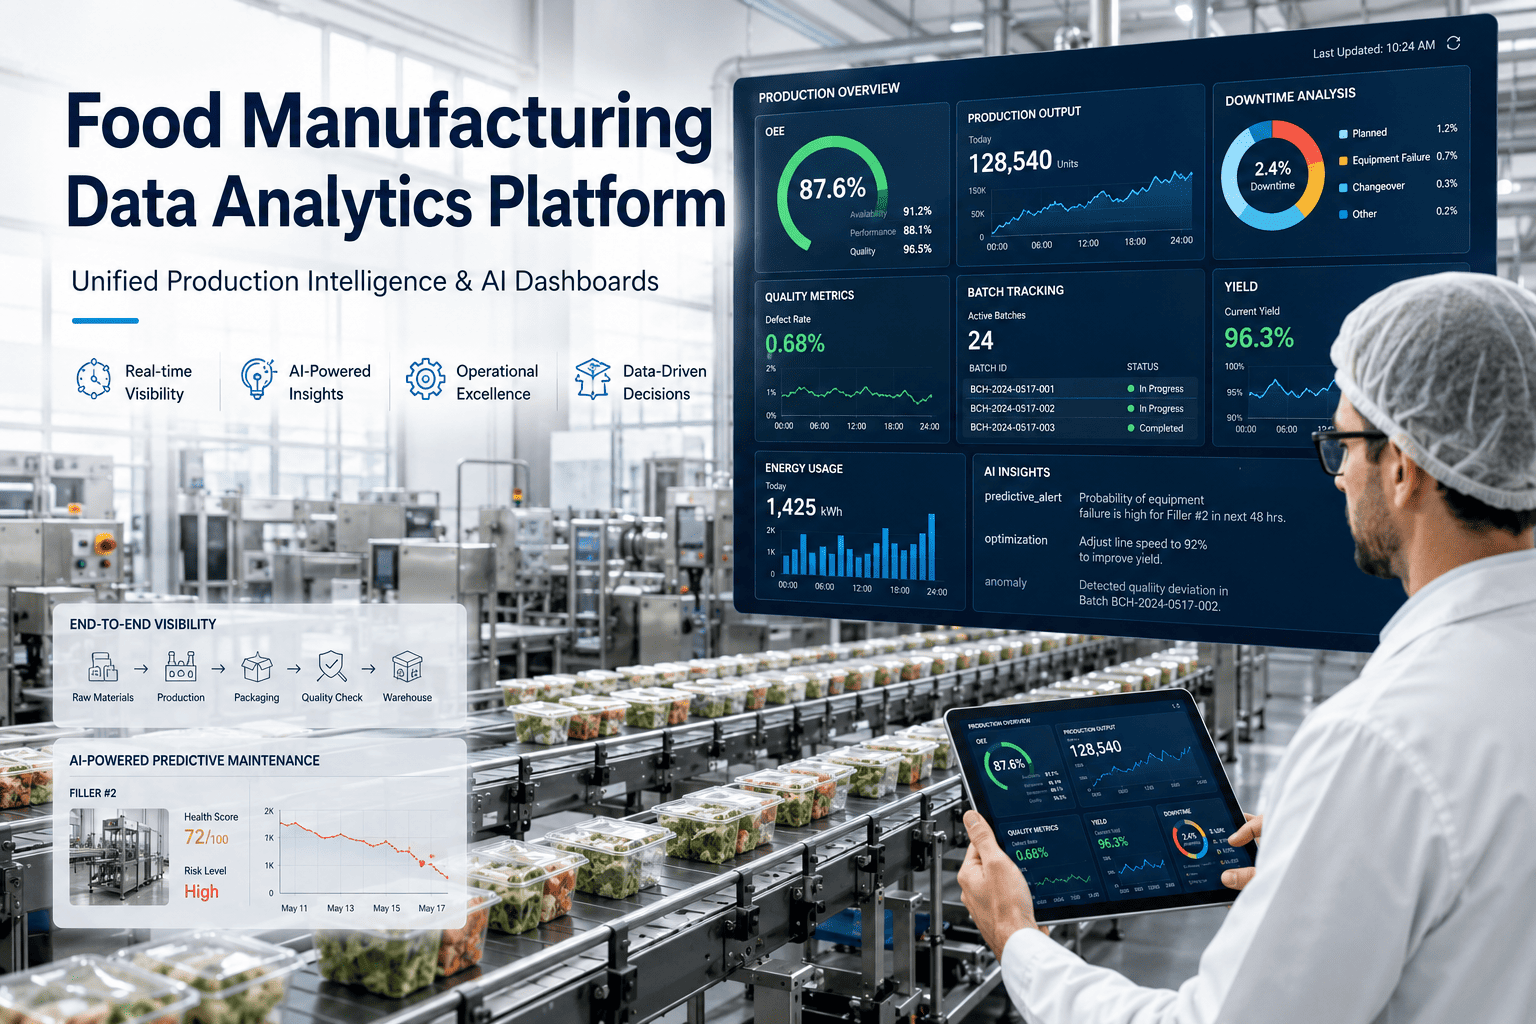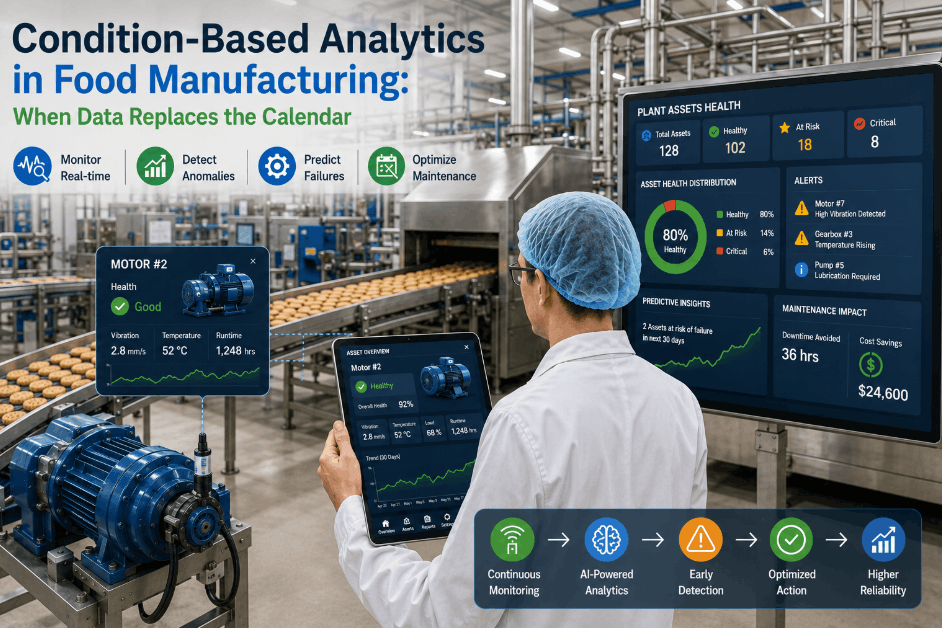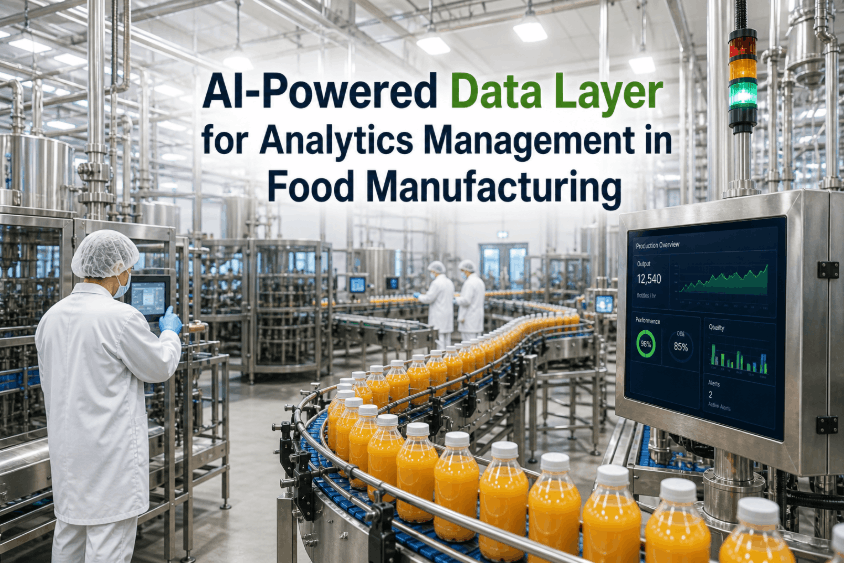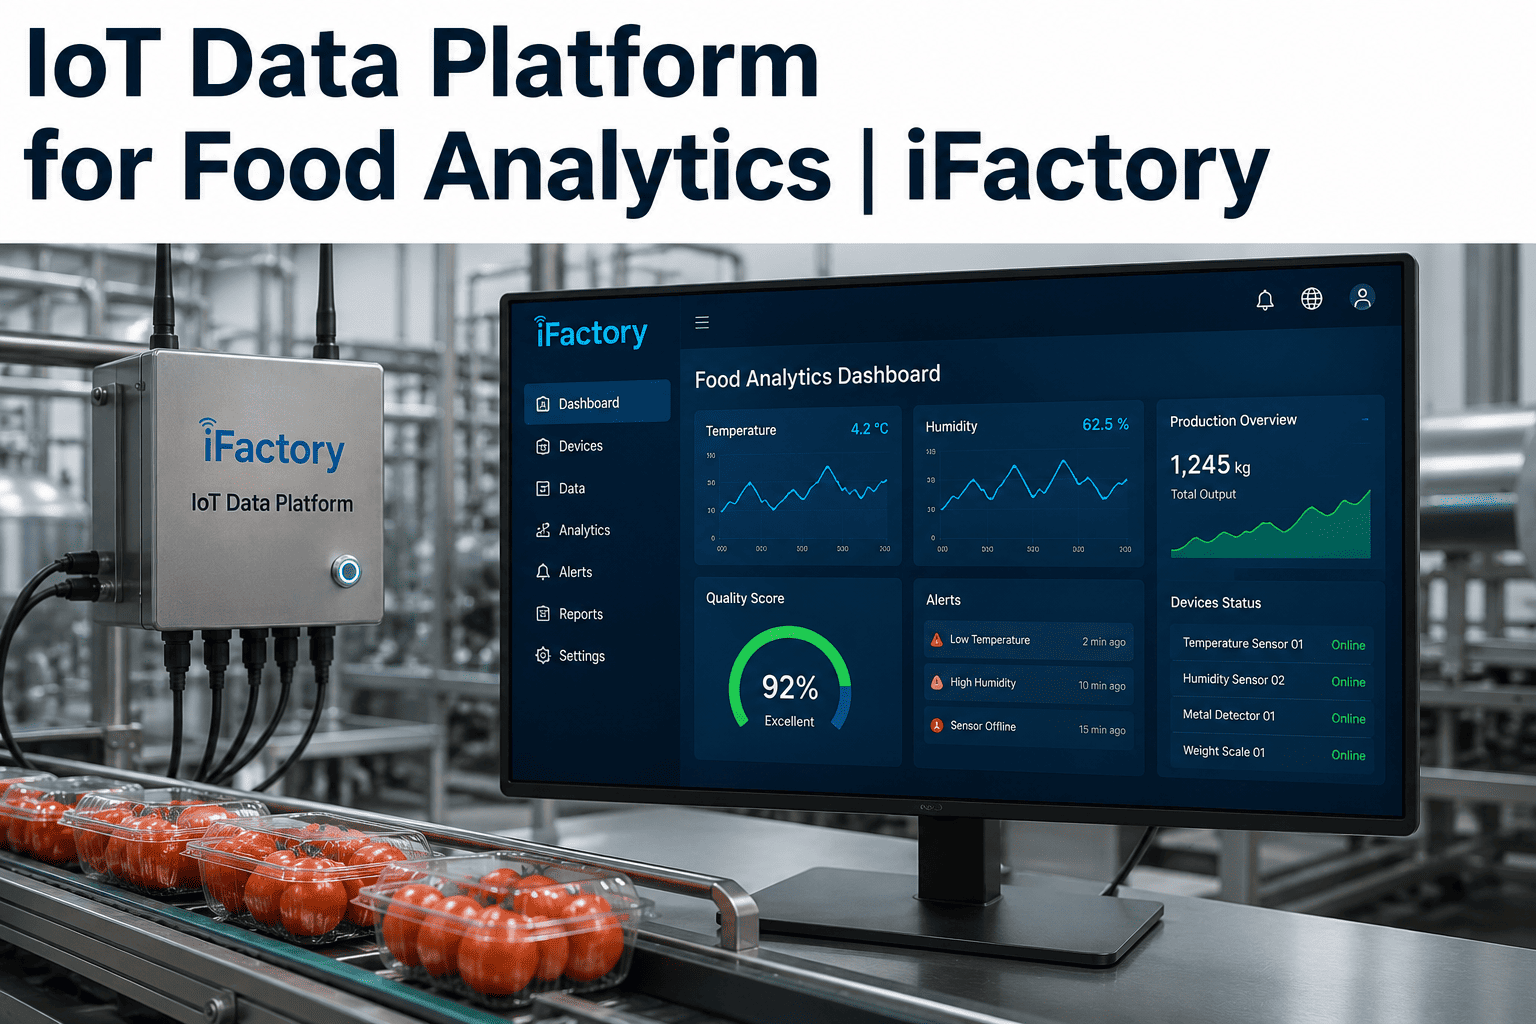
Most food manufacturing plants already have more sensor data than they know what to do with — temperature readings, line speed counters, humidity logs, and equipment status signals generated constantly across dozens of pieces of equipment, most of it disconnected from any system that could actually turn it into a decision. An IoT data platform solves this by pulling sensor data from across the plant floor into a single collection layer, applying analytics that surface patterns a human reviewing individual sensor logs would never catch, and presenting the result through dashboards that plant managers and quality teams can actually act on rather than a raw data export nobody has time to interpret. The real value is not in collecting more data — plants that jump straight to buying more sensors before fixing how existing data is collected and used typically end up with an even larger unused data backlog. The sections below cover how a data platform is architected, what makes dashboard visualization genuinely useful rather than decorative, and how integration with ERP and quality systems turns collected data into operational action, with additional guidance in iFactory's support documentation.
01 / Why Sensor Data Alone Does Not Create Value
Installing sensors across a plant floor is the easy part of a data platform initiative — the harder and more valuable work is building the collection, storage, and analysis layer that turns thousands of individual readings into something a person can actually use to make a decision. A plant with sensors on every cook line but no centralized platform to aggregate that data typically ends up with dozens of disconnected local displays and logs, each useful only to whoever happens to be standing near that specific piece of equipment at that specific moment, which defeats much of the purpose of collecting the data in the first place.
02 / The Core Layers of an IoT Data Platform
A functioning IoT data platform is built from several distinct layers working together, and understanding each layer helps a plant evaluate whether a proposed solution actually addresses the full pipeline or only a piece of it.
03 / What Makes a Dashboard Genuinely Useful Rather Than Decorative
A dashboard that displays every available metric with equal visual weight is rarely more useful than the raw data feed it replaced, since the person viewing it still has to do the mental work of deciding which numbers actually matter for the decision in front of them. Effective dashboards are built around specific roles and specific decisions — a maintenance lead needs to see equipment trending toward failure, while a quality manager needs to see product parameters trending toward a critical limit, and a single generic dashboard trying to serve both audiences equally well typically serves neither particularly well.
| Role | Primary Dashboard Need |
|---|---|
| Plant Manager | Cross-line performance comparison and exception summary |
| Quality Team | Product parameters trending toward critical limits |
| Maintenance Lead | Equipment health trends signaling upcoming failure risk |
| Corporate Quality | Standardized comparison across multiple facilities |
04 / Cloud Analytics and the Question of Where Processing Happens
Cloud-based analytics processing allows a plant to apply more sophisticated pattern recognition and trend analysis than local equipment can typically support on its own, while also making historical data available for comparison across long time periods without requiring local storage capacity to grow indefinitely. The tradeoff, as with any cloud-dependent system, is that plants need a clear understanding of what happens locally if internet connectivity is interrupted, since critical alerts tied to food safety parameters cannot afford to simply stop functioning during a connectivity gap.
05 / Integrating the Data Platform With ERP and Quality Systems
A data platform that exists in isolation from a plant's ERP and quality management systems creates a parallel record that staff still have to manually reconcile against the systems that actually drive business decisions, which undermines much of the efficiency gain the platform was meant to deliver. Proper integration routes production and quality data automatically between systems, so a deviation flagged on the analytics dashboard is reflected in the quality management system's record without separate manual entry, and production data feeding into planning tools reflects actual verified output rather than a theoretical target.
06 / Starting Small and Scaling the Platform Deliberately
Plants that attempt to connect every sensor across every line simultaneously in a single implementation phase frequently struggle with data quality issues and dashboard sprawl that could have been avoided by starting with a smaller, well-defined scope. A more effective approach identifies the single highest-value use case — often the process with the most frequent quality issues or the least visibility today — builds the platform around that use case thoroughly, and expands to additional lines and metrics only once the initial deployment is proven and adopted by staff.
07 / Common Pitfalls That Undermine Data Platform Value
A recurring pattern across unsuccessful data platform initiatives is treating the technology deployment as the finish line rather than the starting point, with no clear ownership assigned for reviewing dashboards, acting on flagged trends, or maintaining data quality once the initial rollout excitement fades. Assigning specific ownership for ongoing platform use, alongside the technical implementation itself, is what separates plants that see lasting value from those where an initially promising platform gradually falls out of active use within the first year.
08 / Conclusion — The Platform Is the Multiplier, Not the Sensors
The sensors themselves generate raw signal, but it is the collection, analytics, and dashboard layers built on top of that signal that actually convert plant floor data into decisions people can act on. Facilities that invest in this full pipeline, integrate it with the systems that already drive daily operations, and assign clear ownership for ongoing use see considerably more value than those that simply add more sensors to a plant floor without addressing how that data actually gets used. Book a demo to see how a data platform would be architected around your specific plant environment.
Frequently Asked Questions — IoT Data Platforms for Food Manufacturing
In most cases existing sensors and equipment can be connected to a new data platform through appropriate gateways and protocol converters rather than requiring wholesale replacement, which considerably reduces the cost and disruption of implementation. The platform's collection layer is typically designed to accept data from a range of common industrial protocols and sensor types, meaning the primary integration work involves connecting existing infrastructure to the new collection layer rather than replacing hardware that is already functioning correctly on the plant floor.
Data quality management typically involves establishing validation rules at the collection layer that flag readings falling outside physically plausible ranges, cross-referencing readings from related sensors to catch a single failing unit, and maintaining a calibration schedule so drift in older sensors is caught before it meaningfully skews trend analysis. Facilities with a mix of newer and older sensor generations should expect to invest some effort specifically in validating and normalizing data from the older equipment, since inconsistent data quality from a subset of sensors can undermine confidence in the platform's output as a whole. iFactory's support documentation covers standard data validation approaches for mixed sensor environments.
Ownership should be assigned by role rather than left as a shared, informal responsibility, since dashboards that nobody is specifically accountable for reviewing tend to be checked inconsistently and eventually ignored once the novelty of a new system wears off. Maintenance trend alerts typically belong with the maintenance team, quality parameter trends with quality assurance, and cross-line performance summaries with plant management, with each role's dashboard designed specifically around the decisions that role is expected to make using that data.
Multi-facility data platforms typically standardize the metrics and taxonomy used for cross-site comparison — such as defining a common way to measure line efficiency or a common critical limit terminology — while still allowing individual facilities to track additional site-specific metrics relevant to their particular equipment and processes. This balance lets corporate quality and operations teams compare performance meaningfully across sites using the standardized metrics, while local plant teams retain the detailed, equipment-specific visibility they need for day-to-day operational decisions.
The strongest first use cases are typically processes with a known, recurring quality or efficiency problem where better visibility would clearly change a daily decision — a cook line with frequent temperature deviations, for instance, or an area with recurring unplanned downtime that current logging cannot explain. Starting with a process that already has a clear, felt pain point makes the value of the platform immediately obvious to the staff using it, which builds the internal support needed to expand the platform to additional areas afterward. Book a demo to identify the strongest starting use case for your specific facility.