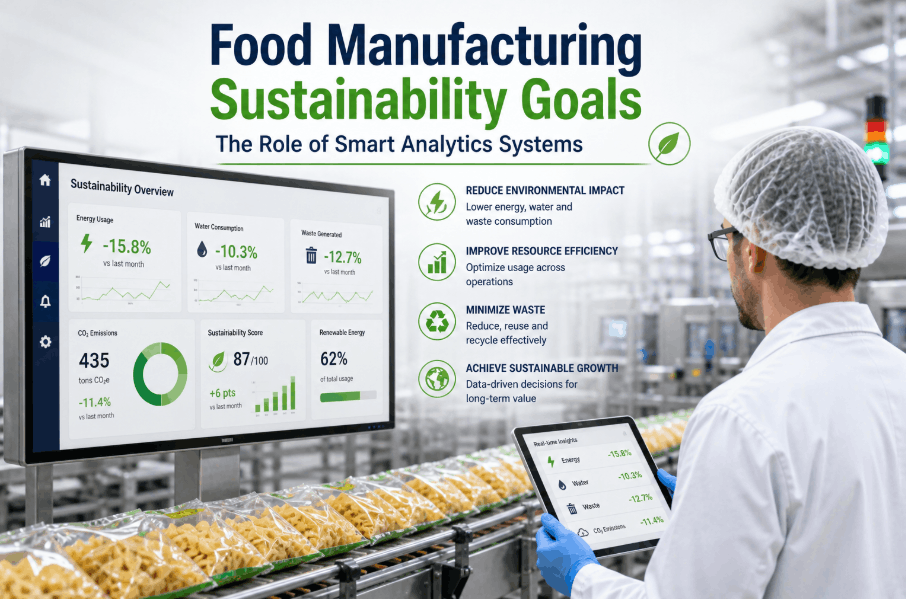
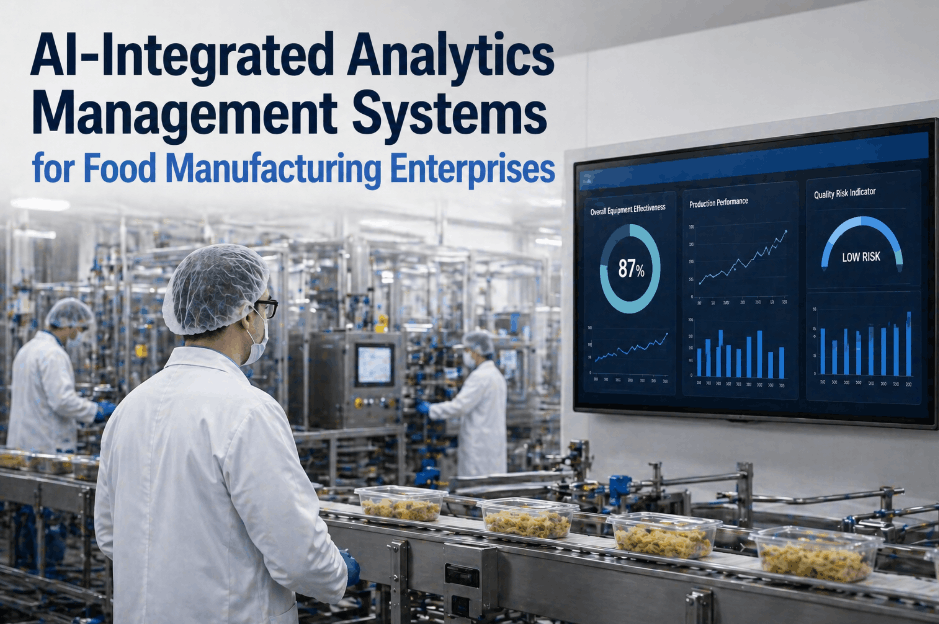
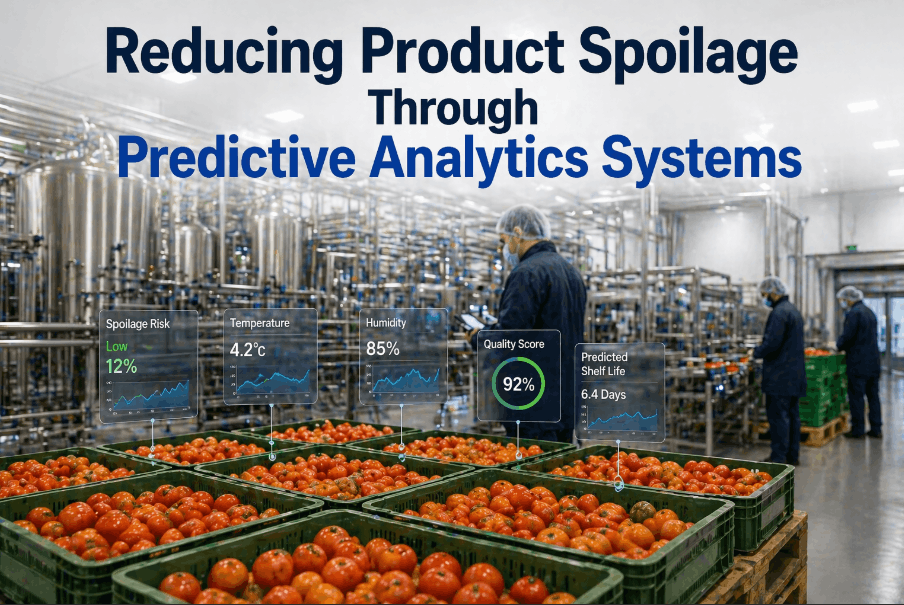
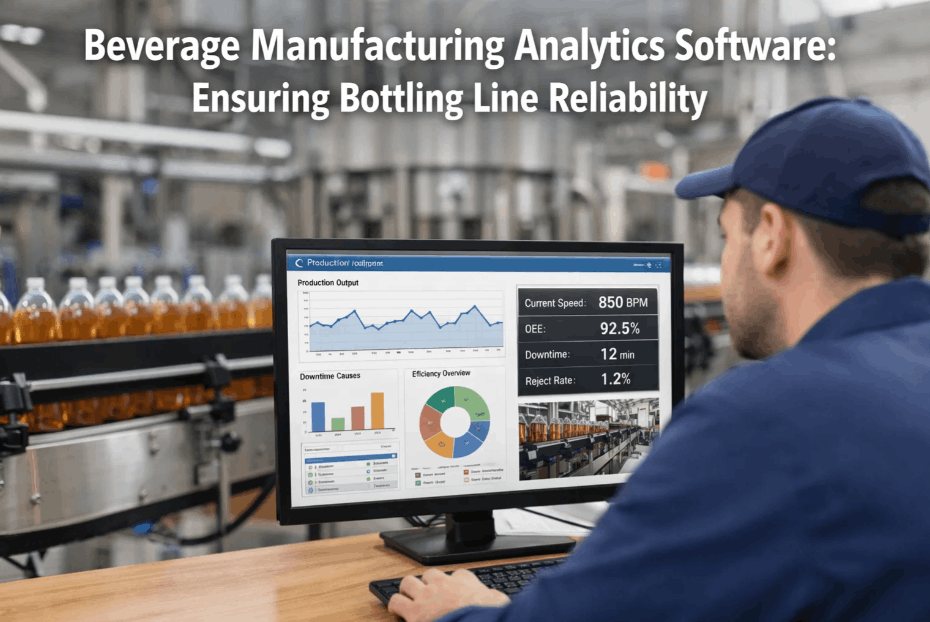
Production line reliability is no longer a maintenance challenge—it is a data challenge. Manufacturers who deploy analytics management across their production lines gain a measurable competitive edge: fewer unplanned stoppages, higher overall equipment effectiveness, and a maintenance model that shifts from reactive firefighting to proactive asset stewardship. For facilities still relying on calendar-based schedules and manual inspection rounds, the gap between their operational costs and those of data-driven competitors widens every quarter. If your facility is evaluating its next step toward intelligent reliability, Book a Demo to see how a purpose-built industrial analytics platform can transform your production performance from the floor up.
What Is Analytics Management and Why Production Line Reliability Depends on It
Analytics management in the manufacturing context refers to the systematic collection, processing, and interpretation of machine and process data to drive operational decisions. Unlike traditional monitoring tools that simply log sensor readings, a modern operational analytics platform connects every critical asset—motors, pumps, conveyors, packaging lines—into a unified intelligence layer that flags anomalies, predicts failure windows, and prescribes corrective actions before production is disrupted.
The case for analytics-led reliability is straightforward. According to industry benchmarks, unplanned downtime costs food manufacturers between two and five percent of total annual revenue per facility. A mid-size plant running at $150 million in annual output can lose between $3 million and $7.5 million per year exclusively to avoidable stoppages. The majority of those stoppages are preceded by detectable data signatures—vibration anomalies, thermal drift, current draw irregularities—that a condition monitoring system would have caught weeks in advance. Analytics management converts those data signatures into work orders before they become production crises. When your operations team is ready to close this reliability gap, Book a Demo and benchmark your current facility against these performance standards.
Real-Time Asset Visibility
Analytics management provides a live, continuous view of every critical asset's health status—eliminating the blind spots that make unplanned failures both unpredictable and expensive.
Impact: Zero-surprise operationsBottleneck Identification
Production flow analytics isolate the specific assets, shifts, or process variables responsible for throughput losses—converting vague performance problems into precise, solvable engineering tasks.
Impact: Faster root cause resolutionMaintenance Cost Reduction
Condition-based maintenance driven by analytics eliminates unnecessary preventive replacements while ensuring that assets approaching failure receive timely intervention—reducing total maintenance spend by 25–35%.
Impact: Lower Opex per unitQuality Consistency
Process analytics monitor the environmental and mechanical variables that cause product quality drift, enabling corrective action before batch-level failures result in rework, disposal, or customer complaints.
Impact: Reduced waste and reworkFrom Reactive to Predictive: How Condition Monitoring Systems Eliminate Unplanned Downtime
The transition from a reactive maintenance model to a predictive one is the single highest-ROI investment a food manufacturing facility can make. Most plants move through three operational stages before reaching full predictive maturity. Understanding where your facility currently sits on this spectrum is the first step toward structuring an effective analytics management strategy.
Reactive Maintenance
Equipment is repaired only after failure. Emergency repair costs run 8–10 times higher than planned maintenance, and production disruptions cascade across downstream operations and shipping commitments.
Reliability Score: LowPreventive Maintenance
Maintenance is scheduled at fixed calendar intervals. Over-servicing healthy assets wastes labor and parts budget, while assets that deteriorate faster than the schedule predicts still fail unexpectedly.
Reliability Score: ModeratePredictive Intelligence
Continuous sensor data feeds AI failure models that predict asset degradation weeks in advance. Maintenance is triggered by actual condition, not schedules—maximizing both asset life and maintenance budget efficiency.
Reliability Score: MaximumThe jump from Stage 2 to Stage 3 is where analytics management delivers its greatest financial return. By deploying wireless vibration sensors, thermal imaging, and PLC data integration into a unified predictive maintenance software engine, plant directors gain the ability to intercept failures before they reach the production schedule. For rotating equipment—motors, pumps, gearboxes—vibration analytics can detect bearing wear, shaft imbalance, and misalignment with weeks of advance warning. You can explore how this applies to your specific asset mix when you Book a Demo with our reliability engineers.
Asset Performance Management: Connecting Equipment Health to Production KPIs
Asset performance management (APM) is the strategic discipline of optimizing the reliability, availability, and cost of physical assets over their full operational lifecycle. When integrated with a real-time manufacturing execution system and an industrial IoT monitoring layer, APM transforms raw sensor data into boardroom-level metrics: Overall Equipment Effectiveness (OEE), Mean Time Between Failures (MTBF), and Total Cost of Ownership (TCO) per production line.
The Metrics That Define Production Line Reliability
Plant directors managing reliability without analytics are effectively flying blind. The following metrics form the backbone of any effective asset performance management program—and each one is directly improved by deploying a structured analytics management framework across the production environment.
| Reliability KPI | Without Analytics Management | With Analytics Management | Improvement Potential |
|---|---|---|---|
| Overall Equipment Effectiveness (OEE) | 55–65% industry average | 75–85% sustained performance | +15–22% OEE uplift |
| Unplanned Downtime Frequency | 8–12 events per month per line | 1–3 events per month per line | –65–75% event reduction |
| Mean Time Between Failures (MTBF) | Unpredictable; calendar-driven | Condition-driven; proactively managed | 2–4x MTBF extension |
| Maintenance Cost per Unit Produced | High; reactive repair premium | Optimized; condition-based intervention | –25–35% total maintenance spend |
| Asset Lifecycle | Terminated by unpredicted failure | Extended by early anomaly detection | +3–5 years per critical asset |
| Spare Parts Inventory Cost | Over-stocked to buffer surprises | Precision-ordered based on predictions | –30% inventory carrying cost |
The Technical Architecture of a Smart Factory Analytics Platform
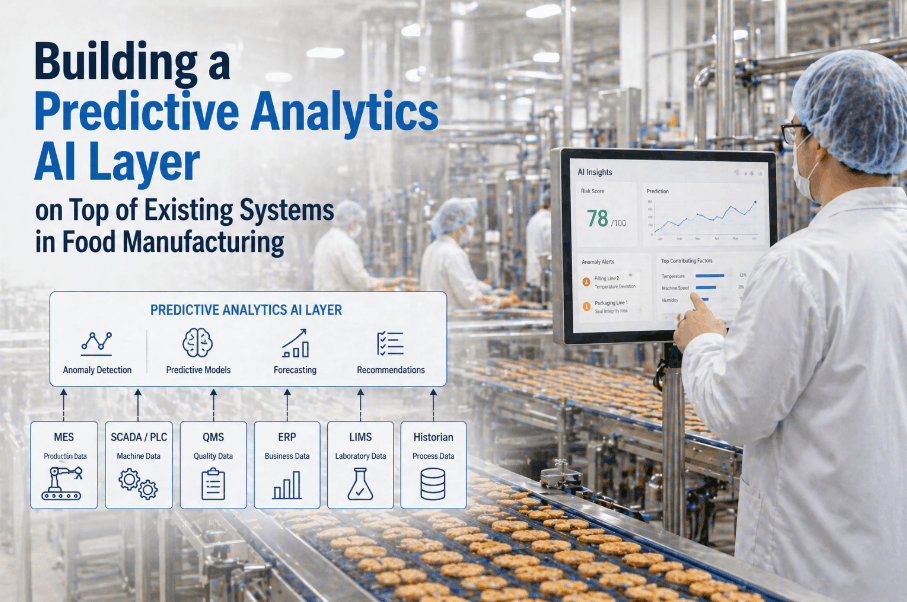
Building a reliable analytics infrastructure does not require replacing existing machinery. Modern industrial IoT monitoring systems use an edge-to-cloud architecture that integrates with legacy PLCs, SCADA systems, and manual process inputs alongside new wireless sensor networks—creating a unified data pipeline without requiring a full plant overhaul. The key is layering intelligence on top of existing assets rather than waiting for a capital replacement cycle to enable data visibility.
Data Acquisition Layer
Wireless vibration, temperature, current, and pressure sensors install non-intrusively on any asset—from high-speed centrifuges to basic conveyor motors—transmitting continuous sub-millisecond data streams to the edge processing unit.
Edge Processing & Normalization
An on-premises edge gateway normalizes data from heterogeneous sources—PLCs, SCADA, IoT sensors, manual inputs—into a unified asset health schema, enabling cross-asset comparison and real-time anomaly scoring at the facility level.
AI Failure Modeling Engine
Proprietary machine learning models trained on food manufacturing failure patterns distinguish normal process variation from emerging mechanical anomalies—delivering time-to-failure estimates with industry-leading accuracy.
Predictive Workflow Automation
Automated work order generation pushes diagnostic data, failure probability scores, and recommended corrective actions directly into your CMMS—whether SAP, Maximo, or UpKeep—with zero manual data entry required.
OEE & Production Dashboard
A unified operations dashboard delivers live OEE scores, shift-level performance comparisons, bottleneck heatmaps, and energy consumption analytics—giving plant directors a single command center for the entire facility.
Reporting & Compliance Layer
Automated reliability reports generate audit-ready documentation of asset health history, maintenance interventions, and quality control data—reducing manual reporting burden and strengthening regulatory compliance posture.
Using Bottleneck Analysis to Reclaim Hidden Production Capacity
Every food manufacturing facility contains a "hidden factory"—latent throughput capacity lost to micro-stoppages, slow-running equipment, extended changeovers, and chronic minor defects that individually seem insignificant but collectively cost the plant 15–25% of its total achievable output. Traditional production reporting systems mask these losses inside aggregated shift summaries. A dedicated bottleneck analysis software layer within the analytics management platform surface each individual loss event, quantifies its contribution to the overall throughput gap, and ranks the intervention priorities by financial impact. Facilities that have mapped this hidden capacity typically discover that booking a demo was the first step to reclaiming millions in lost margin without any new capital spend.
The Six Major Throughput Loss Categories Analytics Management Resolves
The OEE framework decomposes total production performance into three primary factors—Availability, Performance, and Quality—each of which contains specific loss categories that analytics management can quantify and target. Understanding which of the six major loss categories is most impactful in your facility is the starting point for any intelligent reliability program.
Unplanned Equipment Failures
The most financially damaging loss category. Analytics management reduces this to near-zero by predicting failures weeks in advance through vibration and thermal signature analysis.
Extended Changeovers & Setups
Production analytics quantify changeover duration variance across shifts and operators, identifying the specific steps where time is lost and enabling standardized best-practice workflows.
Reduced Line Speed
Real-time speed monitoring against nameplate capacity reveals when lines are running below their designed throughput—often due to early-stage mechanical wear that condition monitoring would intercept.
Minor Stoppages & Idling
Stoppages under five minutes are rarely captured in manual logs but collectively represent 8–12% of total available production time. Smart factory analytics capture every event automatically.
Startup Yield Losses
The first production units after a changeover or restart frequently fall outside specification. Analytics management tracks startup quality curves and prescribes process adjustments that tighten them.
In-Process Defects & Rework
Process analytics correlate quality rejection events with upstream mechanical and environmental variables, enabling root cause identification rather than symptomatic quality intervention.
Quantifying the ROI of Analytics Management: A Three-Layer Value Model
The financial case for deploying a comprehensive manufacturing intelligence software platform is built on three compounding layers of value, each of which delivers measurable returns within a predictable timeframe. Unlike physical automation—which delivers a fixed return tied to labor displacement—a digital analytics layer becomes more valuable over time as its AI models accumulate facility-specific data and refine their predictive accuracy. Facilities that Book a Demo early in their modernization cycle consistently report that the platform pays for itself before the end of its first year of operation.
Immediate: Catastrophic Failure Avoidance
A single avoided failure on a primary processing or packaging line—encompassing lost production, emergency repair premiums, expedited parts freight, and missed customer orders—frequently exceeds the total annual cost of the analytics platform. For high-volume food manufacturers, this single-event ROI scenario alone justifies the investment and typically occurs within the first 90 days of deployment.
Timeline: 0–3 monthsIntermediate: OEE Uplift & Capacity Recovery
Sustained OEE improvements of 15–22% allow facilities to absorb growing customer demand without adding shifts, headcount, or new production lines. This "digital capacity" converts otherwise lost machine time into pure margin—directly impacting the plant's P&L every production cycle. Most facilities fully realize this value layer between months 3 and 12 of operation.
Timeline: 3–12 monthsLong-Term: Capex Rationalization
With precise data on asset health trajectories and lifecycle trends, plant directors can defer expensive equipment replacement and automation investments by 3–5 years while maintaining full reliability. This ability to time capital expenditures with precision—rather than replacing equipment prematurely out of uncertainty—creates a durable financial advantage that compounds across the entire facility portfolio.
Timeline: 12–36 monthsAverage reduction in unplanned downtime frequency across production lines within the first 6 months of analytics deployment.
Sustained OEE uplift from eliminating chronic micro-stoppages and optimizing maintenance timing across critical assets.
Reduction in total maintenance spend by eliminating emergency labor premiums, expedited freight, and unnecessary preventive replacements.
Average extension of critical rotating equipment lifecycle through early detection of mechanical stressors before they reach terminal failure.
Deploying Analytics Management: A Three-Pillar Implementation Framework
Achieving full production line reliability through analytics management is not a single procurement decision—it is a structured architectural evolution. Facilities that succeed follow a phased implementation sequence that delivers measurable value at each stage, ensuring organizational buy-in and a self-funding modernization cycle where savings from early phases finance the deployment of subsequent ones. The framework below outlines the three foundational pillars that define a mature analytics management infrastructure. To receive a facility-specific deployment roadmap, Book a Demo with our reliability engineering team today.
Universal Connectivity & Data Infrastructure
Establish a unified IoT data pipeline that ingests sensor data, PLC outputs, SCADA feeds, and manual process records into a single, normalized asset health schema. This foundational layer eliminates data silos and creates the single source of truth required for all downstream analytics functions—regardless of the age, manufacturer, or communication protocol of individual assets.
Phase Duration: 2–4 WeeksPredictive Health Modeling & Alerting
Deploy AI failure models calibrated to food manufacturing equipment profiles, establishing baseline health signatures for each critical asset and activating anomaly detection. Automated work order triggers push predictive alerts and diagnostic context directly into the existing CMMS workflow—ensuring that every AI-generated insight results in a concrete, time-bound maintenance action.
Phase Duration: 4–8 WeeksPrescriptive Optimization & Continuous Improvement
Integrate reliability data with production scheduling, energy management, and enterprise demand forecasts. At this maturity level, the platform automatically recommends line speed adjustments, maintenance window placements, and capital deferral decisions based on real-time asset health trends—enabling the facility to optimize throughput, cost, and reliability simultaneously rather than trading one off against another.
Phase Duration: OngoingAnalytics Management for Production Line Reliability — FAQs
What types of production line assets benefit most from analytics management?
Rotating assets—motors, pumps, gearboxes, centrifuges, and compressors—deliver the highest immediate ROI from analytics management because their failure modes produce detectable data signatures weeks before the failure occurs. However, the platform's production analytics and OEE modules also generate significant value on conveyors, packaging lines, fillers, and homogenizers by quantifying throughput losses and quality drift events.
How does a manufacturing execution system integrate with predictive maintenance software?
Modern industrial analytics platforms connect to manufacturing execution systems via standard APIs or direct database integrations, enabling bidirectional data flow. Production orders, shift schedules, and changeover plans inform the predictive models, while asset health alerts and failure predictions flow back into the MES to adjust production scheduling around impending maintenance needs—creating a closed-loop reliability and production planning system.
Can analytics management work on legacy production equipment without existing PLCs?
Yes. Legacy assets that predate the PLC era often generate the highest ROI from analytics management precisely because they have operated without any data visibility for years. Non-intrusive wireless vibration and temperature sensors can be installed on any motor, pump, or gearbox in minutes—bringing modern condition monitoring to any asset regardless of its age, OEM, or existing communication infrastructure.
What is the typical payback period for a production line analytics deployment?
Most facilities achieve full payback within 6 to 12 months of deployment. For facilities with high unplanned downtime frequency, a single avoided catastrophic failure event—which can cost $200,000 to $500,000 in combined production loss, emergency repairs, and missed orders—often covers the entire first-year platform cost. OEE improvements and maintenance cost reductions compound the return in subsequent months.
How does production performance analytics differ from basic SCADA monitoring?
SCADA systems are primarily designed for real-time process control and alarm management—they display current machine states and trigger alerts when thresholds are crossed. Production performance analytics adds the intelligence layer on top of this data: trend analysis, failure probability scoring, OEE decomposition, bottleneck ranking, and prescriptive recommendations. The result is a shift from reactive alarm response to proactive reliability management.
Does deploying an industrial analytics platform require significant IT infrastructure investment?
No. Leading industrial analytics platforms use an edge-to-cloud architecture that operates independently of the facility's primary IT network via cellular gateway if required. This approach minimizes the burden on internal IT resources, reduces network security exposure, and enables rapid deployment without requiring infrastructure changes, firewall rule modifications, or extended IT project timelines.