In food manufacturing, the choice between analytics management software and manual systems is no longer a preference — it is a competitive and compliance imperative. Plants still relying on spreadsheets, paper logs, and siloed databases face an expanding risk surface: slower defect detection, regulatory exposure, and compounding inefficiencies that erode margins quarter by quarter. Meanwhile, facilities that have deployed computerized maintenance management systems, manufacturing execution systems, and unified industrial analytics platforms are operating at a measurably different level of performance. This comparison breaks down exactly where the gap is, why it grows, and what transitioning to a smart factory software environment actually delivers in operational terms. Book a demo with iFactory to see how your plant benchmarks against data-driven facilities today.
ANALYTICS SOFTWARE · FOOD MANUFACTURING · DIGITAL TRANSFORMATION
Analytics Management Software vs Manual Systems — See the Real Performance Gap
iFactory's unified manufacturing intelligence platform replaces fragmented spreadsheets and disconnected systems with real-time operational visibility, predictive analytics, and automated compliance — built specifically for food manufacturing environments.
Why Manual Systems Create Compounding Risk in Food Plant Operations
Manual systems — spreadsheets, paper-based maintenance logs, disconnected quality databases — were never designed to manage the data complexity of a modern food manufacturing operation. The problem is not that they fail immediately; it is that they fail silently and progressively. A maintenance log updated 12 hours after an event, a quality record compiled from three separate templates, a compliance checklist that exists only as a PDF on a shared drive — each of these represents a decision being made without reliable data. Understanding why book a demo requests from food plants have surged in 2026 means understanding what manual system risk actually looks like at scale.
Data Latency and Decision Lag
Manual data entry introduces hours or days of lag between an operational event and its representation in reporting systems. By the time a production supervisor reviews a manually compiled shift report, the production decisions that could have corrected the deviation have already passed. Operational analytics platforms eliminate this lag entirely — capturing events at the moment they occur and surfacing them in decision-ready formats in real time.
Human Error Accumulation
Research consistently shows that manual data entry environments operate with error rates of 1–5% per entry event. In a food plant processing hundreds of data points per shift, this means dozens of incorrect values entering reporting systems every day — errors that compound across weeks and months to produce trend analyses and compliance reports built on unreliable foundations.
Institutional Knowledge Dependency
Manual systems create invisible dependencies on specific individuals who understand how to navigate the complexity. When those individuals leave, the accumulated understanding of data relationships, workarounds, and interpretation conventions leaves with them.Digital transformation in manufacturing replaces tribal knowledge dependencies with documented, automated logic that is accessible to every team member regardless of tenure.
Compliance Exposure and Audit Vulnerability
Food manufacturers operating under FDA, FSMA, GFSI, and customer audit requirements face increasing documentation demands. Manual systems produce documentation that is difficult to verify, time-consuming to compile, and structurally vulnerable to gaps. Compliance management software with automated recordkeeping eliminates the 18–32 hour audit preparation cycles that manual environments require.
Scalability Ceiling
Manual systems do not scale. Every additional production line, SKU complexity increase, or volume growth adds proportional manual workload. Facilities that manage this through additional headcount discover quickly that data quality does not improve with headcount — it fragments further across more entry points and more interpretation inconsistencies.
Reactive-Only Decision Architecture
The fundamental structural limitation of manual systems is that they are constitutionally reactive. Data that arrives after the fact can only inform responses to events that have already occurred.Predictive maintenance software and process optimization software break this structural constraint — identifying patterns that precede failures and enabling intervention before the event, not after it.
Head-to-Head Comparison
Analytics Management Software vs Manual Systems — Complete Performance Comparison
The following comparison evaluates both approaches across the operational dimensions that matter most to food manufacturing performance, compliance, and competitiveness. This is not a theoretical comparison — these performance differentials are measured outcomes from facilities that have completed the transition from manual to enterprise asset management and unified analytics environments.
Analytics Management Software vs Manual Systems — Food Manufacturing Performance Analysis 2026
Core Capabilities
What Analytics Management Software Actually Delivers in Food Manufacturing
The value of manufacturing intelligence software is not in any single capability — it is in how integrated capabilities compound across the operation. Food plants that evaluate analytics software purely on feature lists frequently underestimate the system-level impact of unified data and contextual intelligence. These are the core capability domains where operational efficiency software creates measurable, sustained performance improvement. Food manufacturers evaluating these capabilities can book a demo to see each capability operating in a live production environment context.
01
Unified Data Integration Across All Operational Systems
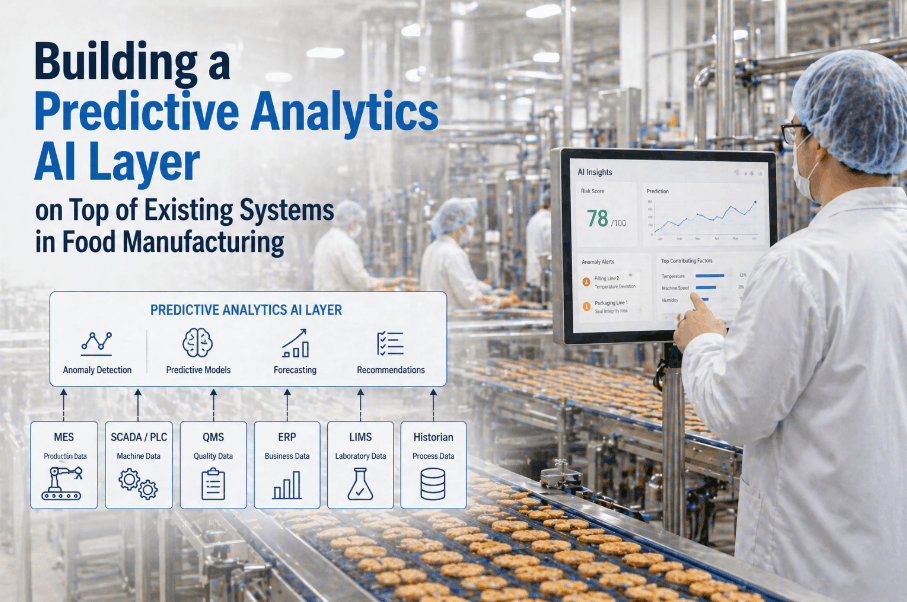
A genuine data integration platform connects ERP, MES, SCADA, quality management, and supplier systems into a single operational data layer. This eliminates the manual data compilation that consumes supervisor and analyst time in manual environments and removes the data inconsistency errors that arise when the same metric is tracked differently across multiple disconnected systems. The value of integration compounds — every additional system connected increases the analytical value of every other connected system through cross-functional correlation capability.
02
Predictive Maintenance and Equipment Health Monitoring
Predictive maintenance software trained on unified operational data identifies the specific patterns of performance degradation that precede equipment failures — hours or days before the failure occurs. This transforms maintenance from a cost center responding to breakdowns into a strategic capability preventing them. Food plants operating computerized maintenance management systems with predictive capability consistently report 60–75% reductions in unplanned downtime events compared to calendar-based maintenance protocols executed manually.
03
Real-Time Quality Analytics and Deviation Management
Manual quality systems catch defects after they occur — and often after the affected product has moved downstream in the process. Operational analytics platforms with real-time quality monitoring detect statistical process control deviations as they develop, enabling in-process correction before yield loss materializes. Automated hold triggers and deviation documentation eliminate the manual response workflow latency that turns small quality deviations into significant product loss events.
04
Automated Compliance and Traceability Infrastructure
Compliance management software in food manufacturing eliminates the most operationally disruptive aspect of regulatory and customer audit cycles: the documentation compilation process. With automated, continuous recordkeeping integrated into the operational workflow, compliance documentation is always current, always complete, and always accessible. The time-to-audit-readiness moves from days to hours — and the risk of documentation gaps that create regulatory exposure is structurally eliminated rather than managed through manual vigilance.
05
Process Optimization Analytics and Yield Improvement
Process optimization software identifies the operational variable relationships that drive yield performance — correlating ingredient variability, equipment performance, environmental conditions, and process parameters to surface the specific adjustments that maximize yield outcomes for each product and production configuration. Food plants operating manual systems have no systematic mechanism for identifying these relationships. The analytical capability gap translates directly into yield performance gaps that compound across every production run.
Transition Reality
Transitioning From Manual Systems to Analytics Software — What the Process Actually Looks Like
The most common objection food plants raise against transitioning from manual to digital transformation manufacturing environments is disruption risk: the fear that replacing familiar systems will create operational instability during the transition. Modern smart factory software architectures specifically address this concern — designed to integrate with existing systems rather than replace them, adding an intelligence layer above current infrastructure rather than requiring wholesale technology replacement. The transition is additive, not disruptive. Food plants that have reached out to book a demo with iFactory consistently report that the integration process created measurable improvement within the first operational month — not disruption.
1
Assessment and Integration Mapping (Weeks 1–2)
Document every current data system — including the informal ones that operations teams actually use versus the systems that appear in the technology register. Identify manual handoffs, data duplication points, and the highest-impact decisions currently made without reliable data support. This honest assessment forms the integration prioritization basis.
Outcome: Prioritized integration roadmap with quantified impact estimates per connection
2
Core System Integration and Data Validation (Weeks 3–6)
Connect the highest-priority operational systems — production, quality, and equipment monitoring — to the unified analytics layer. Establish data quality validation, consistent identifiers, and automated flow monitoring. Run parallel operation with existing manual processes during this phase to validate data integrity before transitioning fully to automated outputs.
Outcome: Reliable real-time visibility across core operations with validated data quality
3
Analytics Activation and Workflow Integration (Weeks 7–10)
Activate cross-functional analytics, configure automated alerts and root cause workflows, and integrate intelligence delivery into existing operational workflows. The goal at this phase is zero friction: insights must reach decision-makers within the tools and processes they already use, not require behavior change to access a separate analytics interface.
Outcome: Decision-ready analytics operating within existing operational workflows — adoption without friction
4
Predictive Model Deployment and ROI Measurement (Weeks 11–13)
With validated data foundation established, activate predictive maintenance, quality deviation early warning, and yield optimization models. Configure performance benchmarking against the pre-integration baseline to produce documented ROI measurement. Establish continuous improvement governance to ensure the analytics environment evolves with operational changes.
Outcome: Active predictive capability with documented, measurable ROI against manual system baseline
Spreadsheet Risk Analysis
The Hidden Cost of Spreadsheet-Based Management in Food Manufacturing
Spreadsheet risk management is not theoretical. Food manufacturers operating spreadsheet-based maintenance, quality, and compliance systems face a specific and well-documented failure profile. Spreadsheets are designed for analysis, not for operational data management at manufacturing scale — and the gap between what they are designed to do and what they are being asked to do creates structural risk that grows with every additional user, every additional data source, and every additional operational variable being tracked.
88%
of spreadsheets containing operational data have material errors that affect reporting accuracy
4.2x
longer root cause analysis in spreadsheet environments vs unified analytics platforms
$340K
average annual cost of unplanned downtime in food plants using manual maintenance management
67%
of food plant quality holds traced to documentation gaps originating in manual data environments
The financial case for transitioning from spreadsheet risk management to dedicated manufacturing intelligence software is straightforward. The operational cost of manual environments — in analyst time, error correction, compliance preparation, delayed defect response, and unplanned downtime — typically exceeds the investment in an integrated analytics platform within the first six to twelve months of deployment. The performance gains documented in facilities that have completed this transition confirm the pattern consistently. Food manufacturers ready to quantify this transition ROI for their specific operational context can book a demo with iFactory to run the numbers against your plant's actual cost structure.
Real-World Transition Result
A mid-sized dairy processing facility managing quality, maintenance, and compliance across five production lines through a combination of spreadsheets, shared drives, and paper-based maintenance logs underwent an independent operational assessment. Evaluators documented that production supervisors spent an average of 2.4 hours per shift compiling operational reports from disconnected sources — time that was not available for floor-level management and intervention. Root cause analysis for recurring quality deviations took an average of 4.1 days and frequently produced inconclusive results due to data gaps. After deploying a unified analytics management platform, report compilation time dropped to under 8 minutes (automated), root cause resolution averaged 11 minutes, and unplanned equipment downtime events decreased by 58% in the first production quarter. The annual operational time recaptured from manual reporting alone — at fully loaded labor cost — exceeded the annual platform investment by a factor of 2.7 before predictive maintenance savings were included.
Evaluating Analytics Management Software — What Food Manufacturers Need to Assess
Not all industrial analytics platforms are equal in their ability to deliver genuine operational impact in food manufacturing environments. The market contains a range of solutions from single-function tools to fully unified enterprise asset management platforms — and the difference between them is substantial in terms of the operational outcomes they can deliver. Food manufacturers evaluating options should assess these dimensions carefully before committing to a deployment.
Data Integration Depth
Does the platform connect to all critical operational systems — ERP, MES, SCADA, quality, maintenance, and supplier data — or only to a subset? Partial integration produces partial intelligence. The analytical value of unified data scales non-linearly: 80% integration does not produce 80% of the value of full integration because cross-functional correlation requires complete data coverage to be reliable.
Food Industry Compliance Support
Does the platform include built-in compliance documentation, traceability, and audit trail capabilities aligned with FDA, FSMA, GFSI, SQF, and major retailer audit requirements? Generic analytics platforms require significant customization to meet food industry regulatory standards — customization that adds cost, implementation time, and ongoing maintenance burden.
Adoption Architecture
How does the platform deliver insights to floor-level decision-makers? Analytics that require platform navigation, specialist interpretation, or separate login credentials will not be used consistently under production pressure. Look for push-based insight delivery integrated into existing operational workflows — not dashboards that require behavior change to access.
Implementation Without Disruption
Can the platform be deployed as an integration layer above existing systems — adding intelligence without requiring wholesale infrastructure replacement? The most effective smart factory software deployments in food manufacturing add capability incrementally, validating data quality and operational impact at each stage before advancing to predictive model activation.
AI and Predictive Model Readiness
Does the platform include a structured AI readiness assessment before attempting predictive model deployment? Predictive models deployed on poor-quality or incomplete data produce unreliable outputs that floor teams will reject — creating the worst possible outcome: AI investment that damages data trust rather than building it. Assess the platform's data quality validation infrastructure first.
Documented ROI Track Record
Can the platform vendor provide specific, documented performance outcomes from food manufacturing deployments comparable to your facility in scale, product type, and operational complexity? Claims of percentage improvement are easily made — demand case-specific evidence including baseline measurement methodology, outcome metrics, and timeline to measurable return.
FOOD MANUFACTURING · ANALYTICS TRANSFORMATION · 90-DAY ROI
Replace Manual Systems With Genuine Manufacturing Intelligence — Start With a Free Assessment
iFactory's unified analytics platform delivers the data integration, predictive capability, and compliance automation that food manufacturers need to close the performance gap between manual system operations and genuinely data-driven plants. The transition is faster and less disruptive than most facilities expect.
Frequently Asked Questions — Analytics Software vs Manual Systems in Food Manufacturing
What is analytics management software in food manufacturing?
Analytics management software in food manufacturing is a unified platform that collects, integrates, and analyzes operational data from production, quality, maintenance, and compliance systems to deliver real-time visibility and predictive insights. It replaces disconnected manual processes with automated, decision-ready intelligence that reaches floor-level decision-makers in real time — eliminating the data lag, human error, and analytical blind spots that characterize manual system environments.
Why are spreadsheets risky for food manufacturing management?
Spreadsheets introduce compounding risk through data entry errors, version control failures, siloed information, and structural inability to deliver real-time operational visibility. Research shows that 88% of operational spreadsheets contain material errors. In food manufacturing, these errors translate directly into delayed defect detection, compliance documentation gaps, and maintenance response failures that create regulatory exposure and operational losses. Dedicated analytics management software eliminates these structural risks by design.
How does predictive maintenance software differ from calendar-based maintenance?
Calendar-based maintenance schedules interventions at fixed time intervals regardless of actual equipment condition — resulting in unnecessary maintenance on healthy equipment and missed interventions on degrading equipment between scheduled cycles. Predictive maintenance software monitors actual equipment performance in real time and identifies degradation patterns that precede failures, scheduling interventions based on actual condition rather than arbitrary time intervals. Food plants using predictive maintenance consistently report 40–75% reductions in unplanned downtime compared to calendar-based protocols.
Can food plants transition to analytics software without replacing existing systems?
Yes. Modern analytics management platforms are architected as integration layers that connect to existing ERP, MES, SCADA, and quality systems via APIs — adding intelligence capability above current infrastructure without requiring replacement. This additive approach means food manufacturers can access the analytical benefits of a unified platform while preserving existing technology investments and avoiding the operational disruption of wholesale system replacement.
What ROI should food manufacturers expect from analytics software?
Food manufacturers deploying unified analytics management platforms typically document 20–28 percentage point OEE improvements, 60–75% reductions in unplanned downtime events, 60–65% reductions in yield loss rates, and 90% reductions in compliance documentation burden. Most deployments achieve full ROI within 6–12 months when all performance dimensions are included in the calculation. The highest-impact ROI drivers vary by facility — predictive maintenance savings dominate in equipment-intensive environments, while yield optimization dominates in ingredient-cost-sensitive operations.
How long does it take to implement analytics management software in a food plant?
A structured deployment of core integration capabilities — production, quality, and equipment monitoring — typically requires 6–8 weeks to achieve validated real-time visibility. Predictive analytics activation follows within 10–13 weeks once data quality is confirmed across the unified platform. The 90-day acceleration framework used by leading food manufacturing analytics platforms delivers measurable Stage 3 maturity — contextual cross-functional analytics with automated root cause capability — within the first production quarter.
Make the Transition in 2026
iFactory — Analytics Management Software Built for Food Manufacturing Reality
The performance gap between manual systems and genuine analytics management capability is measurable, growing, and increasingly consequential for competitive positioning, compliance standing, and operational margin. iFactory delivers the unified data integration, predictive analytics, and compliance automation that food manufacturers need to close this gap — with a structured transition framework that delivers measurable ROI within 90 days without replacing existing infrastructure.
Unified data integration across ERP, MES, SCADA, quality, and compliance systems
Real-time OEE, yield, and quality analytics without manual compilation
Predictive maintenance models reducing unplanned downtime by up to 75%
Automated compliance documentation and audit-ready traceability
AI readiness assessment and data quality validation before model deployment
90-day ROI framework with documented performance benchmarking