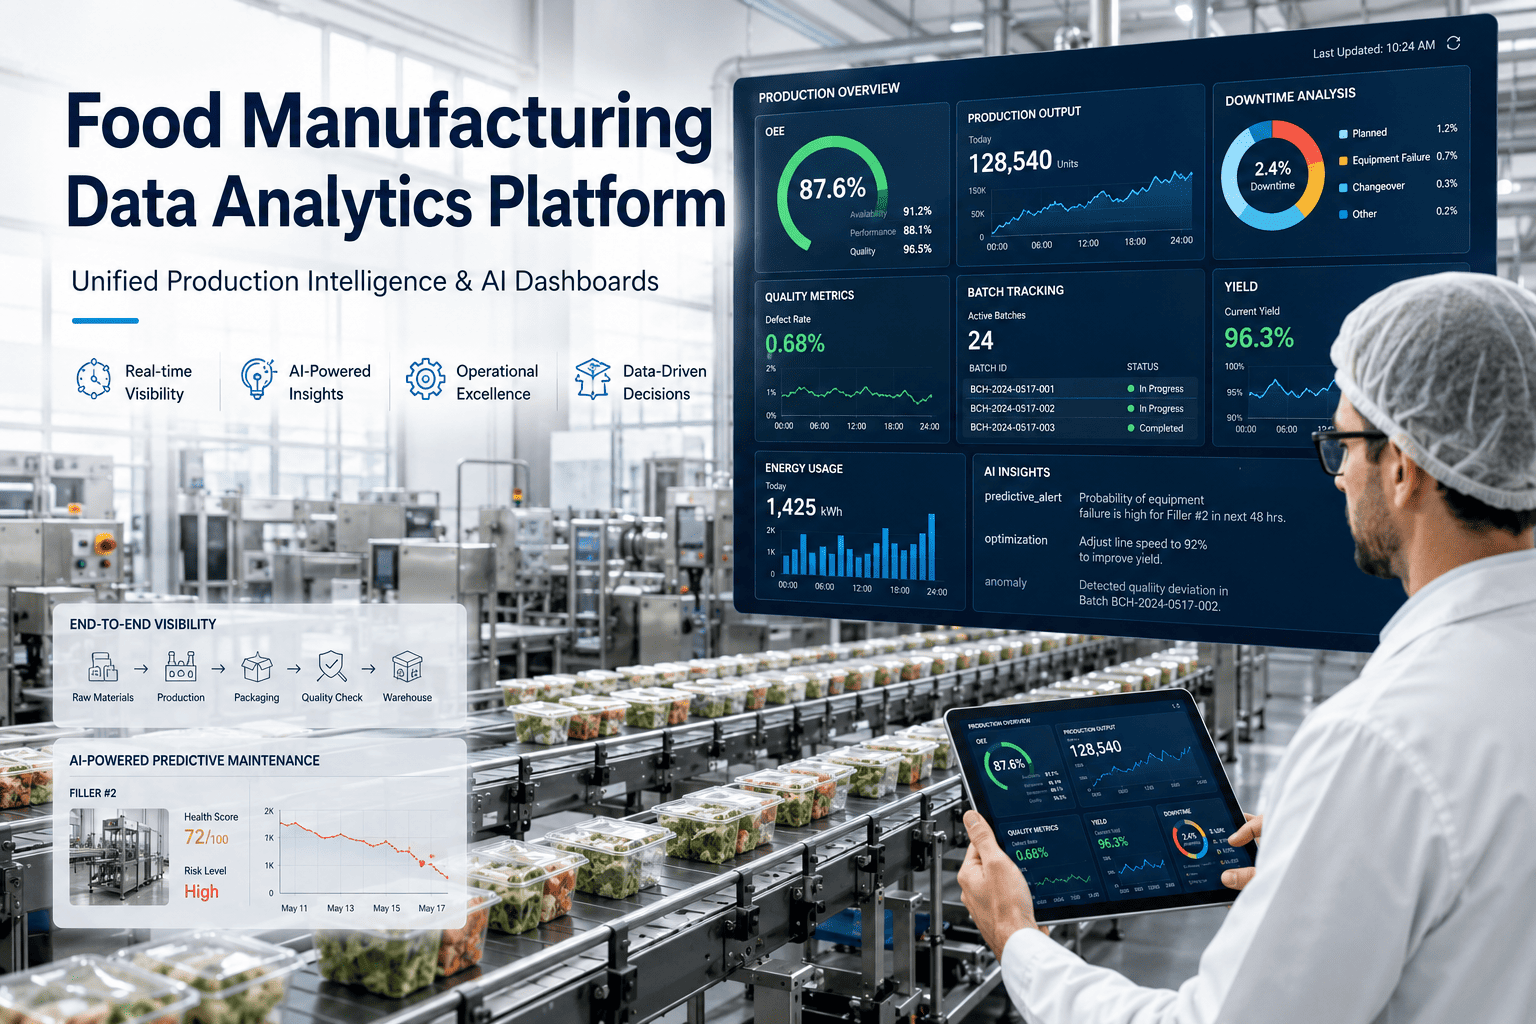
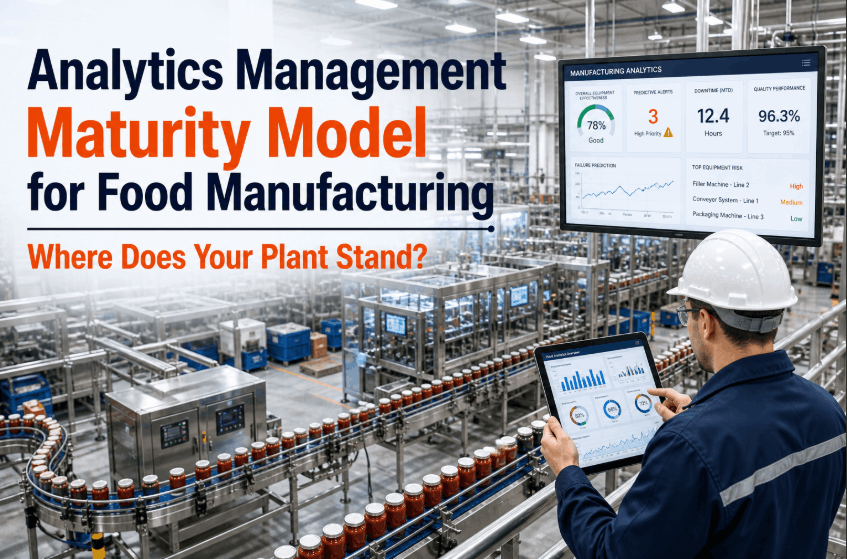
Food manufacturing has long relied on scheduled maintenance intervals and calendar-based upkeep to keep production lines running. But as equipment grows more complex and consumer demand more unforgiving, the rigid structure of preventive maintenance software is revealing its limits. The real competitive shift happening across mid-scale and enterprise food plants today is the transition toward predictive maintenance software — a move powered by industrial IoT monitoring, machine learning, and a new generation of operational analytics platform that turn raw sensor data into actionable production intelligence.
Why Preventive Maintenance Is No Longer Enough for Food Manufacturing
For decades, preventive maintenance operated on a simple premise: replace or service components on a fixed schedule before they fail. The logic is sound in theory — but in practice, it creates two costly failure modes. First, it generates unnecessary maintenance activity on equipment that is still performing well, consuming technician hours and spare parts that could be allocated elsewhere. Second, and more critically, it misses failure modes that don't follow predictable timelines. A bearing that degrades faster than expected due to a product viscosity change, or a filling valve that drifts out of tolerance due to seasonal thermal variation, will not wait for the scheduled service window.
Modern condition monitoring systems generate continuous vibration, temperature, pressure, and flow data that exposes exactly these irregular degradation patterns. When that data is processed through an industrial analytics platform with real-time anomaly detection, the maintenance team is no longer reacting to scheduled dates — they are responding to actual equipment condition. That is the core value proposition of the shift from preventive to predictive: replacing calendar-driven guesswork with evidence-based intervention timing. Book a demo to see how iFactory's platform models degradation curves across your critical assets in real time.
- Fixed service intervals regardless of equipment condition
- High unnecessary maintenance activity on healthy assets
- Misses non-calendar failure modes
- No visibility into real-time degradation patterns
- Relies on technician experience over data
- Reactive to failure when intervals are too long
- Condition-triggered intervention based on sensor data
- Maintenance only when and where it is needed
- Detects irregular and thermal-driven failure modes
- Continuous degradation curve visibility per asset
- AI-scored risk alerts calibrated to asset criticality
- Proactive intervention before failure window opens
The Role of AI Maintenance Software in Equipment Failure Prediction
AI maintenance software brings a capability that traditional CMMS platforms cannot replicate: the ability to learn failure signatures from historical work order and sensor data and apply those patterns prospectively across asset classes. In a food manufacturing context, this means the system can correlate a specific vibration frequency profile on a homogeniser bearing with work orders that preceded bearing failure over the previous 18 months — and flag a current asset exhibiting the same profile weeks before any human technician would notice a performance change.
Equipment failure prediction at this level of granularity changes the economics of maintenance entirely. Instead of absorbing the full cost of an unplanned stoppage — which in high-throughput food processing operations can reach $18,000 per 12-minute event — the maintenance team intervenes during a planned window, with the correct parts pre-staged and the right technician skill already assigned. The repair duration, the production impact, and the risk of secondary damage all compress simultaneously. Book a demo and see iFactory's failure prediction engine running against a live food plant asset profile.
Asset Performance Management: Connecting Sensor Intelligence to Production KPIs
The bridge between condition monitoring systems and operational outcomes is asset performance management — the discipline of tracking not just whether an asset is operational, but how efficiently it is converting energy and inputs into production throughput over time. In food manufacturing, where OEE targets often sit in the 72–85% range for benchmark performers, even a 2–3% improvement in asset availability translates directly to significant output gains without any capital expenditure on new equipment.
Anenterprise asset management platform connected to real-time sensor feeds can surface performance degradation before it becomes availability loss. A filling line drive running 4% below rated speed due to a gradually tightening chain tension is not flagging alarms, is not generating work orders, and is not visible on any dashboard that tracks only binary uptime. But it is costing the operation thousands of units per shift. Book a demo to see how iFactory's asset performance dashboards expose sub-threshold efficiency drift across your production assets.
Industrial IoT Monitoring: The Data Infrastructure Behind Predictive Analytics
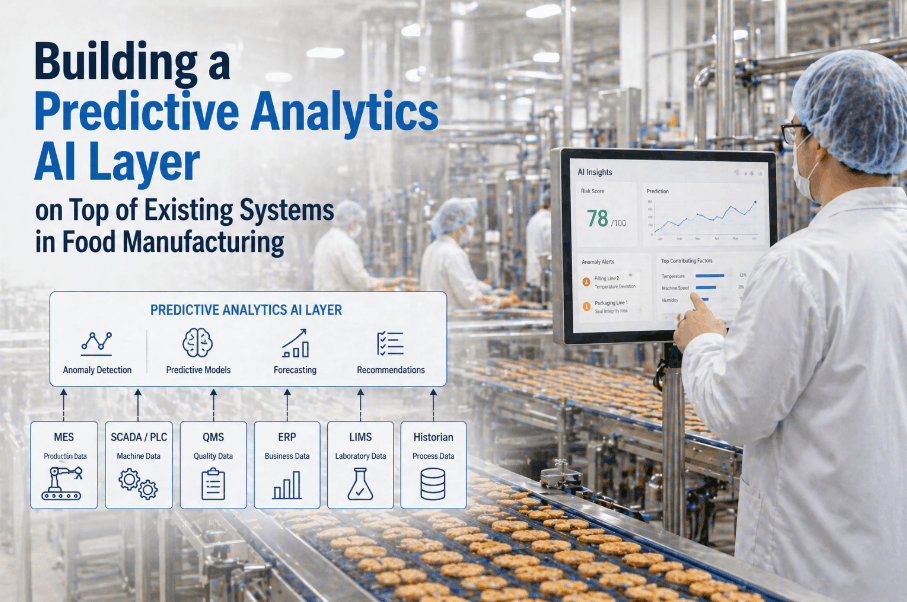
No predictive maintenance programme can function without reliable, high-frequency data from the assets it is meant to protect. Industrial IoT monitoring provides that foundation — connecting PLCs, SCADA historians, vibration sensors, thermal cameras, and process instrumentation into a unified data stream that feeds the manufacturing intelligence software layer above. In legacy food plant environments, this integration challenge is often cited as the primary barrier to adoption. The reality is that modern industrial IoT platforms are designed for brownfield deployment: they sit alongside existing automation infrastructure without requiring full MES replacement, ingesting data from OPC-UA, Modbus, and MQTT sources that most food plant controllers already support.
The value of consolidated IoT data only becomes apparent when it is contextualised against production schedules, asset maintenance history, and product changeover records. A temperature excursion on a CIP pump that occurs consistently within 20 minutes of a specific product flush cycle is not random — it is a process interaction signature that points to a specific intervention. Without the cross-system data context, it looks like noise. With it, it becomes a precisely actionable finding. Book a demo to see iFactory's IoT data integration layer connect to your existing plant infrastructure in a live demonstration.
The 4 Capabilities That Define a Modern Industrial Analytics Platform
Not all manufacturing intelligence software platforms are built for the specific operating conditions of food manufacturing. High sanitation requirements, frequent product changeovers, variable throughput rates, and strict food safety compliance reporting create a set of operational demands that generic industrial analytics tools often fail to meet. The four capabilities below define what a purpose-fit industrial analytics platform must deliver to drive real value in food plant environments.
Real-Time Anomaly Detection with Contextual Scoring
Anomaly detection that scores alerts by asset criticality, current production schedule impact, and failure probability rather than simple threshold exceedance. This eliminates alert fatigue and ensures the highest-consequence events receive immediate escalation — not equal treatment with minor sensor drift.
Failure Pattern Matching Across Asset Classes
Machine learning models trained on historical fault data and work order outcomes that identify recurring failure signatures across asset instances. A bearing failure pattern documented on Line 3 in Q1 becomes a proactive alert on a same-model bearing on Line 7 in Q2 — before the failure occurs.
Integrated Maintenance Management Software Workflow
Direct connection between predictive alerts and maintenance management software work order generation — so a detected anomaly automatically creates a prioritised work order with embedded sensor context, asset history, required parts, and safety procedures, reaching the technician's mobile device without manual intervention.
Reliability Engineering Software for Continuous Model Improvement
Reliability engineering software that ingests technician fault findings on work order closure and uses this feedback to refine failure prediction accuracy over time. Each resolved incident makes the model smarter — compounding detection precision across every shift and every asset class in the facility.
Digital Transformation in Manufacturing: Building the Business Case
Digital transformation manufacturing investments are scrutinised at capital budget level — and rightly so. The business case for transitioning from preventive to predictive analytics must be grounded in plant-specific financial data, not vendor benchmarks. The most defensible ROI model starts with three inputs your operations team already has: your average unplanned downtime events per quarter, your fully loaded cost per hour of production loss, and your current ratio of planned to unplanned maintenance work orders. These three numbers, combined with an honest assessment of your current alert-to-action response window, will almost always reveal that 30–50% of your total maintenance cost is attributable to events that a predictive system would have caught earlier — or eliminated entirely.
Plants that have completed this analysis consistently find that the payback period for a fully integrated operational analytics platform sits between 8 and 18 months depending on asset complexity and current OEE baseline. In high-throughput aseptic or continuous process environments, payback can be faster still — because the cost of a single avoided unplanned stoppage on a critical filler or homogeniser can exceed the full first-year platform cost.
| Asset Type | Primary Failure Mode | Predictive Signal | Avg. Cost of Unplanned Failure | Predictive Intervention Lead Time |
|---|---|---|---|---|
| Aseptic Filler | Seal wear, valve seat erosion | Pressure signature drift, fill weight variance | $25,000–$45,000 | 3–14 days |
| Homogeniser | Bearing failure, piston seal leak | Vibration frequency elevation, flow deviation | $18,000–$32,000 | 5–21 days |
| CIP Pump | Impeller wear, motor overload | Flow rate decline, current draw increase | $8,000–$15,000 | 2–10 days |
| Packaging Line Drive | Chain tension, gearbox wear | Speed deviation, torque signature | $6,000–$14,000 | 4–18 days |
| Compressor | Valve failure, oil contamination | Thermal profile, pressure ratio trend | $4,000–$10,000 | 7–28 days |
Reliability Engineering Software and the Feedback Loop That Compounds Value
The most underappreciated aspect of a mature predictive maintenance programme is the compounding improvement loop that reliability engineering software creates over time. In the first 60–90 days of deployment, the platform is learning — calibrating failure thresholds against your specific asset operating conditions, product ranges, and environmental variables. By months 4–6, the alert accuracy improves measurably as the model ingests closed work order findings and refines its failure signature library. By year two, plants report that the system is surfacing failure precursors 30–40% earlier than it did at go-live — not because the hardware changed, but because the model learned.
This learning loop also creates a documented asset health history that has significant value beyond maintenance cost reduction. In food manufacturing environments subject to FSMA, BRC, or SQF audits, the ability to demonstrate continuous equipment condition monitoring, automated alert escalation, and a closed-loop maintenance record for every critical asset is an audit differentiator. Smart factory analytics systems that integrate compliance reporting alongside operational performance dashboards eliminate the manual data assembly burden that currently consumes 3–5 hours of quality and maintenance management time before every third-party audit. Book a demo to see how iFactory's compliance-ready asset history module prepares your plant for audit without any additional reporting effort.
Frequently Asked Questions: Preventive to Predictive Analytics Transition
What is the difference between preventive and predictive maintenance software?
Preventive maintenance software manages fixed-interval service schedules based on time or usage thresholds. Predictive maintenance software uses real-time sensor data and machine learning to forecast when a specific asset is likely to fail — enabling condition-triggered interventions that are both more timely and more cost-effective than calendar-based maintenance.
How long does it take to implement a predictive analytics platform in a food manufacturing plant?
Basic condition monitoring and anomaly detection can be operational within 4–8 weeks using existing PLC and SCADA data connections. Full deployment including mobile technician dispatch, failure pattern modelling, and OEE dashboard integration typically takes 8–16 weeks for a mid-scale facility. Most plants achieve measurable MTTR improvement within 30–60 days of go-live.
Which assets deliver the fastest ROI from predictive maintenance in food manufacturing?
Assets with high failure cost, continuous operation requirements, and detectable degradation signatures deliver the best ROI: aseptic fillers, homogenisers, CIP pumps, compressors, and high-speed packaging drives. These combine high production impact on failure with clear sensor-based early warning windows of 3–28 days.
Can predictive maintenance software integrate with an existing CMMS or EAM platform?
Yes. Modern industrial analytics platforms are designed to integrate with major CMMS and enterprise asset management systems via API. Work orders, asset history, and parts data flow bidirectionally — ensuring the predictive layer enriches existing maintenance workflows rather than replacing the CMMS infrastructure the team already uses.
What data is required to begin equipment failure prediction?
At minimum, real-time sensor data from the target assets (vibration, temperature, pressure, or flow depending on asset type) plus 12–24 months of historical work order data. Richer historical fault data accelerates failure model training and improves prediction accuracy in the first 90 days of deployment.