Every food manufacturing plant generates operational data — but the difference between plants that struggle with recurring downtime, compliance gaps, and spiraling maintenance costs and those that consistently outperform often comes down to a single factor: analytics management maturity. The food manufacturing analytics maturity model is a structured framework that helps plant managers, operations directors, and reliability engineers objectively assess where their facility stands on the journey from reactive firefighting to AI-driven predictive intelligence. Whether you are evaluating your first industrial IoT analytics investment or benchmarking an existing operational analytics software deployment, understanding your maturity level is the essential first step toward building a roadmap that delivers measurable ROI. To see how leading food manufacturers are accelerating through the maturity curve, Book a Demo and explore what a structured analytics transformation looks like for your facility.
Assess Your Plant's Analytics Maturity — Then Build a Roadmap to Close the Gap
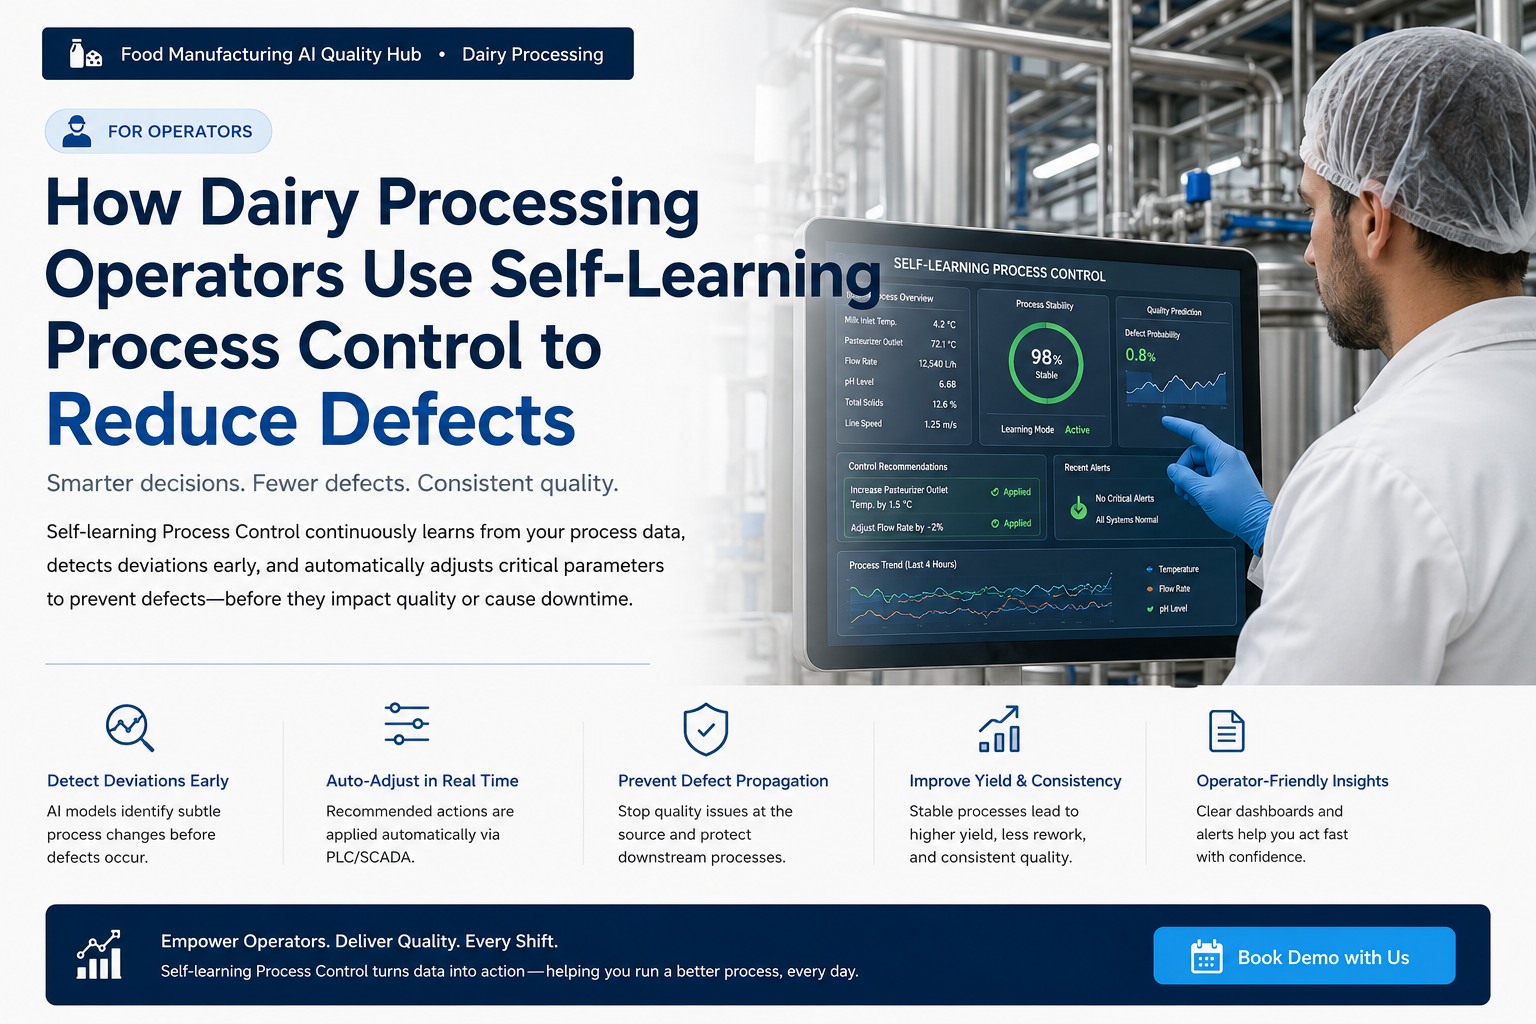
iFactory's manufacturing intelligence platform gives food processors real-time equipment health scoring, AI readiness benchmarking, and a structured digital transformation roadmap purpose-built for operational excellence in food and beverage manufacturing.
What Is the Analytics Management Maturity Model for Food Manufacturing?
The manufacturing maturity model applied to analytics management is a five-level progression framework that maps a food plant's current state of data utilization, maintenance strategy, and equipment monitoring capability against a defined benchmark of operational best practice. Unlike generic models, a food manufacturing-specific framework accounts for the unique intersection of FSMA compliance requirements, HACCP critical control point monitoring, cold chain integrity obligations, and the equipment complexity of food-grade processing environments. Understanding where your plant sits on this five-level scale gives operations leadership the clarity needed to prioritize analytics investments, sequence technology deployments, and build internal capability in the correct order.
The Five Levels of Food Manufacturing Analytics Maturity
Each maturity level represents a distinct combination of data capability, maintenance strategy, technology infrastructure, and organizational behavior. The value of the framework is in identifying the precise capability gaps that, when closed, unlock the greatest performance and compliance improvements for each specific facility type.
Reactive Operations — No Structured Analytics
Maintenance is triggered by equipment failure, not condition data. Operational records are paper-based, compliance documentation is assembled manually, and equipment health relies on operator intuition. Facilities here experience the highest rates of unplanned downtime and emergency procurement costs.
Scheduled Maintenance — Basic Data Collection
Calendar-driven maintenance programs are in place with basic CMMS usage and some digital data capture. Data remains siloed across systems and preventive tasks execute on fixed schedules regardless of actual equipment condition, leading to premature replacements and interval-based failures.
Condition-Based Monitoring — Integrated Operational Data
Sensor infrastructure is deployed on critical assets with real-time threshold alerts notifying maintenance teams of deviations. Data integration between CMMS, process historian, and quality systems begins enabling cross-functional analysis. This is the inflection point where asset performance management starts delivering measurable ROI. Plants at Level 3 can Book a Demo to identify which AI capabilities their existing infrastructure can immediately support.
Predictive Analytics — AI-Driven Maintenance and Quality Intelligence
Machine learning models predict failures days to weeks in advance. Condition-based work orders are generated automatically, quality monitoring correlates with equipment health data, and compliance documentation is produced from instrumented process data. Enterprise visibility across multiple lines is available through unified performance dashboards.
Autonomous Optimization — Self-Learning Manufacturing Intelligence
AI systems continuously optimize process parameters, maintenance scheduling, and resource allocation based on real-time operational context. Production schedules adapt dynamically to equipment health scores and fewer than 2% of global food manufacturing facilities operate at this level today.
AI Readiness Assessment: The Four Dimensions That Determine Your Maturity Score
A rigorous AI readiness assessment for food manufacturing evaluates plant capability across four structural dimensions — data infrastructure, maintenance strategy, organizational capability, and technology integration depth. Scoring across these dimensions identifies the specific gaps representing the highest-leverage improvement opportunities. Food plants exploring a formal assessment can Book a Demo to walk through a structured evaluation of their specific operational environment.
Data Infrastructure and Sensor Coverage
Evaluates instrumentation completeness, data capture frequency, and integration between operational systems. Without continuous sensor coverage on critical assets, predictive analytics cannot be deployed regardless of software sophistication.
Maintenance Strategy and Work Order Execution
Examines the ratio of planned-to-reactive maintenance, CMMS utilization depth, and how much maintenance decisions rely on condition data versus fixed schedules. This dimension directly correlates with downtime frequency and emergency cost structure.
Organizational Analytics Capability
Assesses internal skills, roles, and decision-making processes that determine how effectively operational data translates into action. Strong infrastructure with weak analytical capability consistently underperforms its technology investment.
Technology Integration and Compliance Automation
Measures integration between operational technology, information systems, and regulatory documentation workflows. High integration — where health events automatically trigger compliance records and work orders — defines Level 4 and Level 5 operations.
Food Manufacturing Maturity vs. Analytics Capability: Where Is the Industry Today?
The table below maps current industry distribution across maturity levels against the analytics and technology capabilities that define each stage — providing a precise benchmark for food plant leadership teams assessing their operational position.
| Maturity Level | Maintenance Strategy | Analytics Capability | Compliance Posture | Industry Distribution |
|---|---|---|---|---|
| Level 1 — Reactive | Breakdown-triggered | No structured analytics | Manual, audit-reactive | ~38% of plants |
| Level 2 — Scheduled | Calendar-based PM | Basic data collection | Paper + spreadsheet | ~35% of plants |
| Level 3 — Condition-Based | Threshold-triggered | Real-time monitoring | Partially automated | ~18% of plants |
| Level 4 — Predictive | Condition-based CBM | AI failure prediction | Automated + integrated | ~7% of plants |
| Level 5 — Autonomous | Self-optimizing | Closed-loop AI | Continuous audit-ready | <2% of plants |
Key Equipment Categories That Define Analytics Maturity in Food Plants
Analytics maturity is most visibly expressed through the monitoring sophistication applied to equipment categories where failure consequences are highest — thermal processing systems, refrigeration infrastructure, CIP-intensive sanitation equipment, and high-speed packaging lines. Food plant operations teams interested in benchmarking their specific asset monitoring depth can Book a Demo to review a structured asset criticality assessment tailored to their processing environment.
Retorts, Pasteurizers, and Heat Exchanger Monitoring
Temperature deviations that breach CCP limits trigger immediate regulatory notifications and product condemnation risk. Analytics maturity here progresses from manual log review to AI-powered hold tube trending and automated CCP deviation alerting — where compliance documentation value alone justifies the monitoring investment.
Cold Chain Compressor and Condenser Health Scoring
Refrigeration failures combine product loss, shelf-life recalculation, and cold chain violation risk into a single costly event. Predictive compressor health scoring detects refrigerant degradation and condenser decline weeks before thermal threshold violations — converting emergencies into planned maintenance windows.
Clean-in-Place Effectiveness and Sanitation Validation Analytics
Ineffective sanitation creates microbiological contamination risk that propagates through production runs. AI-validated CIP cycle scoring automatically flags deviations from validated temperature, chemical concentration, and flow velocity parameters — delivering among the highest food safety ROI improvements through analytics investment.
High-Speed Filler and Sealing System Performance Analytics
Sealer performance degradation produces seal integrity failures with downstream food safety implications. AI-driven monitoring tracks fill weight consistency and seal pressure profiles to detect tooling wear and valve degradation before quality or safety thresholds are breached.
Building Your Digital Transformation Roadmap: Moving Up the Maturity Curve
The most common failure mode in food manufacturing digital transformation is attempting to move from Level 1 directly to Level 4 through a single large-scale technology deployment. A structured maturity progression roadmap sequences investments to generate measurable ROI at each stage, building organizational analytics fluency alongside technology deployment. Operations teams ready to build their specific progression roadmap can Book a Demo and work through a facility-specific maturity gap analysis.
Foundation: Sensor Deployment and Data Infrastructure
Non-invasive vibration, temperature, and current sensors are installed on the 10–15 highest-consequence assets during scheduled CIP or maintenance windows. CMMS integration is configured and asset health baselines begin accumulating from day one — no production interruption required.
Calibration: Baseline Modeling and Alert Workflow Design
AI models establish equipment-specific baselines across the full operational range including product changeovers and CIP transitions. Alert thresholds are calibrated to each asset's actual operating signature — eliminating false positives that erode technician confidence during early-stage deployment.
Integration: Cross-System Connectivity and Compliance Automation
Equipment health data integrates with quality management systems to correlate asset performance signals with product quality outcomes. CIP validation records, temperature deviation logs, and maintenance records are generated automatically — making regulatory audit readiness a continuous state.
Expansion: AI Model Refinement and Full-Facility Coverage
Predictive model accuracy improves continuously as equipment failure history accumulates across production seasons. Monitoring expands to secondary equipment categories, and enterprise-level benchmarking across lines and shifts enables systematic OEE improvement and targeted capital investment prioritization.
The Business Case for Analytics Maturity Investment in Food Manufacturing
The financial case for advancing analytics maturity is built across five value dimensions that compound in ROI impact as maturity level increases. Unplanned downtime elimination delivers immediate payback — a single prevented line stoppage in a high-throughput facility typically recovers more than the annual cost of the monitoring platform that prevented it. Emergency maintenance cost reduction follows closely as planned procurement replaces premium-cost emergency sourcing. Extended equipment service life from condition-optimized maintenance intervals reduces capital replacement expenditure over multi-year timeframes. Energy efficiency improvements from fouling detection and process optimization compound silently across thousands of operating hours. And food safety event avoidance — the prevented product recall, the regulatory action that never escalated — delivers risk-adjusted value that every food manufacturing leadership team fully understands.
Frequently Asked Questions: Analytics Maturity Model for Food Manufacturing
How do I determine which analytics maturity level my food plant is currently operating at?
A structured AI readiness assessment evaluates your facility across data infrastructure, maintenance strategy, organizational capability, and technology integration depth. Scoring across these four dimensions maps to a maturity level and identifies the specific capability gaps with the highest ROI potential for your facility type.
What is the minimum data infrastructure required to begin deploying predictive maintenance analytics?
Modern predictive maintenance platforms use non-invasive sensors that install during scheduled CIP or maintenance windows — no existing PLC integration or historian infrastructure required. A basic CMMS for work order connection is the only software prerequisite for Level 3-to-4 progression.
How does analytics maturity improvement affect FDA and FSMA compliance posture?
Higher analytics maturity automates documentation workflows that define audit readiness — CIP validation records, CCP temperature logs, and maintenance reports are generated by instrumented systems rather than manual entry. Level 4 operations maintain continuous audit readiness rather than periodic compliance preparation cycles.
How long does it take to move from analytics maturity Level 2 to Level 4?
A structured deployment program typically requires 12–18 months across four phases. Timeline varies based on facility scale, existing infrastructure depth, and the initial asset monitoring scope selected for priority deployment.
What ROI can food manufacturers realistically expect from advancing their analytics maturity level?
ROI compounds across the maturity progression — Level 1-to-2 delivers compliance and labor efficiency gains, Level 2-to-3 delivers measurable downtime reduction, and Level 3-to-4 delivers the highest concentration through predictive failure prevention. Most high-throughput facilities recover full platform investment within 8–14 months through downtime prevention alone.
Can small and mid-sized food manufacturing plants benefit from an analytics maturity framework?
Yes. The maturity framework is scale-agnostic — facilities with as few as two or three critical processing lines benefit from structured condition monitoring and compliance automation. Phased deployment models allow smaller plants to start with priority assets and expand as initial ROI is validated.
How does the analytics maturity model support multi-site food manufacturing operations?
At Level 4 and above, enterprise dashboards provide unified equipment health visibility across multiple facilities — enabling corporate teams to benchmark site performance, allocate capital based on objective asset health data, and standardize predictive maintenance practices across the full manufacturing network.
Ready to Identify Where Your Plant Stands and Build a Clear Path to Analytics Maturity Level 4?
iFactory's manufacturing intelligence platform gives food processing operations a structured AI readiness assessment, real-time equipment health scoring, and a phased digital transformation roadmap — so your next equipment failure becomes a scheduled maintenance event, not a production emergency.