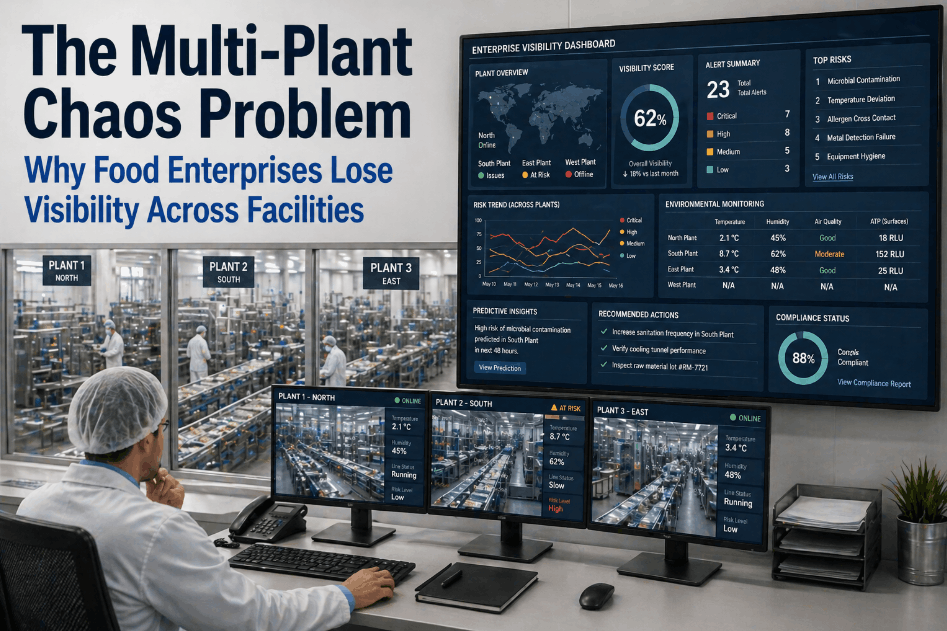
Enterprise analytics management for multi-plant food operations has become the defining competitive differentiator between food manufacturers that scale efficiently and those that hemorrhage margin across disconnected facilities. When your organization operates five, ten, or twenty production sites — each running independent analytics systems, siloed dashboards, and fragmented asset data — you are not managing a food enterprise. You are managing dozens of isolated problems simultaneously, with no unified intelligence to detect cross-facility patterns, standardize reliability KPIs, or prevent systemic downtime before it cascades across your supply chain.
ENTERPRISE ANALYTICS
·
MULTI-PLANT OPERATIONS
·
AI-DRIVEN INTELLIGENCE
Unify Analytics Across Every Facility — Centralized Intelligence for Multi-Plant Food Enterprises
iFactory's enterprise analytics platform connects every plant, line, and asset across your entire food manufacturing network — delivering unified KPI visibility, cross-facility benchmarking, predictive maintenance intelligence, and standardized compliance reporting from a single centralized dashboard that scales with your operation.
Why Multi-Plant Food Manufacturers Need Centralized Enterprise Analytics Management
The structural challenge facing multi-plant food operations is not a lack of data — it is an overabundance of disconnected data that cannot be synthesized into actionable intelligence. Each facility generates terabytes of operational information daily: equipment sensor readings, OEE metrics, quality inspection logs, energy consumption data, maintenance work orders, and production throughput records. When this data lives in plant-level silos with no pathway to a centralized analytics management system, executive and operations leadership are making billion-dollar decisions from incomplete, stale, and incomparable information.
The shift to enterprise analytics management for food manufacturing enables what plant-level systems fundamentally cannot: cross-facility asset visibility, standardized KPI benchmarking that identifies performance gaps between plants, AI-driven predictive models trained on network-wide failure patterns, and real-time production intelligence that surfaces opportunities at the enterprise level before they disappear at the plant level. Food enterprises that have made this transition report 23–38% reductions in unplanned downtime, 18–27% improvements in OEE, and 40%+ reductions in the management overhead required to operate multiple facilities at scale. You can book a demo to see how leading food enterprises have operationalized this transition.
38%
average reduction in unplanned downtime after deploying centralized multi-plant analytics
6–12x
faster cross-facility KPI reporting vs. manual consolidation across disconnected plant systems
27%
OEE improvement from cross-plant benchmarking and standardized analytics deployment
$4.7M
average annual savings for a 5-plant food operation from unified predictive analytics
Core Challenges
The Five Critical Failures of Disconnected Multi-Plant Analytics Systems
Most food enterprises operating multiple manufacturing sites have not intentionally built fragmented analytics architectures — they have inherited them through acquisitions, organic growth, and plant-level technology decisions made without enterprise alignment. These are the five systemic failures that consistently appear when multi-plant food manufacturers operate without a centralized analytics dashboard.
No Cross-Plant Asset Visibility
Independent CMMS at each facility means enterprise leadership cannot see which plants run equipment beyond safe limits or compare maintenance investment across sites. Asset decisions are made locally with no network-wide intelligence to prevent systemic failures.
Incomparable KPI Reporting Across Facilities
When plants calculate OEE and downtime using different formulas, cross-facility benchmarking becomes meaningless. Teams spend 60–80% of reporting time reconciling inconsistencies instead of acting on real performance gaps.
Reactive Maintenance Without Predictive Intelligence
Plant-level systems log failures but cannot detect cross-network patterns. A recurring motor failure across five sites is a predictive opportunity — invisible in siloed data but immediately actionable through enterprise-wide asset analytics.
Manual Compliance Reporting Across Jurisdictions
Without centralized documentation, each facility manually assembles audit records independently. An FDA inspection creates unnecessary risk and diverts operational resources when compliance data cannot be generated from a single platform instantly.
Inability to Identify Best-Practice Plants
A plant achieving 92% OEE while peers average 74% holds valuable operational knowledge — but siloed analytics make it invisible. Without enterprise benchmarking, best practices stay trapped in one facility and never reach underperforming sites.
Fragmented Energy and Sustainability Data
Multi-plant operations without integrated energy monitoring cannot generate accurate Scope 1 and Scope 2 emissions data or sustainability KPIs — creating compliance exposure and commercial risk with sustainability-focused retail customers.
Strategic Framework
Enterprise Analytics Management Architecture — Building Unified Intelligence Across Multiple Plants
Successful enterprise analytics management for multi-plant food operations is not achieved by selecting the best plant-level analytics tool and deploying it uniformly. It requires a deliberate enterprise architecture that layers cross-facility data standardization, centralized analytics processing, and AI-driven intelligence in a sequence that delivers measurable ROI at each phase while building toward full network-wide optimization. Enterprise leaders who have executed this successfully follow a structured capability-building framework that prioritizes high-impact integration points over comprehensive but slow full-deployment approaches. If you want to see this architecture in action, book a demo with our enterprise team.
01
Establish a Universal Data Model Across All Facilities
A standardized data model gives every facility uniform asset naming, downtime codes, and KPI formulas — building the single enterprise schema that makes cross-plant analytics comparable. Most centralized analytics dashboard food manufacturing deployments complete this layer within 60–90 days without replacing existing plant systems.
02
Deploy Cross-Facility Asset Visibility and Lifecycle Management
With a unified data model live, teams gain real-time
global asset visibility — health scores, end-of-life alerts, and maintenance cost comparisons across every plant. This typically delivers 15–20% unplanned downtime reduction in the first quarter.
Book a demo to see asset health scoring across a live multi-plant network.
03
Implement Cross-Plant KPI Benchmarking and Performance Intelligence
Identical OEE, yield, and changeover formulas across all sites let leadership spot performance quartiles and quantify improvement gaps. A network with a top plant at 88% OEE and peers averaging 71% has a clear roadmap to generate $12–18M in additional revenue capacity without capital investment.
04
Activate Network-Wide AI-Driven Predictive Maintenance
ML models trained on failure data from every facility simultaneously deliver far better accuracy than single-plant models. When a bearing degradation pattern surfaces across the network, every plant receives advance warning and optimized intervention scheduling — preventing failures before they occur.
05
Centralize Compliance Documentation and Audit Readiness
Centralizing CCP records, maintenance logs, and supplier data cuts multi-facility FDA audit preparation from 3 days of manual assembly to under 2 hours. As FSMA 204 electronic recordkeeping requirements expand, this capability moves from a convenience to a compliance necessity.
06
Enable Enterprise-Level Production Network Optimization
Unified capacity and constraint data across all plants enables dynamic production allocation and maintenance scheduling with zero supply chain disruption. Food enterprises with 4+ facilities routinely unlock $8–15M in annual throughput value that siloed systems make completely invisible.
Book a demo to see network optimization in action.
Multi-Plant Analytics Performance: Siloed Systems vs. Enterprise Platform
How food enterprises perform across critical operational and financial metrics when managing multi-plant analytics independently versus through a unified enterprise analytics management platform.
Multi-Plant Food Operations Analytics Benchmark — 2026
Cross-Plant Standardization
Cross-Plant Standardization: The Operational Foundation of Enterprise Analytics
Cross-plant standardization is the operational prerequisite that most food enterprises underinvest in when deploying enterprise analytics management — and the root cause of most failed multi-plant analytics initiatives. Technology investments in centralized platforms deliver their expected ROI only when the underlying data flowing from each facility into the enterprise analytics layer is consistent, complete, and comparably structured. Without deliberate standardization, enterprises accumulate a more sophisticated version of the same fragmentation problem they were attempting to solve.
Asset Taxonomy Standardization
Every asset across all plants must share a consistent hierarchy — category, sub-category, criticality, and maintenance class. When Plant A and Plant B classify identical equipment differently, cross-facility benchmarking is impossible. Taxonomy remediation typically takes 45–90 days and pays dividends in every reporting cycle thereafter.
Downtime Coding Harmonization
Inconsistent downtime codes are the single biggest barrier to valid cross-plant OEE comparison. When the same event is coded differently at different sites, benchmarks measure coding habits, not real performance. A centralized analytics system enforces uniform codes through structured data entry that removes local interpretation.
KPI Formula Governance
A formal governance framework documents and enforces standardized calculation methods for OEE, yield, throughput, and quality defects across all facilities. This is an ongoing enterprise function — not a one-time project — that keeps metrics comparable as plants evolve, new lines are added, and configurations change.
Maintenance Strategy Alignment
Standardizing PM intervals, condition-monitoring thresholds, and spare parts classifications makes cross-plant maintenance comparison valid. When Plant C hits 94% PM compliance and Plant F hits 61%, standardized strategies confirm the gap is operational — not a difference in what was scheduled.
Technology Architecture
Selecting the Right Enterprise Analytics Management Platform for Multi-Plant Food Operations
The market for enterprise analytics management software for food manufacturing has matured significantly in the past three years, with purpose-built platforms emerging that address the specific regulatory, traceability, and operational requirements of multi-plant food enterprises — as distinct from the generic industrial analytics platforms that dominated early deployments. Selecting the right platform requires evaluating seven critical capability dimensions that determine whether a platform can deliver enterprise-scale value or is fundamentally a plant-level tool with a multi-tenant interface layered on top.
The most important distinction in platform selection for food enterprises is whether the system was architected for enterprise analytics from the ground up — with cross-facility data normalization, enterprise KPI governance, and network-level AI models as core design principles — or whether enterprise features were added incrementally to a plant-level CMMS or MES platform. Systems in the latter category consistently underperform on cross-plant benchmarking accuracy, AI model training data quality, and the compliance reporting consolidation that food manufacturers require for FSMA 204 and GFSI scheme compliance. You can book a demo to evaluate iFactory's enterprise architecture against your specific multi-plant requirements.
1
Native Multi-Tenancy with Enterprise Data Consolidation
The platform must deliver real-time plant-level operational views and enterprise-wide consolidation simultaneously — without batch delays or manual reconciliation. Each facility sees its own live data while leadership sees the full network picture instantly.
2
Configurable KPI Engine with Cross-Plant Formula Governance
The platform must enforce enterprise-standard KPI formulas across all facilities while supporting plant-level supplementary data. Standardized metrics protect benchmarking integrity; flexible data capture supports local operational decisions without corrupting network comparisons.
3
Network-Trained Predictive Analytics with Plant-Specific Deployment
AI models trained on all-plant failure data deliver far greater accuracy than single-site models. They should deploy with plant-specific calibration for equipment age, environment, and intensity — giving maintenance teams actionable, context-relevant recommendations they can actually execute.
4
Food Safety Compliance Integration for FSMA 204 and GFSI
The platform must natively handle CCP monitoring, lot traceability, environmental data, and supplier compliance — generating consolidated reports that satisfy FDA FSMA 204 and GFSI audit requirements across all facilities. Generic industrial platforms require costly custom builds to meet these food-specific standards.
5
Integration Depth with Existing Plant Technology Stacks
Pre-built connectors for the ERP, CMMS, SCADA, and MES systems already running in your network are non-negotiable. Deep integration — rich data flowing automatically — predicts long-term adoption success. Theoretical API compatibility that still requires manual data entry is not integration.
Enterprise Outcome
A global snack food manufacturer operating eleven facilities across North America and Europe deployed iFactory's enterprise analytics management platform after three years of failed attempts to achieve meaningful cross-plant benchmarking with plant-level CMMS tools. Within 90 days of deployment, the enterprise analytics layer identified that four facilities were operating critical packaging equipment at 140% of recommended maintenance intervals — a risk that was invisible to corporate operations because each plant's maintenance team had independently made the decision to extend intervals without enterprise visibility. The network-wide predictive maintenance model, trained on failure data from all eleven plants, generated maintenance intervention schedules that reduced unplanned downtime across the network by 31% within the first two operating quarters. Cross-plant OEE benchmarking revealed a 19-point performance gap between the best and worst-performing facilities — and the practice transfer program it enabled generated $6.2M in additional production capacity in the first year. The enterprise compliance reporting consolidation eliminated 340 hours of annual audit preparation work across the facility network.
Implementation Guide
Deploying Enterprise Analytics Management Across Multiple Food Manufacturing Plants — Implementation Roadmap
The enterprises that successfully deploy enterprise analytics management across multi-plant food operations follow a phased implementation model that generates operational value at each stage rather than requiring full deployment before ROI materializes. This 120-day roadmap has been validated across food enterprise deployments ranging from three to twenty-four facilities.
1
Enterprise Data Architecture Assessment (Days 1–30)
Audit every plant's technology stack — CMMS, ERP, SCADA, MES, LIMS — and map where manual handoffs create traceability and performance gaps. Define the enterprise data model and KPI governance framework, then identify two to three anchor plants for initial deployment based on performance range and integration complexity.
Outcome: Enterprise data model, KPI governance framework, and phased integration roadmap
2
Pilot Plant Deployment and Enterprise Baseline Establishment (Days 31–75)
Deploy the platform at two to three anchor facilities, complete system integrations, and validate data quality against the enterprise schema. Establish network-wide performance baselines across all KPIs and train plant teams on standardized data entry workflows that maintain cross-facility comparability from day one.
Outcome: Live enterprise dashboard with validated cross-plant KPI benchmarking for pilot facilities
3
Network-Wide Platform Rollout and AI Model Training (Days 76–105)
Extend deployment to all remaining facilities using the validated playbook. As each plant connects, network AI models gain training data and improve in accuracy. Activate best-practice transfer programs from benchmarking insights and centralize compliance reporting across all sites.
Outcome: Full network connected, AI models trained on multi-plant data, compliance reporting centralized
4
Enterprise Optimization and Continuous Improvement Activation (Days 106–120+)
Activate production network optimization using enterprise-wide capacity and maintenance data. Establish weekly KPI reviews, monthly benchmarking sessions, and automated alerts for network-level risk patterns. Measure and document ROI against the baselines set in Phase 2.
Outcome: Self-improving enterprise analytics operation with continuous ROI growth and full network optimization
Compliance Mapping
Regulatory Compliance Benefits of Centralized Multi-Plant Analytics Management
Enterprise analytics management delivers compliance value that extends well beyond operational efficiency. Multi-plant food manufacturers face multiplied regulatory exposure — each facility carrying independent FDA, USDA, and GFSI scheme compliance obligations — that a centralized platform addresses systematically across the network. The most impactful compliance capabilities of enterprise analytics management platforms are the ones that eliminate the manual effort currently consumed by compliance activities at each facility simultaneously.
FDA FSMA 204 — Multi-Facility Traceability Compliance
- Centralized Critical Tracking Event (CTE) documentation across all facilities
- Standardized Key Data Element (KDE) capture with network-wide consistency
- 24-hour lot traceability compliance met in under 8 minutes enterprise-wide
- Single FDA records request response covering all in-scope facilities
FSMA 204 compliance: automated across entire network
GFSI Scheme Compliance — SQF, BRC, FSSC 22000
- Standardized mock recall performance with enterprise traceability benchmarking
- Centralized audit documentation library accessible for all facility certifications
- Cross-facility food safety culture and system maturity benchmarking
- Enterprise-level corrective action tracking with network-wide closure verification
GFSI multi-site audit performance: consistently superior
FDA 21 CFR Part 117 — Preventive Controls
- Centralized CCP monitoring records with cross-facility deviation trend analysis
- Enterprise supplier verification program with network-wide approved supplier visibility
- Standardized environmental monitoring data with enterprise trend detection
- Consolidated corrective action records with enterprise-level effectiveness tracking
Preventive controls: enterprise documentation standard
Frequently Asked Questions
Enterprise Analytics Management for Multi-Plant Food Operations — FAQ
What is enterprise analytics management for multi-plant food operations?
It is the practice of centralizing operational, maintenance, quality, and compliance data from all facilities into one unified platform. This enables cross-plant benchmarking, AI-driven predictive maintenance, and standardized KPI reporting — turning disconnected plant data into network-wide intelligence.
How long does it take to deploy enterprise analytics across multiple food plants?
Most food enterprises achieve live cross-plant analytics within 75–90 days using a phased pilot-then-rollout model. Full network connectivity with AI predictive maintenance and consolidated compliance reporting typically completes within 105–120 days.
Can enterprise analytics platforms integrate with existing plant CMMS and ERP systems?
Yes. Purpose-built platforms maintain pre-built connectors for SAP, Oracle, IBM Maximo, Rockwell, Siemens, and others — so existing plant systems keep running. The enterprise analytics layer sits on top, normalizing and consolidating data without any rip-and-replace disruption.
What ROI can a multi-plant food enterprise expect from centralized analytics management?
Enterprises with 4–10 facilities typically achieve full ROI within 8–12 months through downtime reduction (23–38%), OEE improvement (18–27%), and compliance time savings (90%). For a 6-plant operation, annual value typically reaches $4–8M — often 4–8x the platform investment.
How does cross-plant standardization work when facilities have different equipment?
Standardization operates at the data and KPI definition layer — not the process layer. Each plant keeps its own equipment and workflows while feeding consistently structured data into the enterprise platform through standardized asset taxonomy, downtime codes, and KPI formulas.
What makes food manufacturing enterprise analytics different from general industrial analytics?
Food manufacturing platforms must natively handle lot traceability, CCP monitoring, LIMS integration, and supplier compliance — core FSMA 204 and GFSI requirements. General industrial platforms treat these as optional add-ons requiring costly custom builds to meet food-specific regulatory standards.
ENTERPRISE-READY
·
MULTI-PLANT INTELLIGENCE
·
FSMA 204 COMPLIANT
Deploy Enterprise Analytics Management Across Your Entire Food Manufacturing Network
Stop managing multi-plant food operations with disconnected plant-level systems that cannot deliver the cross-facility intelligence your enterprise needs to compete. iFactory's enterprise analytics management platform unifies every facility into one centralized intelligence layer — delivering cross-plant benchmarking, network-wide AI predictive maintenance, standardized KPI governance, and consolidated compliance documentation that scales across your entire manufacturing network.