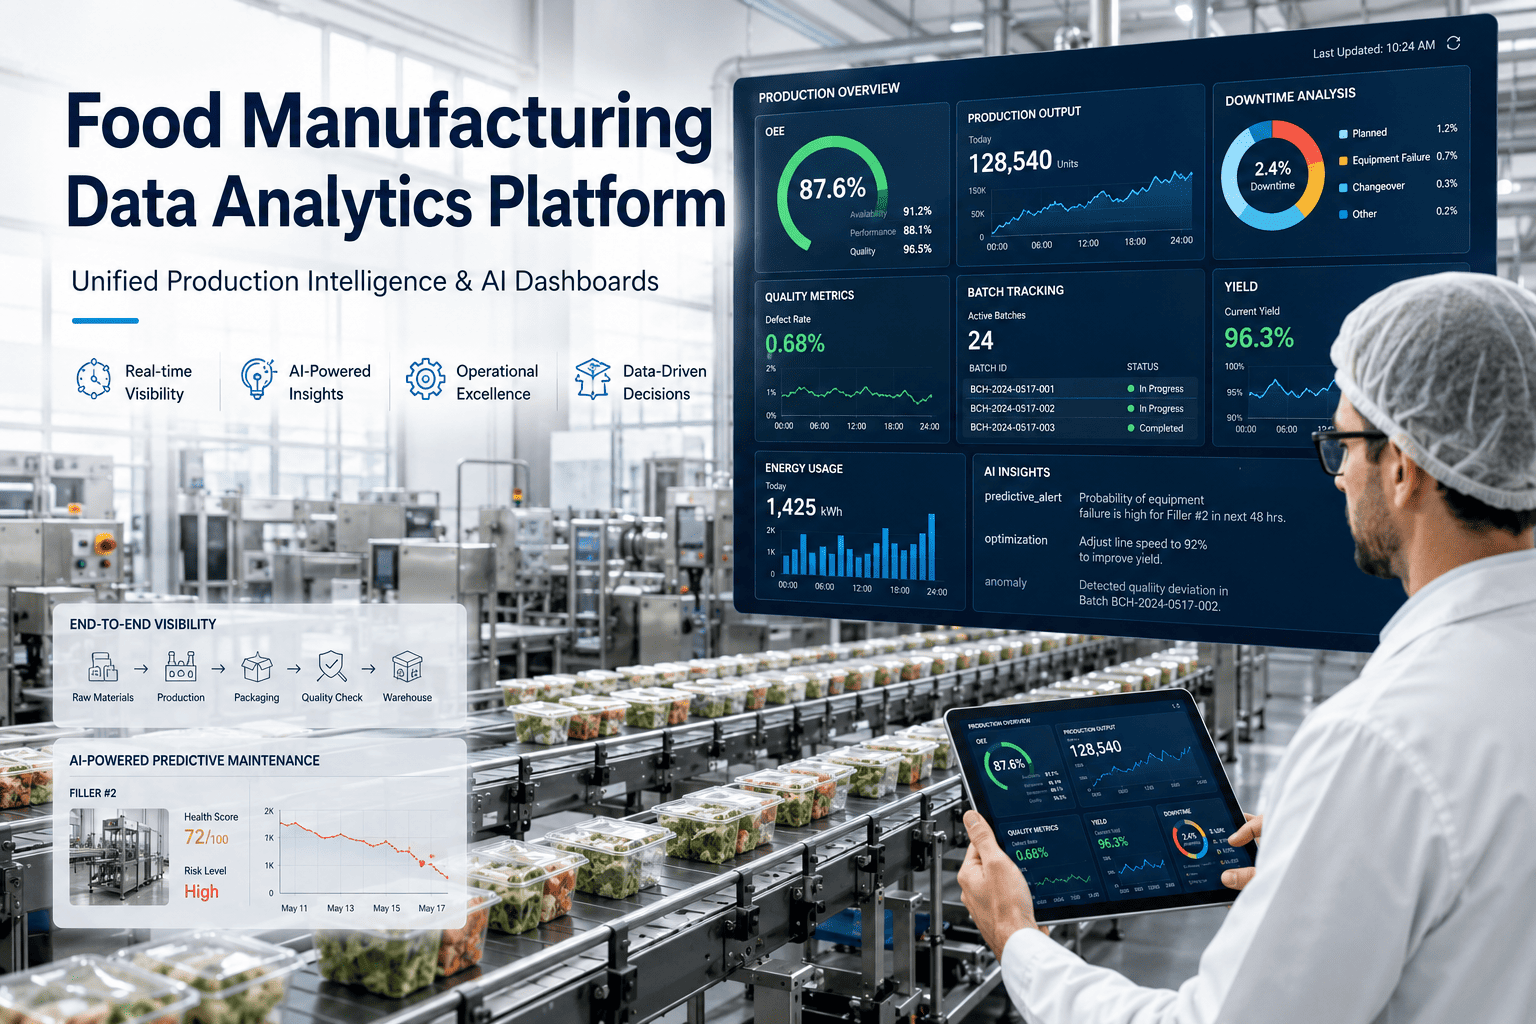
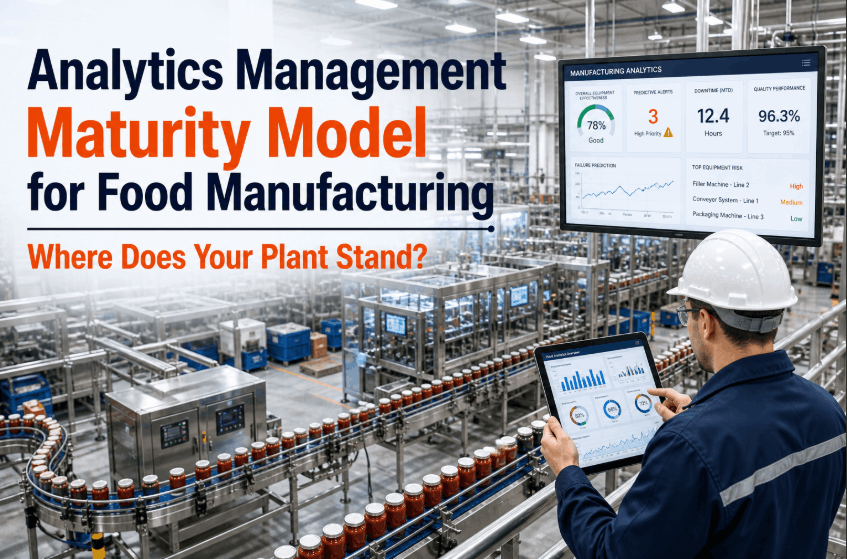
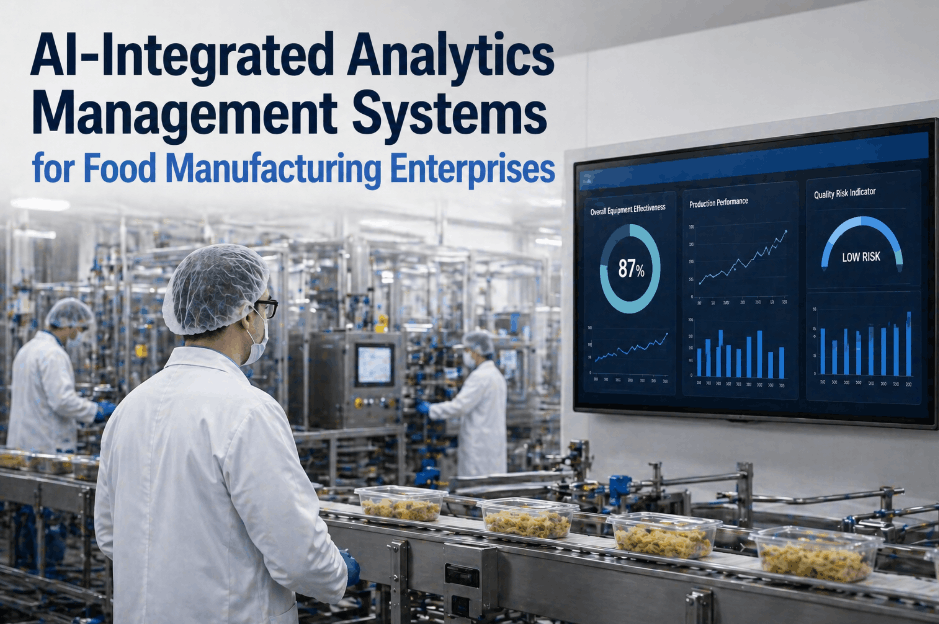
The era of reactive decision-making in food manufacturing is over. An AI analytics command center transforms how plant directors, reliability engineers, and operations leaders interpret real-time production data—consolidating every asset signal, line metric, and quality variable into a single, intelligent interface that thinks alongside your team. As competitive pressure intensifies and margin compression tightens, the facilities that win are those that replace guesswork with operational intelligence platforms capable of predicting failures, optimizing throughput, and accelerating every decision cycle across the enterprise. If your facility is still operating from fragmented dashboards and delayed reports, Book a Demo to see how iFactory's AI-driven command center redefines real-time plant visibility.
What Is an AI Analytics Command Center in Food Manufacturing?
A manufacturing intelligence command center is not simply a dashboard—it is a unified cognitive layer that ingests data from every PLC, sensor, SCADA system, and edge device across your facility and converts that raw signal into prioritized, prescriptive action. Unlike traditional manufacturing execution systems that report on what already happened, an AI-powered command center continuously models what is about to happen, alerting operators to emerging mechanical anomalies, energy inefficiencies, and quality deviations before they cascade into unplanned stoppages.
For food manufacturers operating under tightening regulatory scrutiny and demand volatility, the ability to monitor every production variable from a single real-time operations dashboard is no longer a competitive luxury—it is operational infrastructure. The command center becomes the nervous system of the smart factory: always listening, always processing, always protecting throughput. Many plant directors who transition to this model discover that the data they already generate contains the intelligence needed to eliminate their top five downtime causes within the first quarter. To understand how this applies to your specific environment, Book a Demo and speak with our reliability engineers today.
Unified Data Ingestion
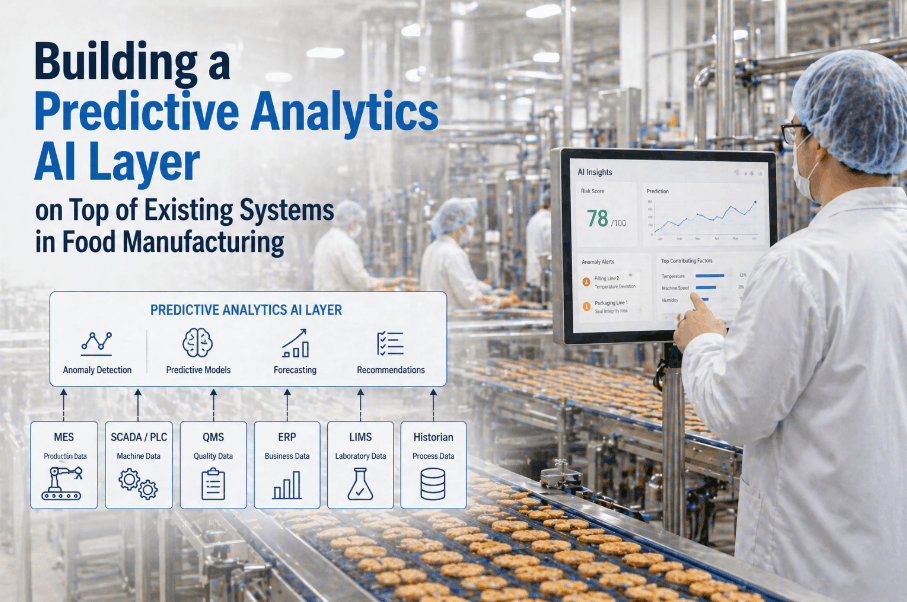
Aggregates data streams from legacy PLCs, wireless IoT sensors, energy meters, and manual inputs into a single normalized intelligence layer—eliminating the data silos that blind reliability teams to cross-asset risk patterns.
Foundation LayerPredictive Health Modeling
AI models trained on food manufacturing failure modes detect early signatures of bearing wear, thermal stress, and gearbox misalignment weeks before catastrophic failure—converting your maintenance team from reactive firefighters to proactive reliability engineers.
Intelligence LayerPrescriptive Workflow Automation
When the AI identifies an emerging failure, it doesn't just alert—it automatically generates a prioritized work order, routes it to the right technician, and estimates time-to-failure with precision, compressing the response window from hours to minutes.
Action LayerEnterprise Performance Analytics
Executive-level OEE dashboards give plant directors, CFOs, and supply chain leads a continuous, audit-ready view of facility performance—linking asset health data directly to production output, cost avoidance, and capital planning decisions.
Strategy LayerHow the AI Command Center Architecture Works: From Sensor to Decision
Understanding the technical architecture of a smart factory software platform clarifies why it delivers results that legacy systems cannot. The command center operates across three interconnected tiers—edge, cloud, and interface—each designed to minimize latency, maximize analytical depth, and ensure that every insight reaches the right person at the right moment. This is not a bolt-on reporting layer; it is a purpose-built industrial IoT platform that replaces the fragmented toolchain most food facilities currently operate with a cohesive, self-reinforcing intelligence network. Facilities that have deployed this architecture report that the command center surfaces patterns their experienced maintenance teams had never previously identified—not because those teams lacked expertise, but because the data volume exceeded human processing capacity. Book a Demo to explore how the architecture maps to your existing infrastructure.
Edge Data Acquisition
Wireless vibration, temperature, current, and pressure sensors deploy in minutes on any rotating asset—from high-speed centrifuges to simple conveyor motors. The edge gateway normalizes multi-protocol data streams from PLCs, SCADA, and IoT devices into a unified format before transmission, reducing cloud processing overhead and ensuring sub-millisecond data fidelity even in network-constrained environments.
AI Failure Pattern Recognition
Proprietary predictive maintenance software models analyze incoming sensor streams against a library of food manufacturing failure signatures. The AI distinguishes between normal process-induced vibration and genuine mechanical deterioration with 98% accuracy—eliminating the false alarms that erode maintenance team trust in traditional condition monitoring systems.
Command Center Interface & Workflow Dispatch
The unified operations dashboard presents asset health scores, risk rankings, and production KPIs in a single interface accessible from desktop, mobile, or integrated into your existing CMMS (SAP, Maximo, UpKeep). When the AI flags an anomaly, it dispatches a diagnostic work order automatically—ensuring zero-latency transition from detection to intervention without manual triage.
AI Command Center vs. Traditional Monitoring: A Comparative Performance Analysis
The performance gap between AI-driven operational analytics software and legacy monitoring tools is not incremental—it is structural. Traditional SCADA systems and point-solution sensors generate data but provide no analytical context; operators are left to interpret thousands of raw readings manually, a process that inherently lags behind the speed of mechanical failure. The AI command center closes this gap by converting data volume into prioritized intelligence at machine speed. The table below quantifies the operational impact across the metrics that matter most to plant directors, reliability leads, and financial stakeholders evaluating a modernization investment.
| Performance Metric | Legacy Monitoring Systems | AI Analytics Command Center | Improvement Factor |
|---|---|---|---|
| Failure Detection Lead Time | 0–2 hours (post-failure alert) | 2–6 weeks (pre-failure prediction) | Command Center: 100x earlier warning |
| Unplanned Downtime Frequency | High (reactive, break-fix cycle) | Minimal (condition-driven intervention) | –35% average reduction |
| OEE Baseline | 55–65% (industry average) | 75–85% (post-deployment) | +22% sustained OEE improvement |
| Maintenance Cost per Asset | 8.5x (emergency repair multiplier) | 1.0x (predictive service baseline) | –28% total maintenance spend |
| Asset Lifecycle Extension | Standard OEM lifecycle | Extended by condition optimization | +5 years average asset life |
| Time-to-Insight | Days (manual data review) | 48 hours post-deployment | Command Center: Near-instant baseline |
| Cross-Facility Scalability | Per-site licensed tools, high cost | Enterprise-wide at marginal cost | Exponential ROI at scale |
Six Mission-Critical Capabilities of an Industrial AI Analytics Command Center
The most effective production monitoring software deployments are defined not by their sensor count or dashboard complexity, but by the precision of the decisions they enable. iFactory's AI command center is engineered around six capabilities that address the highest-impact operational pain points in food manufacturing—each designed to deliver measurable ROI within the first production quarter. For a capability walkthrough tailored to your facility's asset mix, Book a Demo with our engineering team.
Real-Time OEE Tracking
Continuously calculates Overall Equipment Effectiveness across every line, shift, and facility—surfacing the micro-stoppages and speed losses that aggregate into significant throughput gaps invisible to manual reporting.
Vibration-Based Failure Prediction
Monitors frequency signatures of bearing wear, shaft misalignment, and mechanical imbalance on every rotating asset—predicting failure weeks in advance with precision that calendar-based maintenance schedules can never achieve.
Energy Consumption Intelligence
Correlates energy draw patterns with mechanical health data to identify assets consuming excessive power due to hidden deterioration—converting energy waste from an unavoidable cost into a leading indicator of impending failure.
Quality Drift Detection
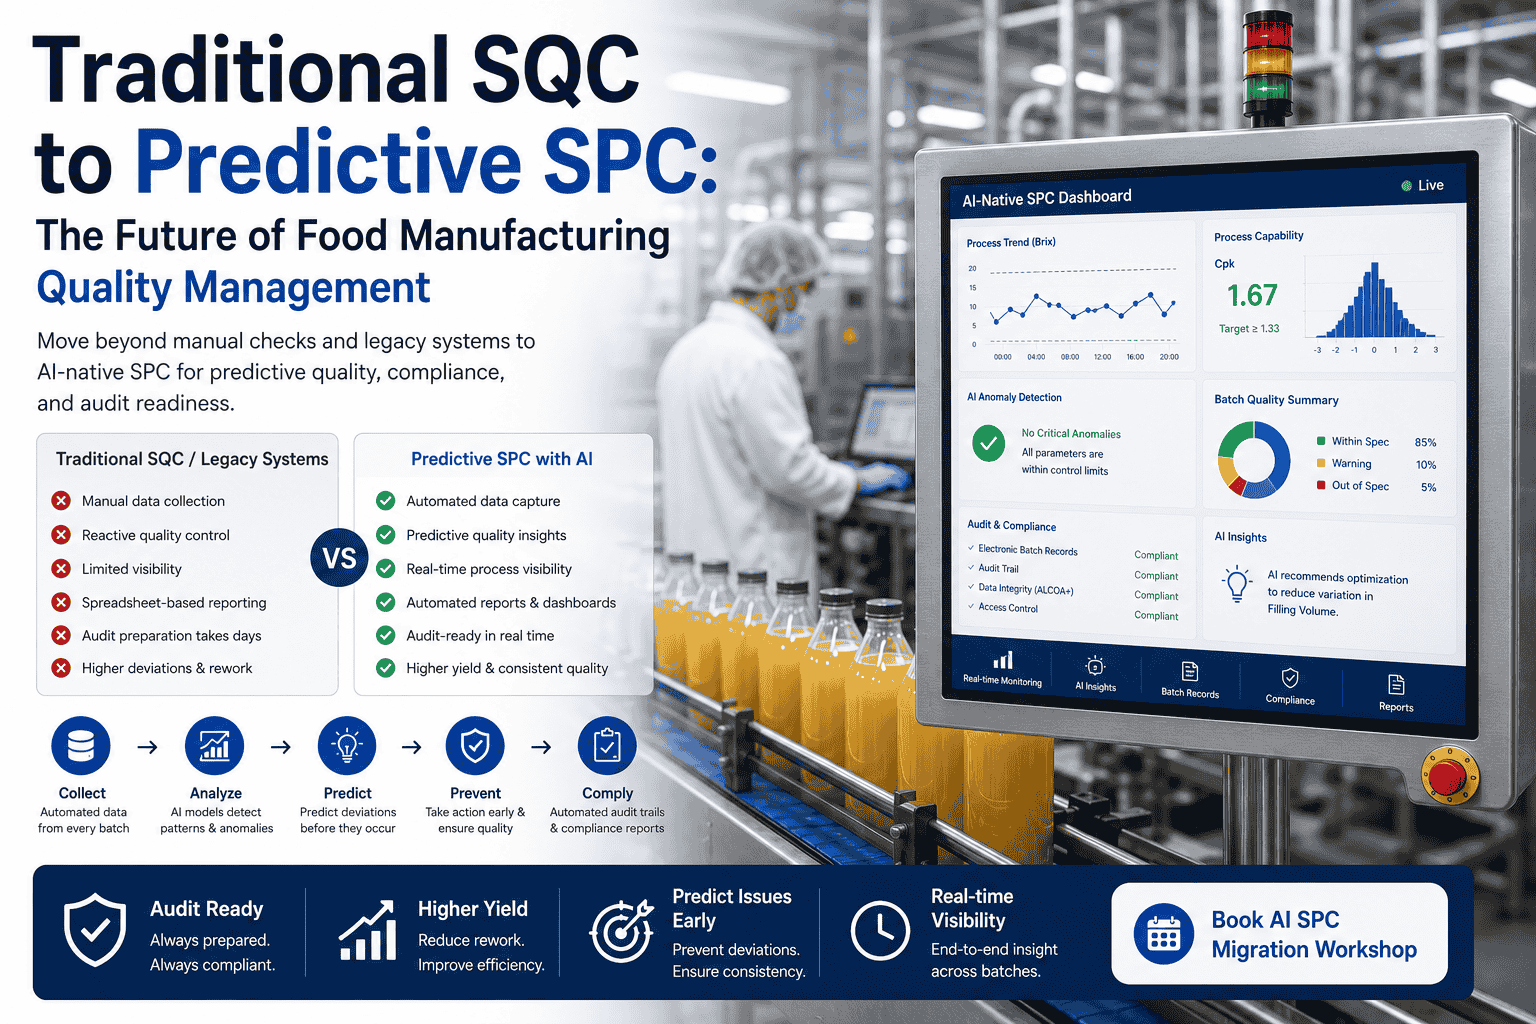
Monitors the process variables—temperature, pressure, speed, torque—that drive batch-level quality deviations. AI models alert operators to emerging process drift before non-conforming product reaches the end of the line, eliminating costly rework and disposition decisions.
Enterprise Asset Management Integration
Integrates directly with existing enterprise asset management platforms and CMMS tools to synchronize predictive health alerts with work order generation, spare parts inventory, and technician scheduling—creating a closed-loop reliability workflow.
Multi-Facility Control Tower View
Provides operations executives with a consolidated control tower software perspective across all plant locations—enabling portfolio-level risk ranking, capital prioritization, and cross-facility benchmarking from a single executive dashboard.
Quantifying the Financial Return: How the AI Command Center Pays for Itself
The Compounding ROI Structure of Predictive Intelligence Deployment
The financial return from an AI analytics command center is not a single data point—it compounds across three distinct value layers that grow in magnitude as the platform accumulates operational history and refines its predictive models. This self-reinforcing structure is what separates AI manufacturing software investments from static hardware purchases, which deliver fixed returns relative to a single throughput or labor variable. Plant directors evaluating their next Capex cycle consistently find that the command center generates enough operational savings within 12 months to fund their subsequent automation projects—making it the natural first investment in any digital transformation roadmap. To model the ROI specific to your facility, Book a Demo and receive a facility-specific projection from our reliability engineers.
Immediate: Single-Event Downtime Avoidance
Preventing one catastrophic failure on a primary processing line—accounting for lost product, emergency repair costs, expedited freight, and missed shipping commitments—frequently recovers the full cost of the platform deployment in a single avoided event. For high-volume food manufacturers, this "single-event ROI" is the most compelling entry point for the digital modernization conversation.
Short-term value driverIntermediate: Hidden Capacity Reclamation
Every food plant has a "hidden factory" of latent capacity lost to micro-stoppages, slow-running equipment, and extended changeovers. The AI command center surfaces these micro-inefficiencies and quantifies their contribution to OEE gap—allowing facilities to reclaim 15–20% of production capacity without purchasing new equipment. This "digital capacity" converts directly to margin in every production cycle.
Medium-term growth driverLong-Term: Capex Deferral & Asset Life Extension
With precise, continuous data on asset health trends, plant directors can defer expensive equipment replacements by 3–5 years while maintaining full operational reliability. This ability to extend the productive life of existing capital—while precisely timing future automation investments based on data rather than assumption—creates a structural financial advantage that competitors operating on preventive schedules cannot replicate.
Long-term capital efficiencyAverage reduction in unplanned downtime following AI command center deployment across high-speed packaging and processing lines.
Sustained increase in Overall Equipment Effectiveness through AI-driven anomaly detection and micro-stoppage resolution.
Total maintenance spend reduction by eliminating emergency repair costs, overtime, and unnecessary preventive component replacements.
Average extension of critical asset operational life through early mechanical stressor detection and condition-based intervention.
How the AI Command Center Serves Every Decision-Maker in the Plant
One of the most powerful attributes of a unified operational intelligence platform is its ability to satisfy the competing priorities of every stakeholder simultaneously. Financial teams gain transparent ROI documentation; maintenance leads escape the reactive break-fix cycle; plant directors gain the zero-surprise production visibility they need to commit to customer delivery commitments confidently. The AI command center converts technical asset data into a business language the entire leadership team can use to align around modernization priorities and capital allocation decisions.
Strategic Production Visibility
Access a real-time, facility-wide view of asset health, production efficiency, and emerging risk—enabling data-driven shift planning, maintenance window scheduling, and Capex prioritization across single and multi-plant portfolios without relying on end-of-day reports.
Tool: Executive OEE DashboardCondition-Based Work Management
Transition from reactive firefighting to a structured, AI-driven maintenance schedule. Automated work orders based on vibration thresholds and health scores eliminate emergency calls, reduce technician burnout, and optimize spare parts inventory against actual asset condition rather than assumed replacement intervals.
Tool: Predictive Health AlertsTotal Cost of Ownership Analysis
Quantify the true operating cost of legacy assets versus new automation investments using continuous asset performance data. Map avoided production disruptions, energy savings, and spare parts optimization to the corporate P&L with an audit-ready digital record that supports insurance negotiations and regulatory due diligence.
Tool: TCO Analytics EngineDeploying the AI Command Center: A Three-Phase Implementation Roadmap
The path to a fully operational digital transformation manufacturing command center is structured, fast, and designed to deliver actionable insights within the first 48 hours of sensor deployment. Unlike multi-year ERP implementations or hardware automation projects, the AI command center is additive—it layers intelligence onto your existing asset base without disrupting current production schedules or requiring significant IT infrastructure changes. The three-phase roadmap below outlines the progression from initial connectivity to full enterprise intelligence maturity.
Universal Connectivity
Deploy wireless sensors and establish the edge-to-cloud IoT bridge across your highest-priority assets. The platform ingests data from existing PLCs, SCADA systems, and new IoT devices simultaneously—creating a single source of truth for every monitored asset within 2 to 4 weeks of kickoff without disrupting active production.
Timeline: 2–4 Weeks · FoundationPredictive Health Modeling
AI models baseline your specific asset failure signatures during the initial data collection period. Within 4 to 8 weeks, the system begins generating high-confidence failure predictions, automated work orders, and OEE improvement recommendations calibrated to your exact equipment mix and production environment.
Timeline: 4–8 Weeks · IntelligencePrescriptive Optimization
Reliability data integrates with production planning to automatically recommend line speed adjustments, maintenance windows, and energy optimization strategies based on real-time asset health and enterprise demand forecasts. This phase converts the command center from a monitoring tool into an active production optimization engine.
Timeline: Ongoing · MaturityAI Analytics Command Center — Plant Director FAQs
Can the AI command center integrate with our existing CMMS or ERP?
Yes. The platform is designed for deep integration with industry-standard CMMS and ERP platforms including SAP, Maximo, and UpKeep. Predictive health alerts and diagnostic data are pushed directly into your existing maintenance workflow—eliminating manual data entry and ensuring that AI-generated insights result in immediate, actionable work orders without changing how your teams operate.
How quickly will we see actionable insights after deployment?
Most facilities begin receiving actionable sensor data within the first 48 hours of deployment. Full predictive accuracy—where AI models have baselined your specific asset failure signatures—typically matures within 4 to 8 weeks. Full ROI, measured by avoided downtime and documented OEE improvement, compounds within the first 3 to 6 months of operation.
Does the platform work on legacy equipment without existing PLCs?
Legacy assets are often where the command center delivers its highest ROI. Non-intrusive wireless vibration and temperature sensors install on any rotating asset in minutes—regardless of age, manufacturer, or the absence of an existing PLC—bringing modern predictive intelligence to equipment that conventional monitoring systems cannot reach.
What level of IT involvement is required for implementation?
Minimal. The platform uses an edge-to-cloud architecture that can operate independently of your local IT network via cellular gateway if needed—reducing implementation burden on IT teams while maintaining enterprise-grade data security and continuous uptime. Most deployments require no changes to existing network infrastructure.
How does the AI distinguish between normal process vibration and genuine failure signals?
The AI models are pre-trained on millions of food manufacturing data points covering normal process-induced vibration patterns across a wide range of equipment types. During the initial baseline period, the models further calibrate to your specific assets and operating conditions—achieving 98% anomaly detection accuracy that eliminates the false alarm rates that undermine confidence in conventional threshold-based monitoring systems.
Can the command center monitor multiple plant locations simultaneously?
Yes. Multi-facility control tower visibility is a core capability of the enterprise platform. Operations executives can view consolidated asset health scores, risk rankings, and OEE metrics across all locations from a single dashboard—enabling portfolio-level reliability management and cross-facility benchmarking that single-site tools cannot provide.
Is there a minimum facility size required to achieve a positive ROI?
The platform is modular and scales from focused single-line deployments to full enterprise portfolios. Facilities with as few as five critical assets typically achieve full ROI within the first year by avoiding a single major production stoppage. Larger multi-line facilities with higher throughput value typically achieve ROI within the first avoided failure event.