Multi-plant food enterprises face a compounding challenge that single-site operations never encounter: the need to synchronize production planning, demand signals, asset health data, and supply chain variables across dozens of geographically dispersed facilities simultaneously. AI-based analytics forecasting resolves this complexity by creating a unified predictive intelligence layer that spans every plant, every line, and every market in real time — giving food manufacturers the forecasting accuracy, risk visibility, and cross-facility optimization capability that legacy planning tools structurally cannot deliver. If your organization is still managing multi-plant forecasting through disconnected spreadsheets and siloed ERP modules, Book a Demo to see how AI forecasting transforms enterprise-scale food production within weeks.
The Core Problem: Why Traditional Forecasting Breaks Down Across Multiple Food Plants
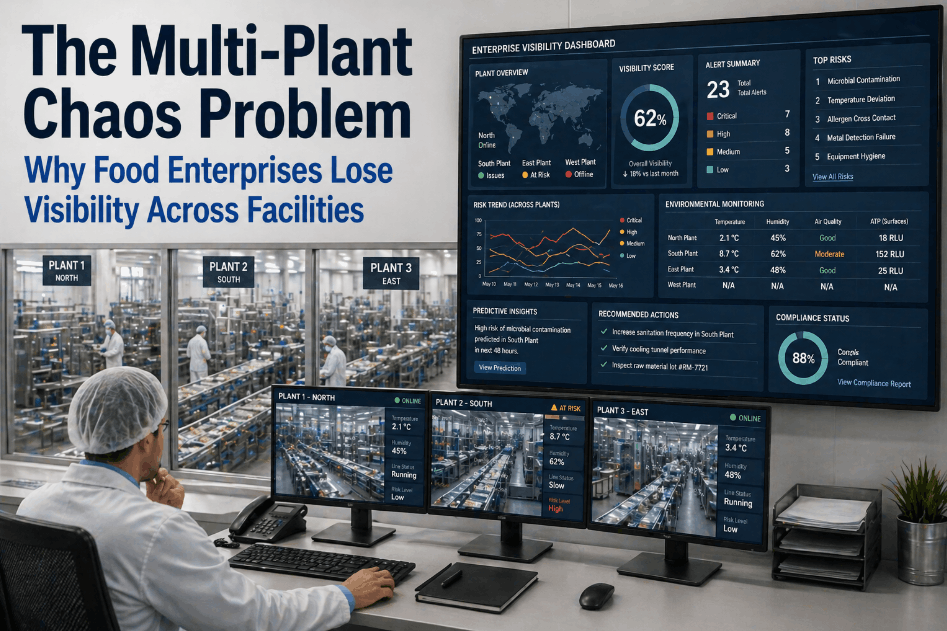
Enterprise food manufacturers operating across multiple production sites consistently encounter the same structural failure: forecasting accuracy degrades in direct proportion to facility count. Each facility typically runs its own ERP instance, SCADA historian, CMMS platform, and quality management system — none of which communicate with counterparts at other sites — leaving enterprise leadership to synthesize manually extracted reports and make allocation decisions on data that is days old by the time it reaches the boardroom.
Siloed Plant-Level Data
Each facility generates rich operational data that never reaches enterprise systems. Without cross-plant data consolidation, multi-site performance benchmarking and demand rebalancing remain structurally impossible for operations leadership teams.
Inconsistent Demand Signal Processing
Different plants interpret the same customer demand signals through different planning models and assumptions, creating allocation conflicts, overproduction at some sites, and stock-outs at others — destroying network-level efficiency.
No Unified Asset Visibility
Equipment failures and capacity constraints at individual plants are invisible to enterprise planners until they trigger production shortfalls. Without asset performance management across all sites, network risk cannot be quantified or mitigated proactively.
Reactive Supply Chain Response
Multi-plant enterprises absorb enormous waste from reactive procurement decisions driven by poor forecast accuracy. Supply chain forecasting that cannot read cross-plant demand signals fails to optimize procurement timing and volume at the network level.
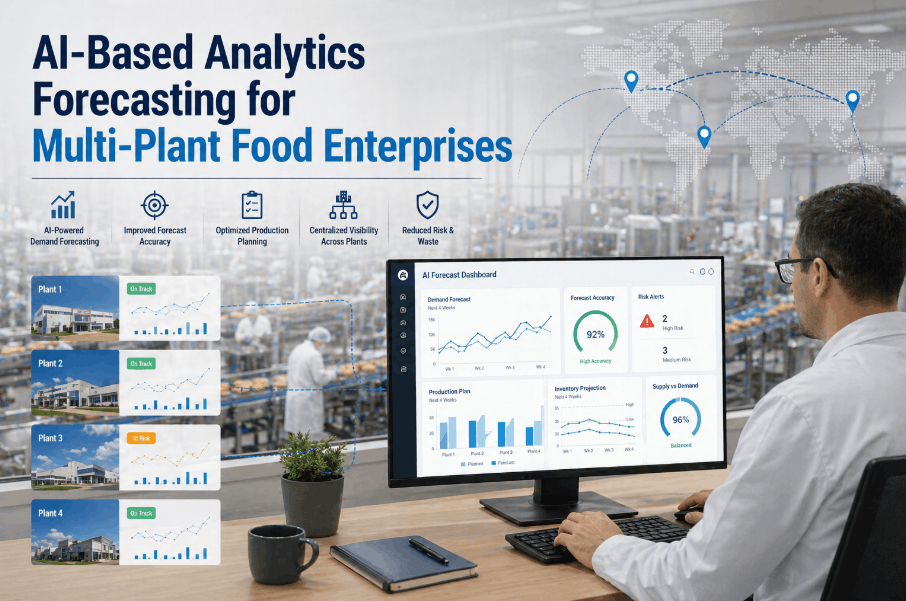
How AI Forecasting Systems Unify Demand, Capacity, and Risk Signals Across Every Plant
Enterprise-grade AI forecasting systems for multi-plant food operations function across four interconnected intelligence layers — demand signal aggregation, capacity constraint modeling, network optimization, and enterprise risk synthesis — each processing a distinct class of information to produce forecasts that simultaneously reflect market demand, available production capacity, asset health risk, and supply chain exposure across the entire manufacturing network. Enterprises ready to see this architecture in action can Book a Demo for a live multi-plant architecture walkthrough with our data engineering team.
Enterprise Demand Signal Aggregation
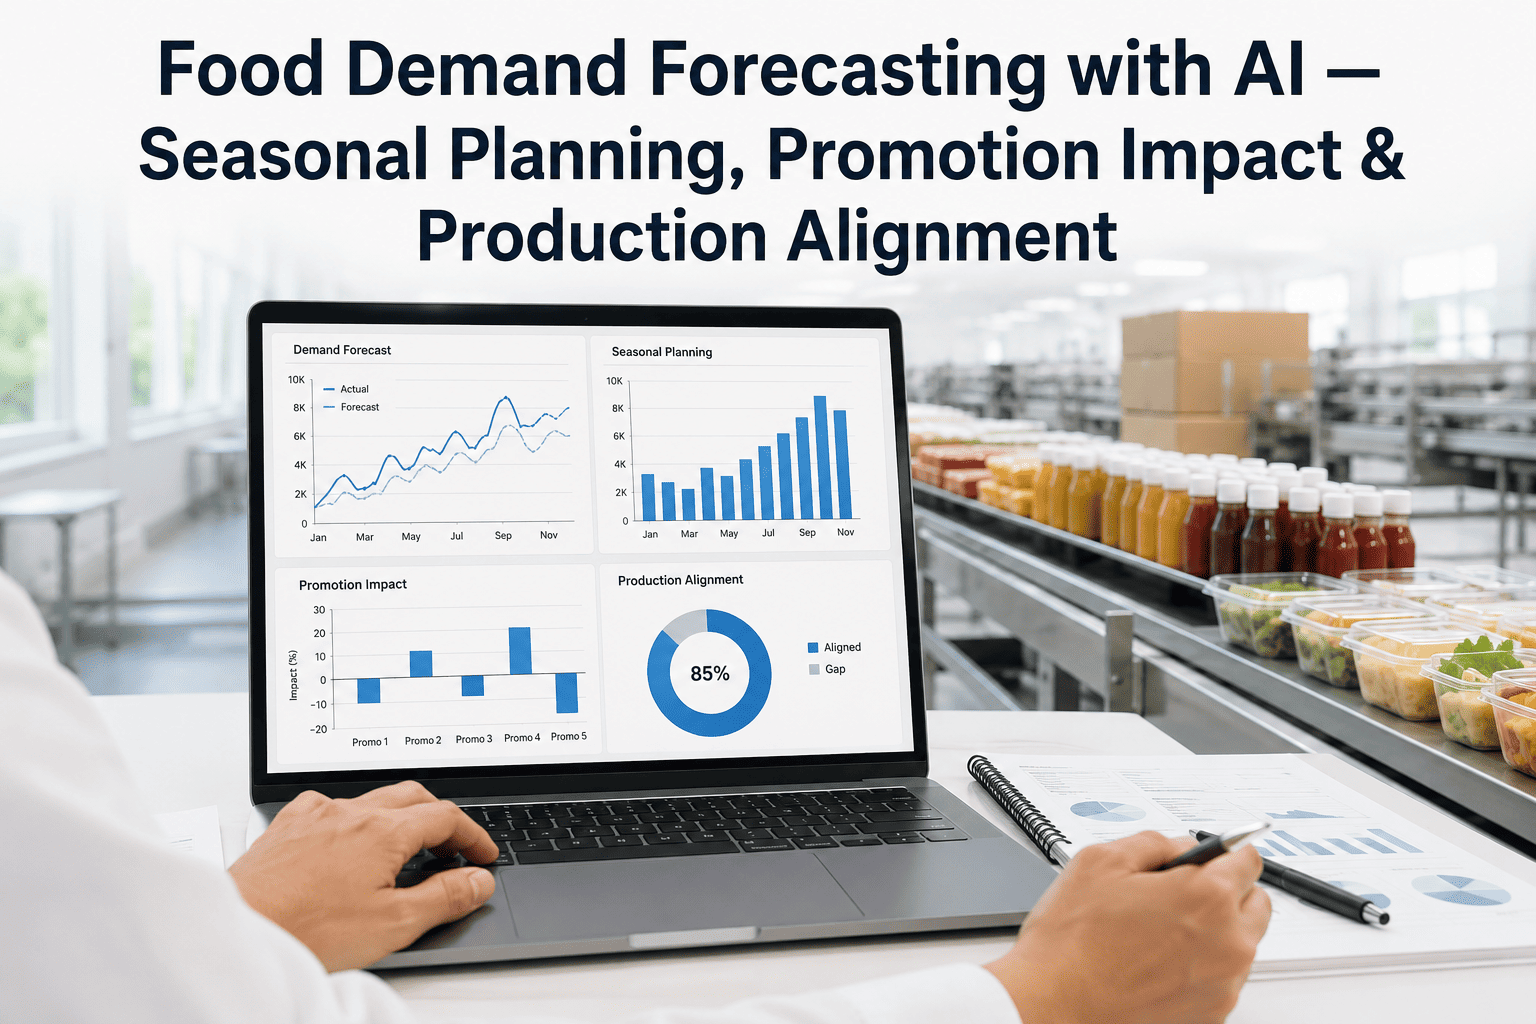
AI models ingest point-of-sale data, distributor order history, promotional calendars, seasonality indices, and macroeconomic indicators simultaneously across all markets served by the enterprise network. Machine learning models trained on multi-year demand histories generate probabilistic demand forecasts with confidence intervals that enable risk-aware production planning rather than single-point guesswork.
Inputs: POS · Distributor Orders · Seasonality · PromotionsCross-Facility Capacity & Asset Intelligence
Real-time asset health scores from every monitored production line across every facility feed into the capacity intelligence layer, continuously updating available production capacity estimates based on current equipment condition — not theoretical nameplate capacity. When a filling line shows early bearing degradation, the capacity model immediately reflects the increased downtime probability and rebalances volume allocation to other sites before a failure disrupts commitments.
Inputs: Sensor Data · Maintenance Schedules · OEE HistoryNetwork Optimization & Allocation Engine
The optimization engine solves the multi-plant allocation problem continuously — determining which products should be produced at which facilities, in what volumes, and on which timelines to minimize total delivered cost while meeting service level commitments. Transportation costs, plant-specific recipes, regulatory certification requirements, and raw material availability are all encoded directly into the optimization model.
Output: Allocation Plans · Transfer Orders · Inventory TargetsEnterprise Risk & Scenario Intelligence
The risk intelligence layer runs continuous scenario simulations — modeling the impact of demand shocks, supplier disruptions, equipment failures, and regulatory events on enterprise production commitments. Operations and supply chain leadership can evaluate the financial exposure of different risk scenarios and pre-position contingency plans before disruptions materialize, converting reactive crisis management into proactive risk governance.
Output: Risk Scores · Scenario Models · Contingency PlansKey Capabilities of an Industrial Analytics Platform for Multi-Plant Food Enterprises
The most effective industrial analytics platform for multi-plant food enterprises is not a single forecasting engine — it is an integrated suite of predictive capabilities that address every dimension of enterprise operational performance, from demand sensing through supply chain risk to equipment lifecycle management. Enterprises evaluating platform capabilities against their specific multi-site requirements can Book a Demo for a structured capability demonstration mapped to their existing system landscape.
Multi-Horizon Demand Forecasting
AI models generate rolling forecasts across short (1–4 week), medium (1–3 month), and long (3–18 month) planning horizons simultaneously — each calibrated to the decision-making needs of operations scheduling, supply chain procurement, and capital planning teams respectively.
Cross-Plant Asset Performance Management
Unified asset health dashboards surface equipment condition, maintenance backlog, and remaining useful life estimates for every monitored asset across all facilities — enabling reliability engineers to prioritize interventions at the network level rather than plant by plant in isolation.
Supplier Risk & Procurement Forecasting
AI models monitor supplier performance history, commodity price signals, and geopolitical risk indicators to generate procurement timing and volume recommendations that reduce raw material costs while protecting against supply disruptions across the network.
Cross-Facility Quality Benchmarking
Statistical process control models compare quality performance metrics — defect rates, rework volumes, waste percentages — across all plants simultaneously, identifying facilities where process drift is creating quality risk before it reaches finished product inspection.
Network-Level Energy Optimization
Energy consumption baselines established per facility, per production line, and per product recipe enable the platform to detect abnormal energy draw patterns that signal mechanical degradation or process inefficiency — and optimize scheduling to minimize peak demand charges network-wide.
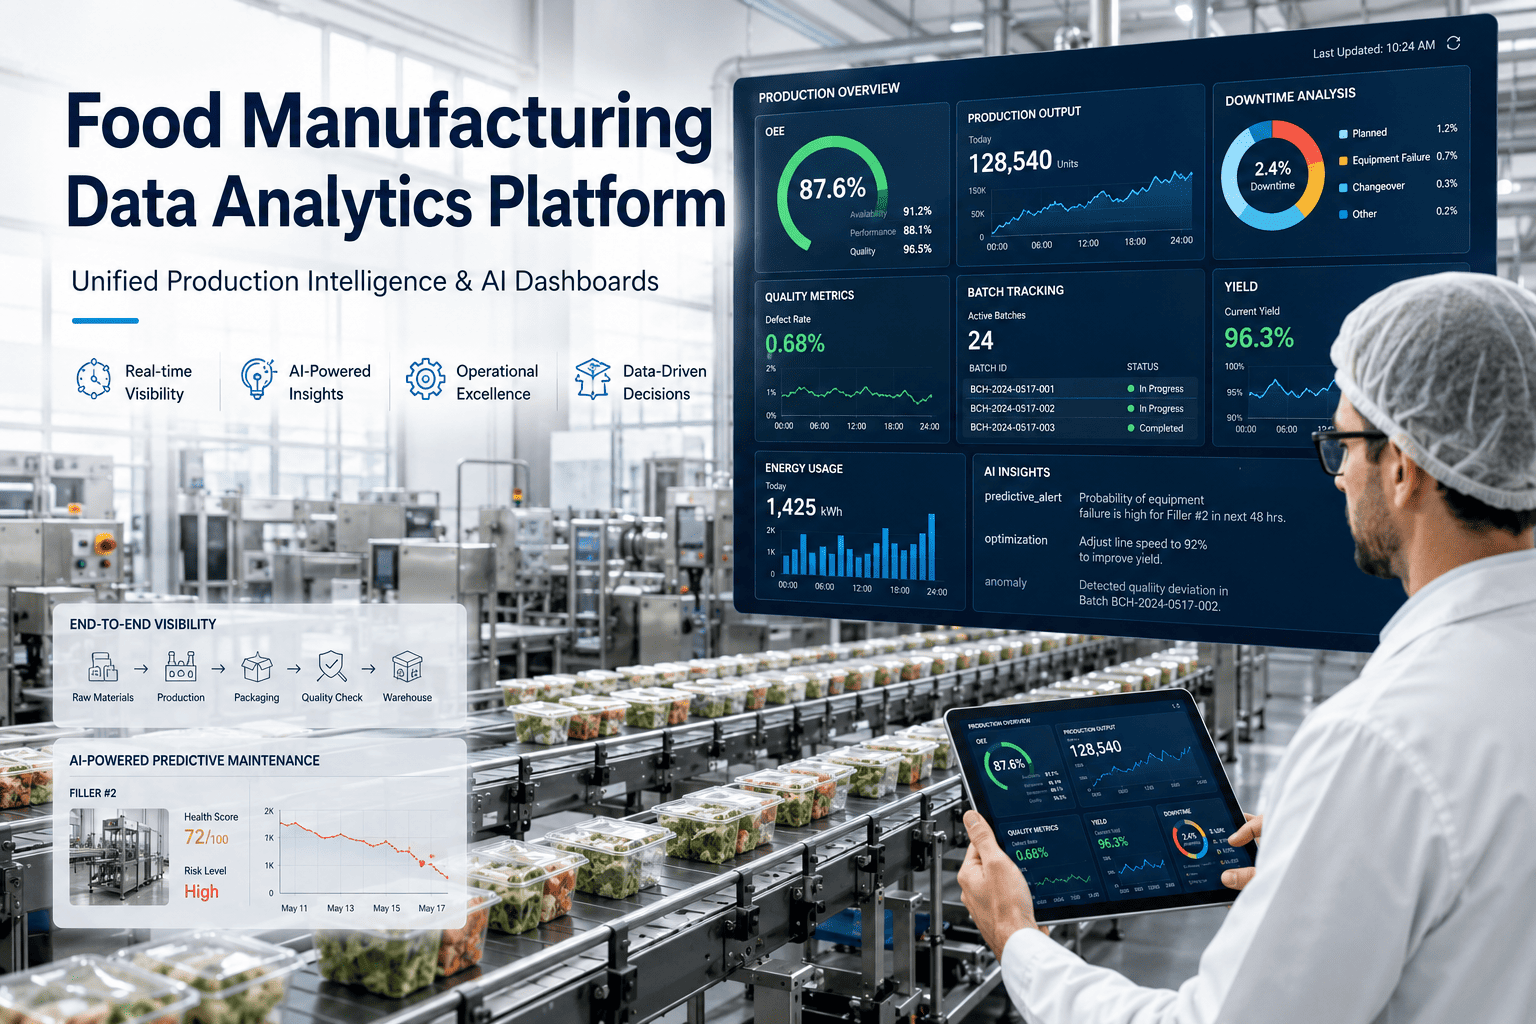
Enterprise KPI & Performance Dashboards
Role-specific executive dashboards consolidate OEE, OTIF, cost-per-unit, asset utilization, and inventory turn metrics across all plants into a single enterprise performance view — updated continuously from live operational data without manual report compilation.
Multi-Plant Performance Analytics: What Enterprise Food Manufacturers Can Measure and Optimize
The true power of multi-plant performance analytics lies not in what any single facility can measure in isolation, but in the comparative and correlative insights that only become visible when data from all facilities is analyzed together — cross-facility benchmarking, network-level bottleneck identification, and best-practice propagation that accelerate improvement opportunities and compound their financial impact across every plant in the network. Enterprises ready to quantify the performance gap between their best and worst sites can Book a Demo and receive a complimentary cross-plant performance benchmarking assessment.
| Analytics Dimension | Single-Plant View | Multi-Plant AI View | Enterprise Value Unlocked |
|---|---|---|---|
| OEE Performance | Individual facility OEE tracking | Ranked OEE comparison across all sites with root cause attribution | Best-practice production methods replicated network-wide |
| Demand Forecasting | Plant-level sales history extrapolation | Cross-market demand signal aggregation with multi-plant fulfillment optimization | 15–25% reduction in forecast error; fewer stock-outs and overruns |
| Asset Health | Reactive CMMS work order management | Network-wide asset health scoring with predictive failure alerts | 30–40% reduction in unplanned downtime across the enterprise |
| Energy Consumption | Utility bill review and BMS alerts | Cross-plant energy intensity benchmarking by product category | Identification of high-efficiency practices transferable to underperforming sites |
| Quality Performance | Individual facility quality audit results | Statistical SPC comparison across all sites with equipment correlation | Faster identification and elimination of network-wide quality risks |
| Supply Chain Risk | Plant-level inventory and procurement management | Network-wide supplier concentration risk and procurement optimization | Reduced procurement costs and supply disruption exposure across the enterprise |
Operational Forecasting Software: From Demand Signal to Production Schedule in Real Time
The gap between a demand forecast and an executable production schedule is where most multi-plant enterprises lose efficiency — traditional planning processes translate forecasts into schedules through a series of manual steps, each introducing delay, interpretation error, and constraint violation risk. AI-powered operational forecasting software compresses this cycle from days to minutes by automating the translation from demand signal to capacity-constrained, asset-risk-adjusted production schedule across all facilities simultaneously.
Demand Signal Ingestion & Consensus Forecasting
AI models integrate demand signals from sales teams, retail partners, distributor order patterns, and external market data simultaneously. Statistical consensus forecasting algorithms reconcile conflicting demand views into a single enterprise forecast baseline that reflects both top-down revenue targets and bottom-up operational realities.
Capacity Constraint Modeling
The demand forecast is overlaid against a real-time capacity model that incorporates current asset health scores, planned maintenance windows, changeover time requirements, and crew availability across all facilities. Constraints are enforced automatically, and the model flags infeasibility before it becomes a commitment to customers or retailers.
Multi-Plant Allocation Optimization
The optimization engine distributes production volumes across facilities to minimize total delivered cost while achieving target service levels. Transportation costs, plant-specific production costs, and raw material proximity are all factored into allocation decisions that would take human planners days to compute manually.
Schedule Publication & ERP Integration
Optimized production schedules are published directly to each facility's ERP and production planning systems via API integration — eliminating manual schedule transcription, reducing planner workload, and ensuring the schedule executed on the production floor reflects the latest demand and capacity intelligence available at the enterprise level.
Enterprise Risk Management Software: How AI Identifies and Quantifies Multi-Plant Operational Risk
For multi-plant food enterprises, operational risk is not a single-point event — a drought affecting a key ingredient region, a regulatory action at one facility, or a critical equipment failure at a high-volume plant can cascade through the production network within hours, affecting customer commitments across multiple markets simultaneously. AI-powered enterprise risk management software provides continuous, quantified visibility into the risk exposure of the entire manufacturing network, enabling leadership to act on emerging threats before they trigger customer-facing consequences. Enterprises ready to quantify their current network risk exposure can Book a Demo for a live risk assessment demonstration.
Ingredient & Raw Material Supply Risk Scoring
AI models assign dynamic supply risk scores to every critical ingredient based on supplier concentration, geographic exposure, commodity price volatility, and lead time variability — enabling procurement teams to act on emerging supply risk weeks before shortfalls materialize in production schedules.
Asset Failure Probability & Capacity Risk
Remaining useful life models translate equipment health scores into capacity risk estimates — quantifying the probability that specific production commitments will be affected by equipment failures within defined planning windows and enabling proactive rebalancing before failures occur.
Demand Volatility & Over-Commitment Risk
Probabilistic demand forecasting models provide confidence intervals that expose over-commitment risk — identifying when the enterprise has accepted production commitments that exceed the realistic network capacity under adverse but plausible demand or downtime scenarios.
Compliance & Audit Readiness Monitoring
Continuous monitoring of equipment performance records, sanitation logs, and quality documentation against FSMA, BRC, SQF, and FDA requirements provides real-time compliance risk scores for every facility — flagging documentation gaps before they escalate into regulatory findings.
Measurable Business Outcomes: What AI Forecasting Delivers for Multi-Plant Food Enterprises
For enterprise technology investment committees evaluating an industrial IoT analytics and forecasting platform, the business case must be grounded in quantified outcomes — not capability claims. The financial return from deploying AI-based analytics across a multi-plant food enterprise materializes across four performance dimensions that compound in value over the first 24 months of platform operation.
Improvement in demand forecast accuracy at the SKU-plant level, measured against pre-deployment baseline MAPE across enterprise customer deployments.
Reduction in unplanned production downtime across all monitored assets, driven by predictive maintenance interventions triggered before failures occur.
Decrease in finished goods and raw material safety stock required, enabled by improved forecast accuracy and real-time supply chain risk visibility at the network level.
Reduction in time required to produce, validate, and publish production schedules across all facilities — compressing multi-day planning cycles to hours.
Why Multi-Plant AI Forecasting Delivers 4–7x Return in the First Year
The compounding return of enterprise AI forecasting comes from simultaneous value capture across multiple performance dimensions — a 28% improvement in forecast accuracy reduces inventory carrying costs by millions annually, a 38% reduction in unplanned downtime eliminates emergency repair premiums and customer penalty clauses, and optimized cross-plant allocation reduces per-unit manufacturing costs by 3–7% through better capacity utilization. When these improvements stack across an enterprise operating ten or more facilities, the financial case becomes one of the most compelling technology decisions available to food manufacturing leadership. Operations and strategy teams ready to model this ROI can Book a Demo and receive a customized enterprise ROI projection from our analytics team.
Deploying AI Forecasting Across a Multi-Plant Food Enterprise: A Phased Implementation Roadmap
Enterprise-scale AI forecasting deployments require a structured, phased approach that delivers early value at pilot sites before scaling to the full plant network — bringing initial predictive insights online within weeks while building the data infrastructure and organizational capability required for full enterprise coverage over a six-to-twelve-month horizon.
Pilot Site Deployment & Data Infrastructure
Deploy sensor hardware and edge gateways at two to three pilot facilities representing the enterprise's range of asset types and production profiles. Establish connectivity to each site's SCADA historian, CMMS, and ERP system via pre-built API connectors, and baseline AI models begin learning normal operational signatures within days of data collection commencing.
Demand Forecasting & Cross-Plant Analytics Activation
Demand forecasting models are trained on historical sales, shipment, and production data pulled from ERP systems across all connected sites. Cross-plant performance dashboards go live for operations and supply chain leadership teams, providing the first unified enterprise view of OEE, asset health, and forecast accuracy with planners validating initial allocation outputs before full automation.
Network Rollout & Enterprise Integration
The deployment scales from pilot sites to the full plant network via the same connector-first process validated in Phase 1. Enterprise risk management models go live with full supplier risk scoring, asset failure probability tracking, compliance monitoring, and automated ERP schedule publication — eliminating manual planning steps that previously required days of analyst effort per planning cycle.
Continuous Intelligence & Model Improvement
The platform enters its continuous self-improvement cycle — incorporating every resolved maintenance event, demand forecast outcome, and production schedule deviation as new training data. Prediction accuracy compounds over time as AI models accumulate enterprise-specific failure patterns and demand dynamics, while role-specific dashboards update continuously without manual data extraction or report compilation.
AI Forecasting for Multi-Plant Food Enterprises — Frequently Asked Questions
How does AI forecasting differ from statistical demand planning tools already deployed in our ERP?
ERP-native planning tools process historical sales data in isolation, while AI forecasting integrates demand history with real-time asset health, supply chain risk, and cross-plant capacity constraints — producing forecasts that are more accurate and operationally actionable than any single-system approach.
Can AI forecasting handle multi-SKU, multi-channel food enterprises with seasonal demand profiles?
Yes. Hierarchical forecasting architectures manage large SKU portfolios, multiple channels, and seasonal patterns simultaneously — maintaining coherence between SKU-level schedules and enterprise-level production targets across all planning horizons.
How long before a multi-plant deployment achieves measurable forecast accuracy improvement?
Most enterprise deployments show statistically significant accuracy improvement within 8 to 12 weeks of initial data integration, with performance continuing to compound as AI models accumulate enterprise-specific demand patterns over subsequent quarters.
Does operational forecasting software require significant on-premises IT infrastructure investment?
No. Cloud-native platforms require only edge gateways at each facility for sensor data transmission, with enterprise ERP and CMMS integration handled entirely through pre-built API connectors — eliminating the custom development costs that previously made enterprise analytics prohibitive for mid-market manufacturers.
How does the platform handle differences in processes, equipment, and recipes across different plants?
Per-asset, per-facility baseline models learn each plant's unique operational signature independently, while cross-plant analytics normalize site-specific data into comparable performance metrics — enabling meaningful benchmarking without requiring identical equipment or processes across the network.
What cybersecurity protections are included in an enterprise industrial IoT analytics deployment?
Data flows unidirectionally from plant floor systems through encrypted tunnels to cloud processing layers with no inbound connections to production systems required, and role-based access controls ensure plant-level data is accessible only to authorized stakeholders at appropriate organizational levels.