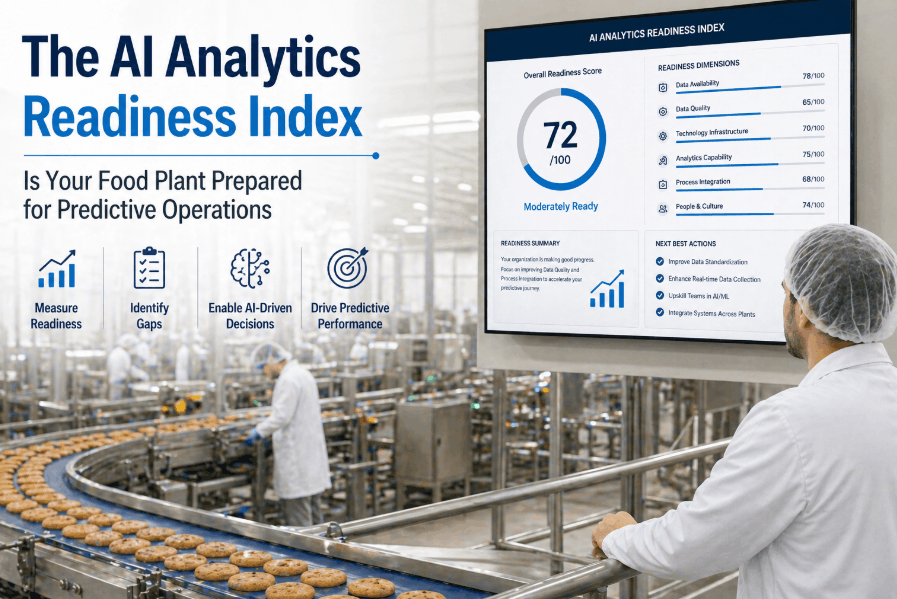
AI analytics readiness in food manufacturing is no longer a future ambition — it is a present-day competitive requirement. Plants that have deployed predictive operations frameworks are outperforming peers on OEE, unplanned downtime reduction, and regulatory compliance scores. This guide walks through a structured AI readiness assessment framework, a predictive analytics maturity model designed for food and beverage manufacturers, and a scoring system that gives your leadership team a clear picture of where your plant stands today.
Discover Where Your Food Plant Stands on the AI Readiness Index
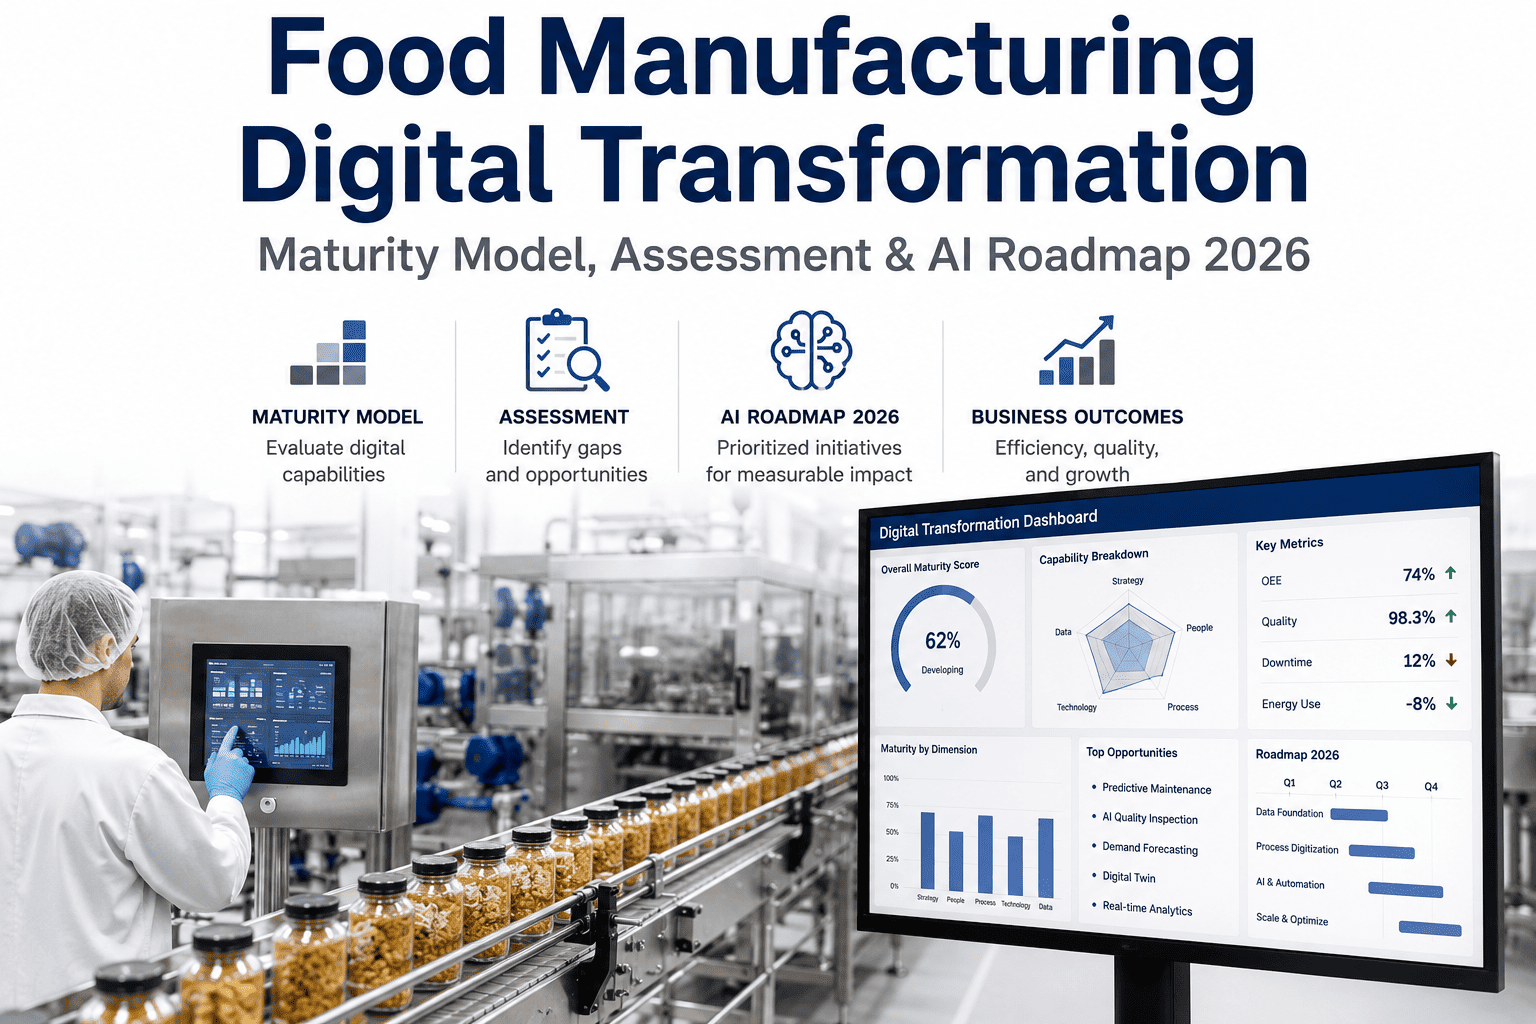
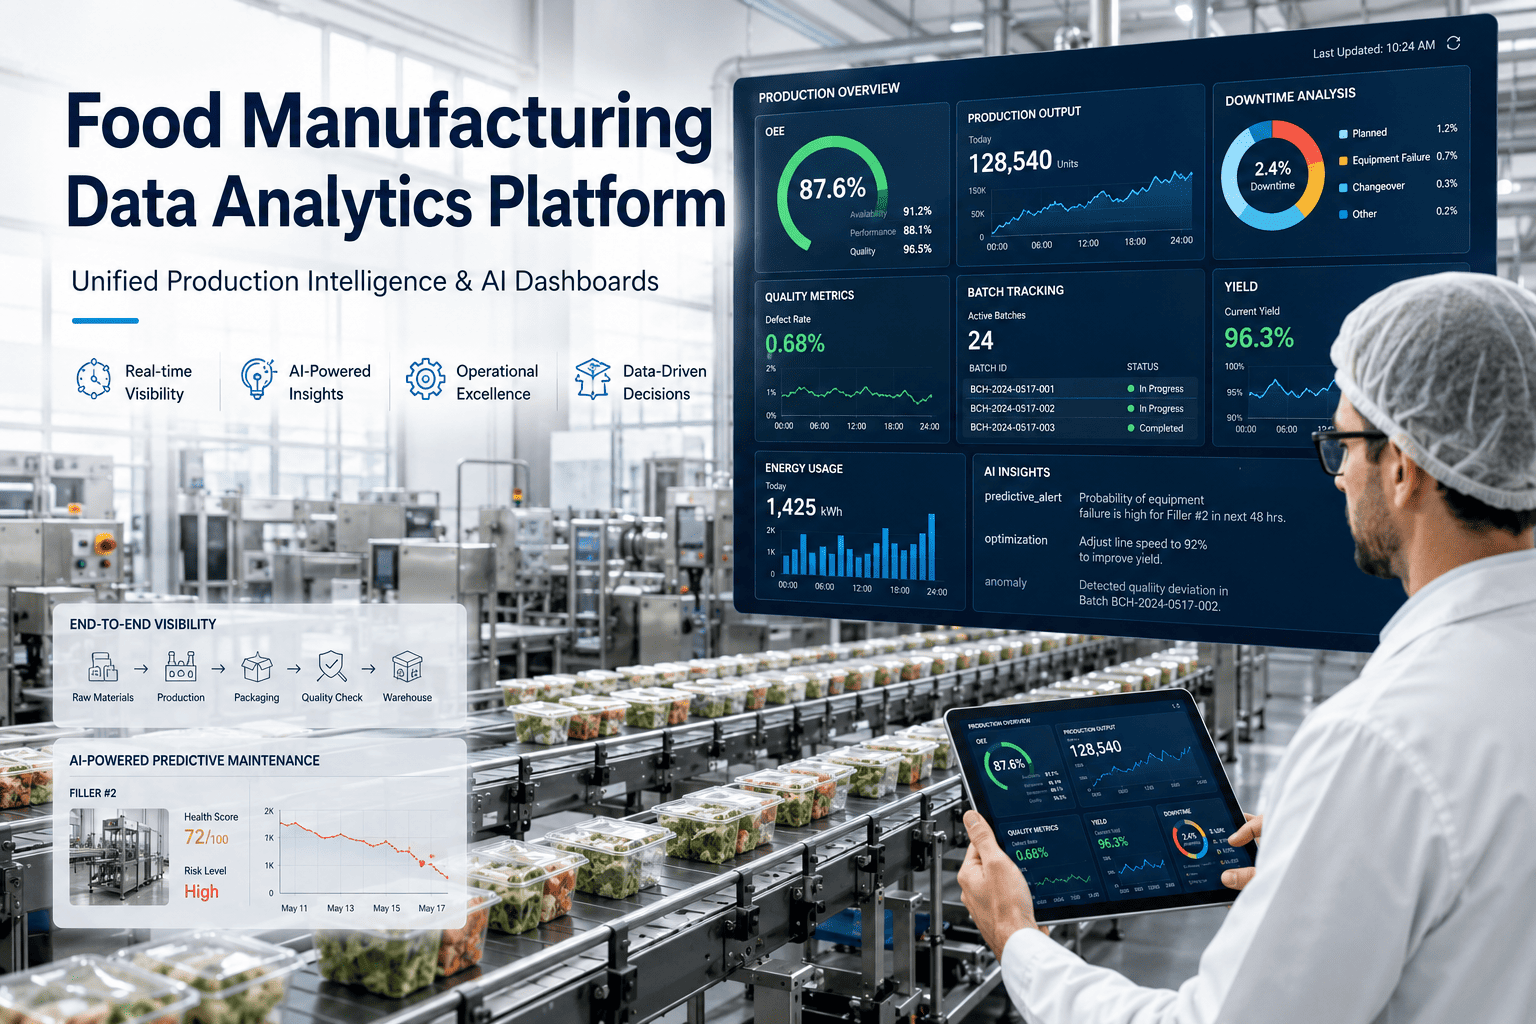
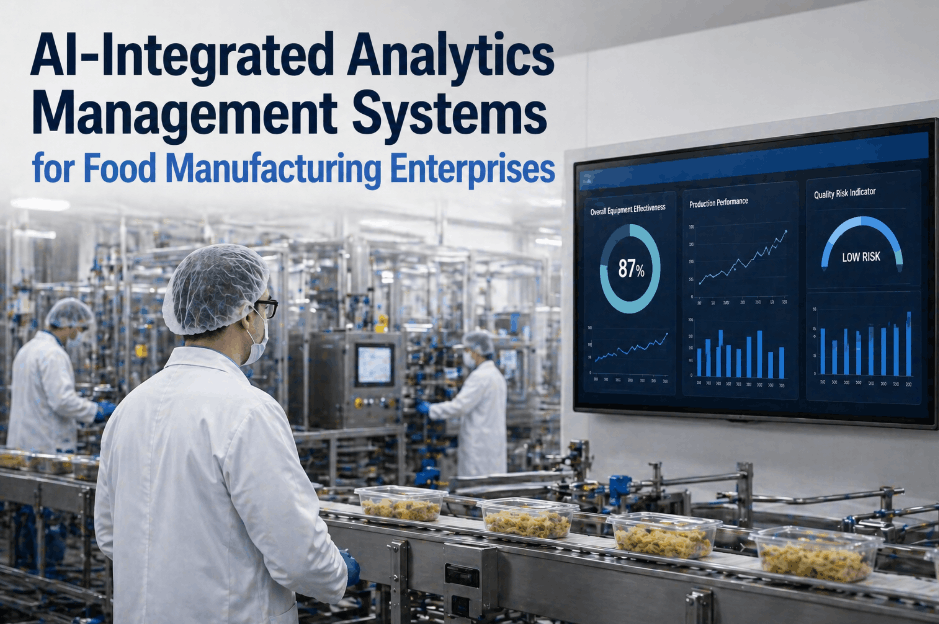
iFactory's Cloud AI-driven Platform delivers native predictive analytics, real-time operational intelligence, and a structured digital transformation roadmap — purpose-built for food and beverage manufacturers.
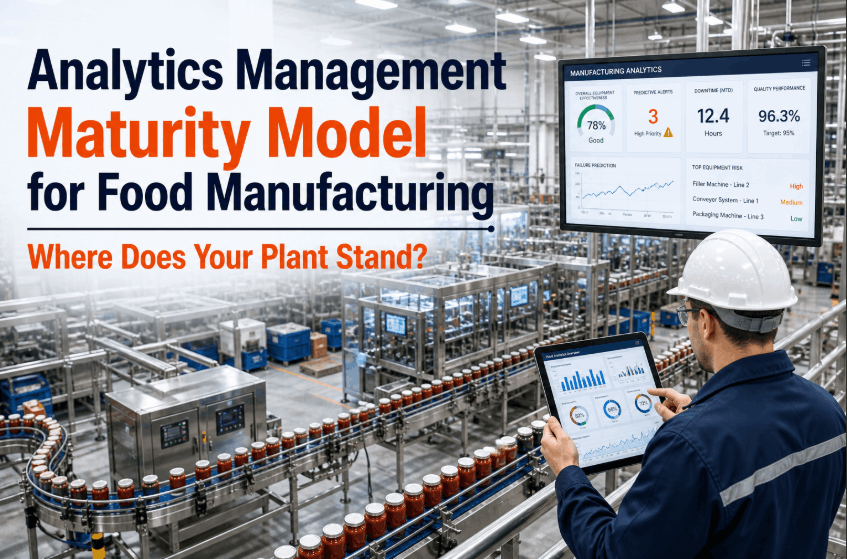
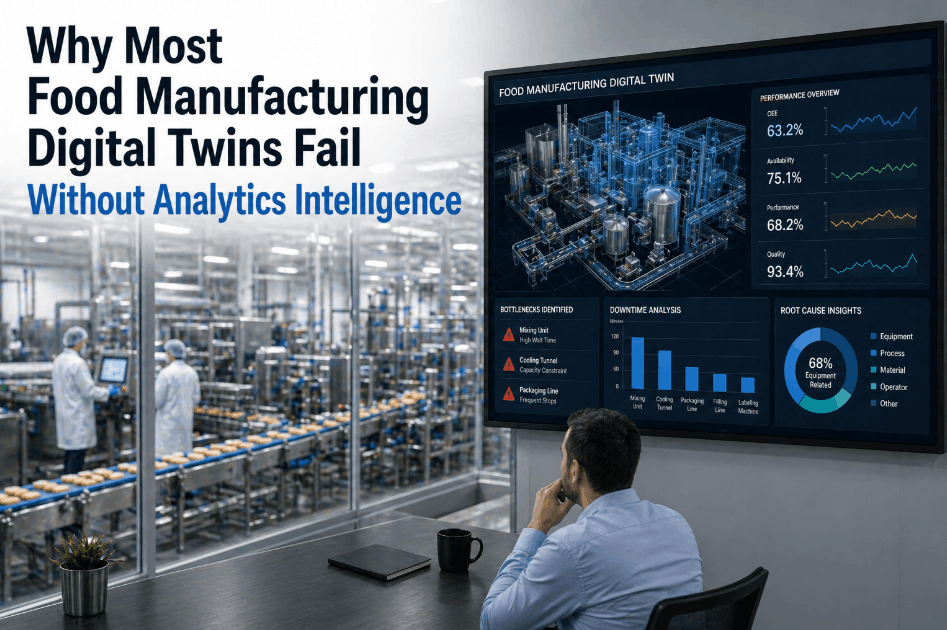
Why Food Manufacturers Cannot Afford to Skip the Digital Maturity Assessment
Facilities at advanced digital maturity levels achieve 34% fewer unplanned stoppages and 19% stronger GFSI audit performance — yet most plants attempting AI implementation without a structured AI adoption framework report failed deployments and significant sunk costs. The AI Analytics Readiness Index gives food manufacturing leadership an honest, scored assessment across five critical dimensions before platform investment is committed. Plants exploring their readiness can book a readiness assessment with iFactory's food manufacturing team.
Food plants that complete a structured digital transformation assessment before deploying AI analytics report 3.2x higher ROI in the first 18 months. Readiness-first implementations also go live 40% faster.
The Five Dimensions of the AI Analytics Readiness Index for Food Manufacturing
A credible manufacturing maturity model must evaluate capabilities across five interconnected dimensions — all of which must reach a baseline threshold before predictive operations can deliver sustained value.
Data Infrastructure & Sensor Coverage
Evaluates IoT sensor coverage, PLC/SCADA feed reliability, and time-series data architecture. Plants with less than 70% sensor coverage on critical assets are not ready for predictive analytics deployment.
Process Standardization & Digital Documentation
Measures whether SOPs, HACCP workflows, and maintenance tasks are digitized and generating consistent structured data across all shifts and production lines.
Team Capability & AI Literacy
Assesses data literacy, leadership decision-making habits, analytics ownership roles, and the organization's track record of adopting operational technology changes.
Integration Architecture & IT/OT Convergence
Evaluates ERP, MES, and LIMS integration maturity and whether bidirectional OT/IT data flows are structurally achievable in the current network environment.
Analytics Use Case Clarity & Business Case
Measures whether high-value AI use cases are specifically defined, baseline metrics are established, and ROI targets are documented before platform investment is committed.
Governance, Data Quality & Cybersecurity
Assesses data ownership definitions, model validation protocols, and OT network cybersecurity posture against FDA guidance and GFSI data integrity standards.
AI Analytics Readiness Scoring: Where Does Your Food Plant Land?
The AI readiness assessment scoring framework assigns a maturity level to each dimension on a 1–5 scale, placing your plant in one of five operational maturity bands. Most food manufacturing plants assessed in 2025–2026 land between Level 2 and Level 3 — plants whose platform is generating AI-ready data can schedule a platform gap review to identify exactly where value is being left on the table.
| Maturity Level | Index Score | Operational Profile | AI Readiness Status | Recommended Action |
|---|---|---|---|---|
| Level 1 — Reactive | 0–12 | Paper-based, siloed data, reactive maintenance | Not Ready | Foundation remediation required |
| Level 2 — Emerging | 13–18 | Partial digitization, inconsistent data, basic KPIs | Pre-Readiness | Targeted gap remediation plan |
| Level 3 — Structured | 19–24 | Digital workflows, integrated systems, data consistency | Readiness Phase | Pilot AI use case deployment |
| Level 4 — Advanced | 25–27 | Real-time data, ML models active, predictive alerts | AI-Ready | Scale predictive operations |
| Level 5 — Predictive | 28–30 | Autonomous optimization, closed-loop AI, full OT/IT convergence | Smart Factory | Continuous model improvement |
How to Score Your Plant on the Predictive Analytics Maturity Model
Each dimension is scored on five sub-criteria rated 1 (not present) to 5 (fully mature). Answer each question honestly — not aspirationally — to produce a reliable current-state readiness score.
Data Infrastructure Scoring Criteria
Score IoT sensor coverage percentage, real-time data availability, storage architecture, OT/IT network integration maturity, and data completeness gap rate — each from 1 to 5. Below 40% sensor coverage scores 1; above 90% with sub-second historian feeds and cloud-native architecture scores 5.
Process Standardization Scoring Criteria
Score SOP digitization rate, shift-to-shift data entry consistency, corrective action linkage quality, HACCP record completeness, and lot traceability depth. Plants with corrective actions stored separately from the events that triggered them score 1–2 on linkage quality.
Team Capability Scoring Criteria
Score supervisor dashboard usage, analytics ownership presence, KPI review frequency, technology adoption track record, and executive sponsorship level. Plants where AI investment is owned at plant director level score 4–5; IT-only ownership scores 1–2. Food manufacturers can request a capability benchmarking session with iFactory's specialists.
Integration Architecture Scoring Criteria
Score ERP API openness, MES bidirectional connectivity, LIMS integration depth, network architecture for OT/IT convergence, and cloud connectivity compliance. Fully air-gapped OT networks score 1; secure unified networks with role-based access and data sovereignty compliance score 5.
Use Case Clarity & Business Case Scoring Criteria
Score AI use case specificity, ROI model quality, stakeholder alignment, historical training data availability, and defined success criteria. Vague aspirations score 1; precisely defined use cases with quantified baselines and a measurement review cadence score 5.
The Six Most Common AI Readiness Gaps in Food Manufacturing Plants
These six gaps appear consistently across digital transformation assessments in food and beverage manufacturing — and each is a predictable cause of AI project failure when not identified and remediated before deployment. Plants who recognize one or more can book a gap remediation review with iFactory's food manufacturing team.
Sensor coverage exists on flagship lines while older equipment remains dark. AI models trained on partial plant data develop blind spots precisely on the aging, high-risk assets where reliability matters most.
Operators entering the same data field in twelve different formats across three shifts produce noise, not signal. Digital volume without standardization makes predictive model outputs unreliable and erodes team trust rapidly.
Work orders recorded as "repaired" without failure mode or root cause are structurally unusable for predictive model training — requiring a data labeling remediation phase before AI deployment can begin.
Production supervisors measured purely on throughput resist AI-driven recommendations to pause lines for preventive intervention — even when the prediction is accurate and ignoring it costs far more downstream.
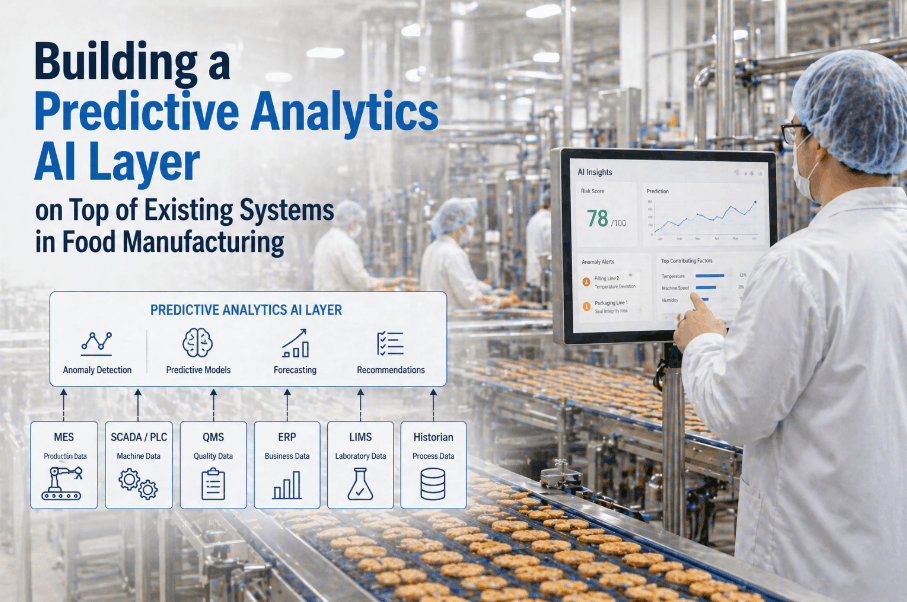
Legacy ERP systems with no API layer create a critical gap in the end-to-end operational data picture. Production scheduling and inventory data locked in the ERP cannot feed the analytics models that need it.
Deploying AI models without defined validation, retraining, and drift detection protocols creates both regulatory exposure and operational risk under FDA's increasing attention to AI-supported food safety decisions.
Building Your AI Readiness Remediation Roadmap: A Prioritized Action Framework
Sequencing matters as much as content — remediating governance before process standardization, or deploying pilot use cases before integration architecture is stable, extends timelines and wastes investment. Plants looking to accelerate this process can book a remediation planning session with iFactory's food manufacturing specialists.
Phase 1 (Weeks 1–4): Data Foundation & Sensor Coverage Audit
Conduct an asset-level sensor coverage audit across all production lines. Prioritize sensor deployment on the 20% of equipment driving 80% of unplanned downtime. Establish data standards — naming conventions, unit normalization, timestamp consistency — and define data ownership roles with specific quality KPI thresholds.
Phase 2 (Weeks 5–10): Process Standardization & Digital Workflow Deployment
Digitize and standardize the operational workflows that generate the quality and process data AI models will train on — structured digital HACCP forms, sanitation records, and corrective actions with enforced fields and real-time validation that prevent inconsistent entries across shifts.
Phase 3 (Weeks 11–16): Integration Architecture & Pilot Use Case Deployment
Establish ERP, MES, and LIMS integration connections that create end-to-end operational visibility. Deploy the highest-value AI use case as a contained pilot, measure against pre-defined success criteria, and use pilot results to build team confidence before scaling to additional production lines.
Phase 4 (Month 5+): Scaled Predictive Operations & Continuous Improvement
Scale proven AI use cases across additional lines and asset categories. Establish model governance protocols including drift monitoring and scheduled retraining cadences. Activate real-time leadership dashboards displaying predictive operations KPIs across all lines and shifts.
The Business Case for AI Readiness: ROI from Predictive Operations in Food Manufacturing
The financial case for building AI analytics readiness is built on four quantifiable ROI pillars — each grounded in documented performance outcomes from food and beverage plants that have completed the readiness-first implementation process.
Predictive maintenance models reduce unplanned stoppages by 35–50% within 12 months. At $50,000 per downtime hour, preventing four hours monthly generates $2.4M in annualized savings — typically recovering the full platform investment within year one.
AI-powered quality monitoring reduces hold and rework events by 30–45%. Predictive quality models intercept out-of-spec production before finished goods, preventing recall and delistment costs that average over $10M per event in direct costs.
Level 4–5 plants report 60–75% reductions in audit preparation time. FDA 483 observation rates drop significantly as documentation gaps are eliminated through automated, contemporaneous record generation tied to AI-monitored process data.
Digital workflows recover 20–30 hours per week of quality and maintenance staff time from manual logging and record-chasing. Food safety engineers redeployed to proactive quality work generate compounding returns beyond the direct labor savings in initial ROI models.
AI Analytics Readiness Assessment — Frequently Asked Questions
What is the AI Analytics Readiness Index and who should use it?
It is a structured manufacturing maturity model for food and beverage plant operations, quality, and IT leadership teams. It scores current readiness to deploy and sustain predictive analytics across five operational dimensions before platform investment is committed.
How long does a complete digital transformation assessment take?
A facilitated assessment typically takes 2–3 days of structured workshops with operations, quality, maintenance, and IT stakeholders. Remote self-scoring assessments using structured tools can be completed in under a week.
What score is required before deploying an AI analytics platform?
Plants should target a minimum overall Readiness Index score of 19 (Level 3) with no individual dimension scoring below 3. Below this threshold, targeted gap remediation should precede full platform deployment.
Can an AI analytics platform improve our Readiness Index score?
Yes — deploying a purpose-built industrial analytics platform like iFactory directly improves process standardization, data infrastructure, and integration architecture scores simultaneously. The readiness-first approach is about sequencing, not achieving perfection before starting.
How does the AI Readiness Index relate to FSMA and GFSI compliance?
The process standardization and data infrastructure dimensions directly map to FSMA Section 204, BRCGS, SQF, and FSSC 22000 documentation requirements. Remediating these gaps simultaneously closes major audit documentation vulnerabilities.
What is the typical timeline from readiness assessment to live predictive analytics?
Level 3 plants go live within 10–14 weeks using iFactory's implementation methodology. Level 2 plants require a 4–8 week remediation phase first, extending the total timeline to 18–22 weeks from assessment to live AI analytics.
Score Your Food Plant on the AI Analytics Readiness Index Today
iFactory's food manufacturing team delivers structured AI readiness assessments, gap remediation planning, and a purpose-built predictive operations platform — taking food plants from reactive to predictive in 10 to 14 weeks.