Multi-plant food enterprises face a systemic crisis hiding in plain sight: the larger they scale, the less they actually see. Operational visibility software that works for a single facility begins to fracture the moment a second plant comes online—and by the time a food enterprise is managing five, eight, or twelve facilities, cross-facility KPI tracking has become a patchwork of spreadsheets and outdated reports. For food manufacturers pursuing digital transformation, reclaiming visibility across all facilities is not an optimization exercise—it is the foundational requirement for every efficiency, compliance, and profitability goal that follows.
Unify Every Facility Under a Single Intelligence Layer
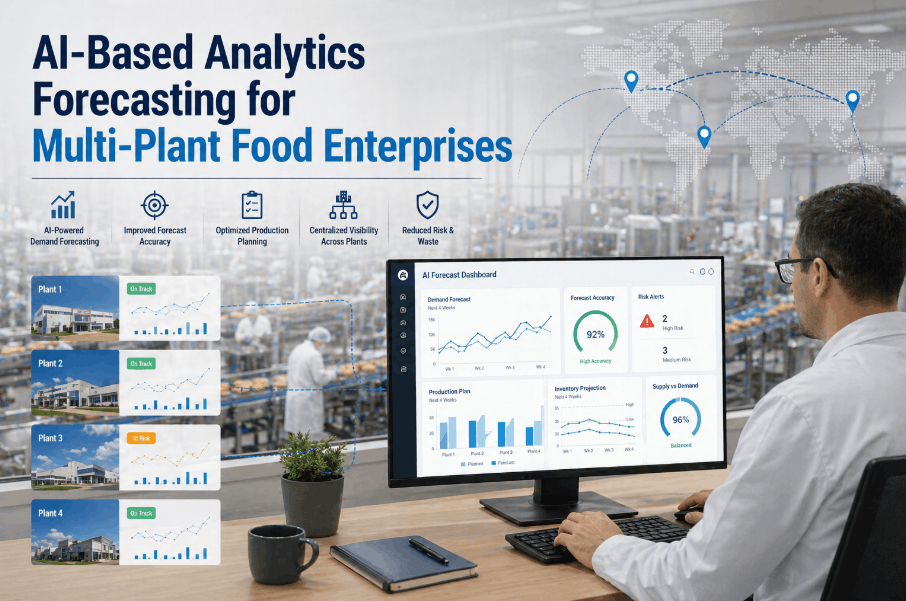
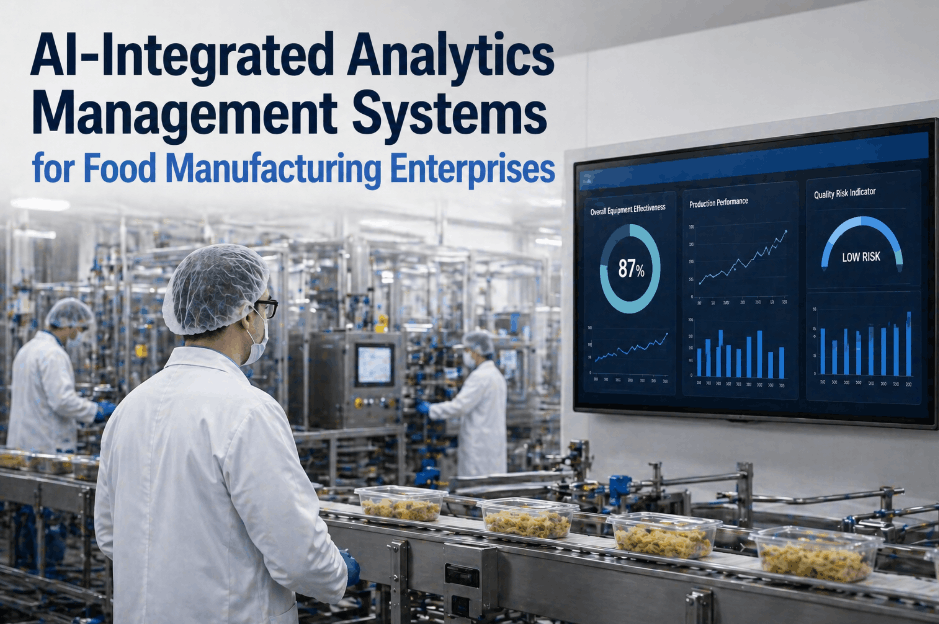
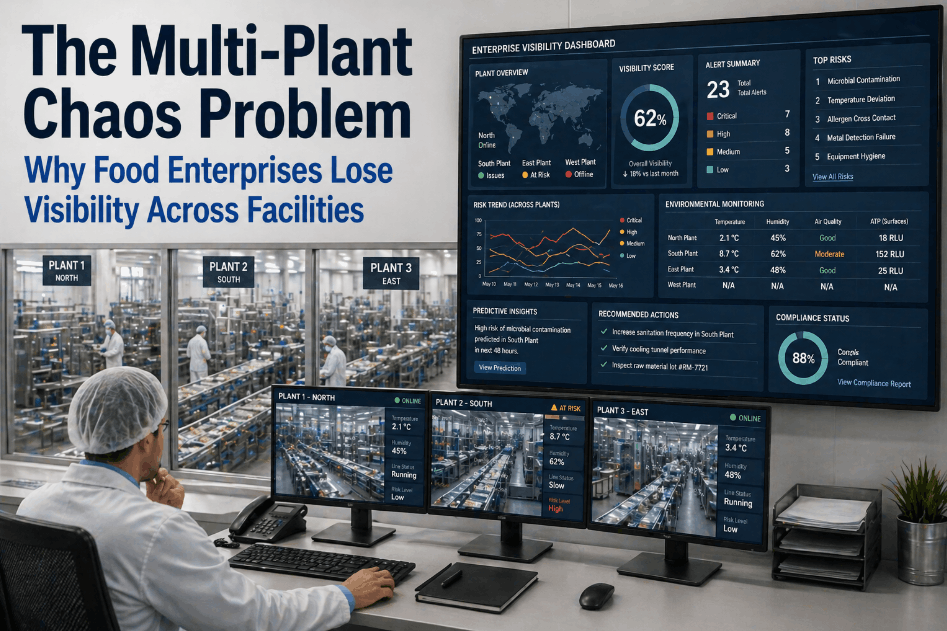
iFactory's enterprise analytics dashboard delivers real-time multi-plant performance monitoring, cross-facility KPI tracking, and manufacturing intelligence—purpose-built for food and beverage enterprises operating at scale.
Why Multi-Plant Food Enterprises Lose Operational Visibility as They Grow
Each new facility arrives with its own MES configuration, reporting cadence, and definition of a "critical deviation." Without a centralized industrial analytics platform, enterprise leadership navigates by instruments measuring different things in different units. Food manufacturers who book a demo with iFactory consistently discover that their multi-plant data problem is an architecture problem—one no spreadsheet will fix.
The consequences compound quietly. A temperature excursion at Plant 3 never surfaces enterprise-wide until a compliance review catches it weeks later. A supplier lot flagged at Plant 1 ships to Plant 5 with no cross-facility relay. The multi-plant chaos problem is not a management failure—it is a systems architecture failure requiring a systems architecture solution.
Disconnected MES Instances
Each plant on its own MES creates data silos that make cross-facility KPI tracking structurally impossible—turning enterprise roll-ups into misleading comparisons.
Non-Standardized KPIs
OEE calculated with ten different formulas across ten facilities produces ten incomparable numbers. Without a manufacturing intelligence layer, benchmarking is just comparison theater.
Latent Reporting Cycles
Weekly reports mean enterprise leadership always governs yesterday's operations. Without real-time streaming to an enterprise dashboard, every decision is made on obsolete data.
Supply Chain Blindness
A high-risk supplier lot entering three plants at once appears as three unrelated events—never a single enterprise-level exposure requiring coordinated response.
What Enterprise Asset Management Gaps Actually Cost Food Manufacturers
Asset management gaps generate costs distributed across facilities, departments, and time periods—which is precisely why they persist. Food enterprise executives who book a demo for a plant-specific ROI session typically encounter four cost categories they had not previously linked to their multi-plant architecture problem.
Predictive Maintenance Gaps — The Hidden Downtime Tax
When predictive maintenance software operates at a single-plant level, asset failure patterns visible only in aggregate remain hidden until they produce downtime events. A conveyor motor failure appearing at Plants 1, 4, and 9 within 60 days is a fleet-level signal—but only enterprises with cross-facility industrial IoT analytics can see it. Without this view, each failure is an isolated event and the downtime tax accumulates invisibly across the enterprise asset portfolio.
Cross-Facility KPI Benchmarking — The Cost of Not Knowing
Every multi-plant enterprise contains performance variation between its best and worst facilities. Cross-facility KPI tracking through a unified enterprise analytics dashboard converts this latent opportunity into a structured improvement program. Food enterprises without this capability leave measurable efficiency gains uncaptured because they cannot see what their top-performing facilities are doing differently.
How an Industrial Analytics Platform Restores Multi-Plant Visibility
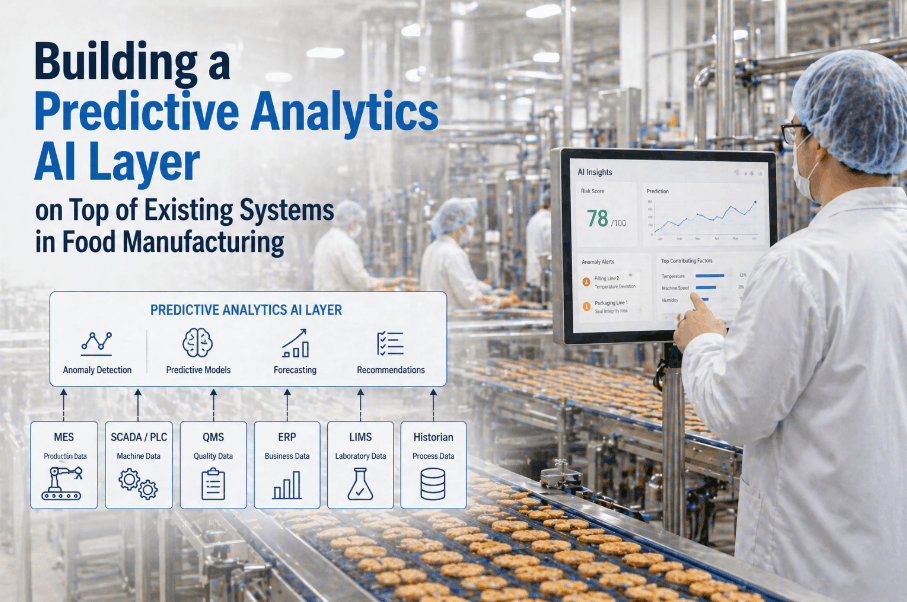
The solution is an industrial analytics platform that sits above all facility-level systems—ingesting data from every MES, IoT sensor network, LIMS, and ERP instance—and normalizing it into a unified enterprise intelligence layer. Food enterprises that book a demo typically discover their existing plant-level data is richer than realized—what was missing was the aggregation layer above it, not the raw data beneath it.
Enterprise Analytics Dashboard — One Source of Operational Truth
A properly configured enterprise analytics dashboard gives leadership a real-time, plant-comparable view of OEE, yield, downtime, quality deviation rates, and asset health—all in standardized formats across every facility. Plant managers keep facility-level views; enterprise leadership gains the cross-facility synthesis that enables genuine strategic governance rather than anecdotal site-visit impressions.
Manufacturing Intelligence Software — From Correlation to Causation
Manufacturing intelligence goes beyond data aggregation to identify causal relationships between process variables and outcomes across facilities. When Plant 6's changeover efficiency improvement correlates with a specific sanitation protocol change, that insight becomes visible to every other facility managing equivalent complexity—systematically raising the operational floor across the entire enterprise.
| Operational Dimension | Fragmented Approach | Unified Analytics Platform | Enterprise Impact |
|---|---|---|---|
| KPI Visibility | Plant-level, non-standardized reports | Real-time enterprise dashboard with normalized cross-facility KPIs | 31% OEE gap closed in 18 months |
| Asset Performance | Reactive maintenance per plant | Predictive maintenance with cross-facility failure detection | Downtime reduced 55–67% |
| Compliance Monitoring | Site-level audit prep, 3–5 days each | Centralized digital compliance log, all facilities | Audit prep cut 70%+ enterprise-wide |
| Supply Chain Visibility | Per-plant receiving, no cross-site relay | Enterprise supply chain software with lot-level risk scoring | Risk flagging accuracy: 94% |
| Quality Event Response | Plant-isolated deviation management | Cross-facility monitoring with enterprise-level triage | Resolution time reduced 48% |
| Best Practice Transfer | Site visits and anecdotal sharing | Manufacturing intelligence with automated performance correlation | Bottom-quartile improvement: 22% avg. |
Three-Phase Deployment Framework for Enterprise Visibility
Deploying an industrial analytics platform across multiple facilities requires a structured sequence that builds data quality before activating enterprise intelligence. Skipping the normalization phase generates false-positive alerts that erode operator trust. Food enterprises should book a demo to receive a facility-specific integration complexity assessment before committing to a timeline.
Data Architecture Unification & MES Integration
Audit all facility-level MES systems, sensor networks, and ERP connections. Establish a validated enterprise data historian that normalizes inputs from every plant into a single schema. Map and enforce KPI definitions enterprise-wide before activating any analytics layer.
Dashboard Activation & KPI Standardization
Launch the enterprise analytics dashboard with standardized cross-facility KPI views, activate predictive maintenance software modules, and deploy real-time alerting across all plants. This is where multi-plant visibility becomes operationally real for enterprise leadership.
Manufacturing Intelligence & Compliance Automation
Activate cross-facility best-practice transfer engines, enterprise supply chain visibility integration, and automated FSMA compliance reporting. The platform's predictive accuracy compounds continuously as it accumulates cross-facility performance pattern data.
Multi-Plant Visibility in Action — Enterprise Use Cases
The impact of enterprise-wide manufacturing intelligence differs significantly across functional roles. Here are the primary use cases where cross-facility KPI tracking and industrial IoT analytics deliver measurable outcomes.
Real-Time Cross-Facility Governance
A single-screen view of every facility's OEE, yield, downtime, and quality deviation—updated in real time and comparable across all plants. Capital allocation and performance decisions become data-driven, not impression-driven.
Fleet-Level Asset Performance Management
Cross-facility asset health trends and predictive alerts spanning every instrumented asset in the enterprise fleet. A bearing degradation pattern across multiple plants triggers a coordinated procurement and scheduling response—not isolated reactive repairs.
Enterprise Compliance & Audit Readiness
Simultaneous compliance monitoring across every facility with automated alerts surfacing cross-plant deviation patterns before they escalate. Inspector-ready audit documentation generated continuously for every plant—eliminating the distributed audit prep burden.
The Financial Case for Enterprise Operational Visibility Software
Downtime Cost Elimination
Unplanned downtime averages $18,000–$65,000 per hour per facility. Asset performance management through industrial IoT analytics reduces downtime events by 55–67% within 12 months. Enterprises building this case find that booking a demo produces a plant-specific downtime cost model in under an hour.
Performance Gap Closure
The 31% average OEE spread between top and bottom-quartile plants is the largest untapped efficiency reserve in any multi-plant enterprise. Manufacturing intelligence software systematically transfers best practices from high to low performers—closing this gap at a pace no site-visit program can match.
Compliance & Recall Risk
Enterprise-wide compliance monitoring significantly reduces regulatory exposure across all facilities. For a ten-plant food enterprise, the cost of a single Class I recall event ($10M+ average) dwarfs the entire platform investment many times over.
Enterprise Multi-Plant Visibility — KPI Impact Benchmarks
Average improvements achieved within 12 months of full enterprise analytics platform deployment across iFactory's multi-plant food manufacturing customer base.
Multi-Plant Operational Visibility — Frequently Asked Questions
What is the multi-plant chaos problem in food manufacturing?
It describes the state where enterprise food manufacturers have outgrown their operational intelligence infrastructure. As facilities are added, disconnected MES instances and non-standardized KPIs create a compounding visibility deficit that prevents enterprise leadership from accurately assessing real-time performance across the enterprise.
How does an industrial analytics platform differ from a standard MES?
A manufacturing execution system operates at the plant level within a single facility. An industrial analytics platform sits above all plant MES instances, normalizing their outputs into a unified enterprise data model and applying machine learning to generate cross-facility intelligence no single-plant system can produce.
Can cross-facility KPI tracking work with different MES systems per plant?
Yes. Modern enterprise analytics platforms ingest data from heterogeneous source systems—multiple MES vendors, SCADA configurations, and ERP instances—and normalize them into a standardized enterprise schema. Most enterprises achieve meaningful visibility with 70–80% of data sources connected at launch.
How does predictive maintenance software work across multiple plants?
Predictive maintenance software ingests asset sensor data from all facilities into a centralized industrial IoT analytics engine. Machine learning models identify cross-facility degradation signals that are invisible at the single-plant level—surfacing fleet-level maintenance priorities that reactive programs would never detect.
What is the typical implementation timeline for a multi-plant enterprise deployment?
Enterprise deployments spanning five or more plants typically require 16–28 weeks for full operational visibility activation. Enterprises with existing IoT infrastructure can achieve initial dashboard visibility within 6–10 weeks, with iFactory's pre-deployment assessment significantly reducing integration complexity.
What is the typical ROI payback period?
Most food enterprises achieve full payback within 10–16 months of full deployment, driven by downtime cost elimination and performance gap closure. ROI accelerates as the platform accumulates facility-specific performance pattern data and compounds across the entire plant portfolio.
End the Multi-Plant Chaos Problem With Enterprise-Wide Operational Intelligence
iFactory's industrial analytics platform delivers real-time cross-facility KPI tracking, predictive maintenance intelligence, and enterprise-wide compliance monitoring—purpose-built for food and beverage enterprises that cannot afford invisible operations.